Hello, students
For the visualization of decision tree, I think the method introduced before is amazing enough( Decision tree visualization is amazing! ), I didn't expect to find a more amazing and realistic one recently. I don't say much. Let's look at the renderings first ↓

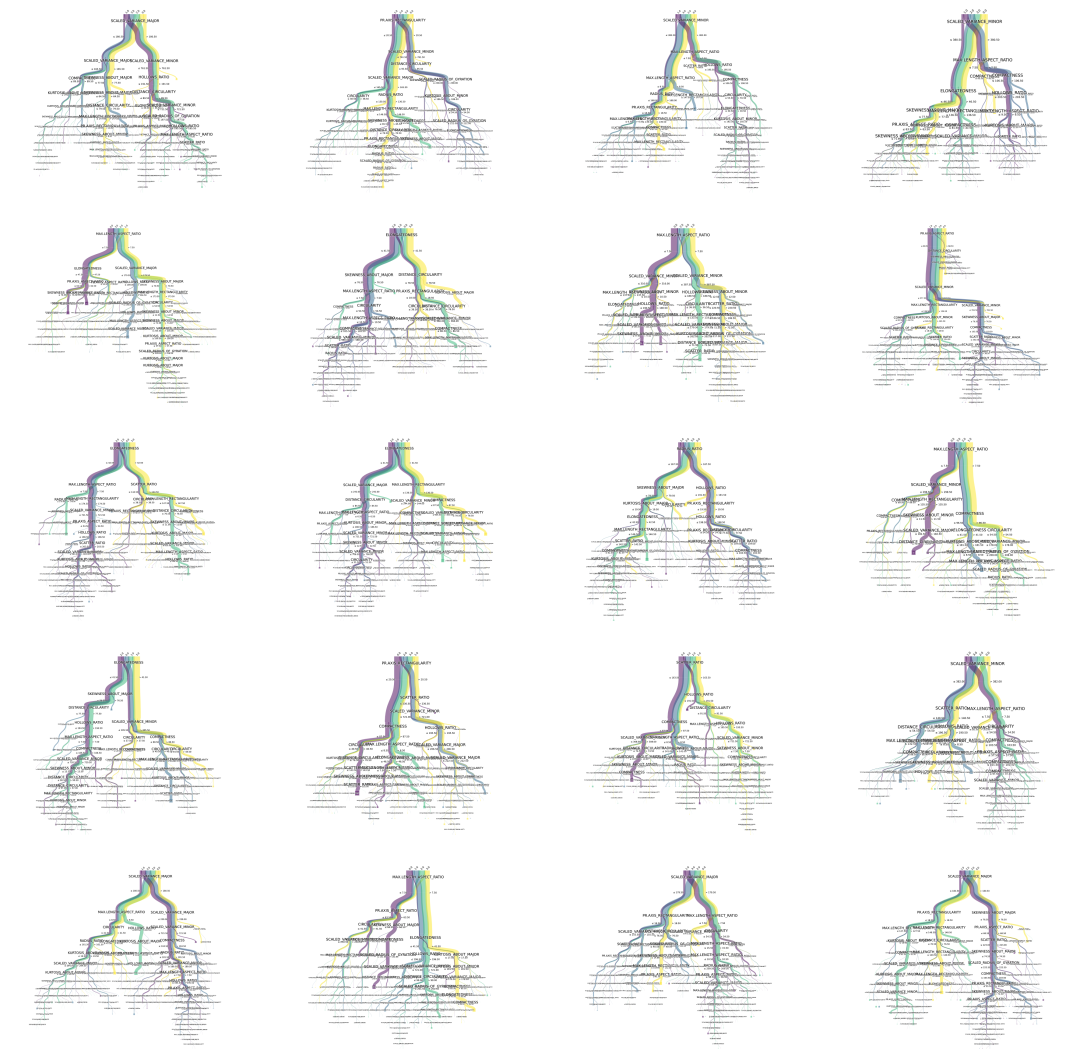
It's no problem to draw random forests directly
Now let's introduce this artifact - pybaobabdt
Installing GraphViz
pybaobabdt relies on GraphViz. Download the installation package first
http://www.graphviz.org/download/
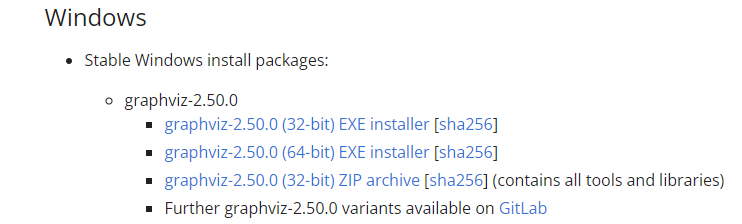
http://www.graphviz.org/download/
2. Double click the msi file and keep selecting next (the default installation path is C: \ program files (x86) \ graphviz2 38 \), after installation, shortcut information will be created in the windows start menu.

3. Configure environment variables: computer → properties → advanced system settings → advanced → environment variables → system variables → path. Add path to path:

4. Verification: in the windows command line interface, enter dot -version, and then press enter. If the relevant version information of graphviz as shown in the figure below is displayed, the installation and configuration is successful.

Install pygraphviz and pybaobabdt
If pip installs pygraphviz directly, it will probably report an error. It is recommended to download the whl file and install it locally.
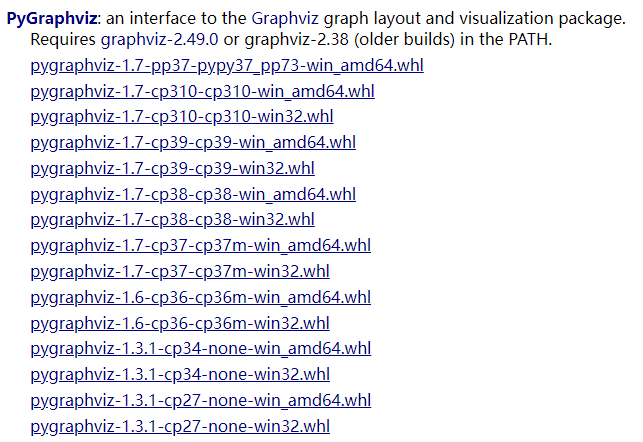
https://www.lfd.uci.edu/~gohlke/pythonlibs
Pybaobabdt is simple. Just pip install pybaobabdt
pybaobabdt usage
Pybaobabdt is also ridiculously simple to use. The core command is only one pybaobabdt Drawtree, the following is the sample code of the official document. It is recommended to run it in Jupiter notebook.
import pybaobabdt
import pandas as pd
from scipy.io import arff
from sklearn.tree import DecisionTreeClassifier
from matplotlib.colors import LinearSegmentedColormap
from matplotlib.colors import ListedColormap
from colour import Color
import matplotlib.pyplot as plt
import numpy as np
data = arff.loadarff('vehicle.arff')
df = pd.DataFrame(data[0])
y = list(df['class'])
features = list(df.columns)
features.remove('class')
X = df.loc[:, features]
clf = DecisionTreeClassifier().fit(X, y)
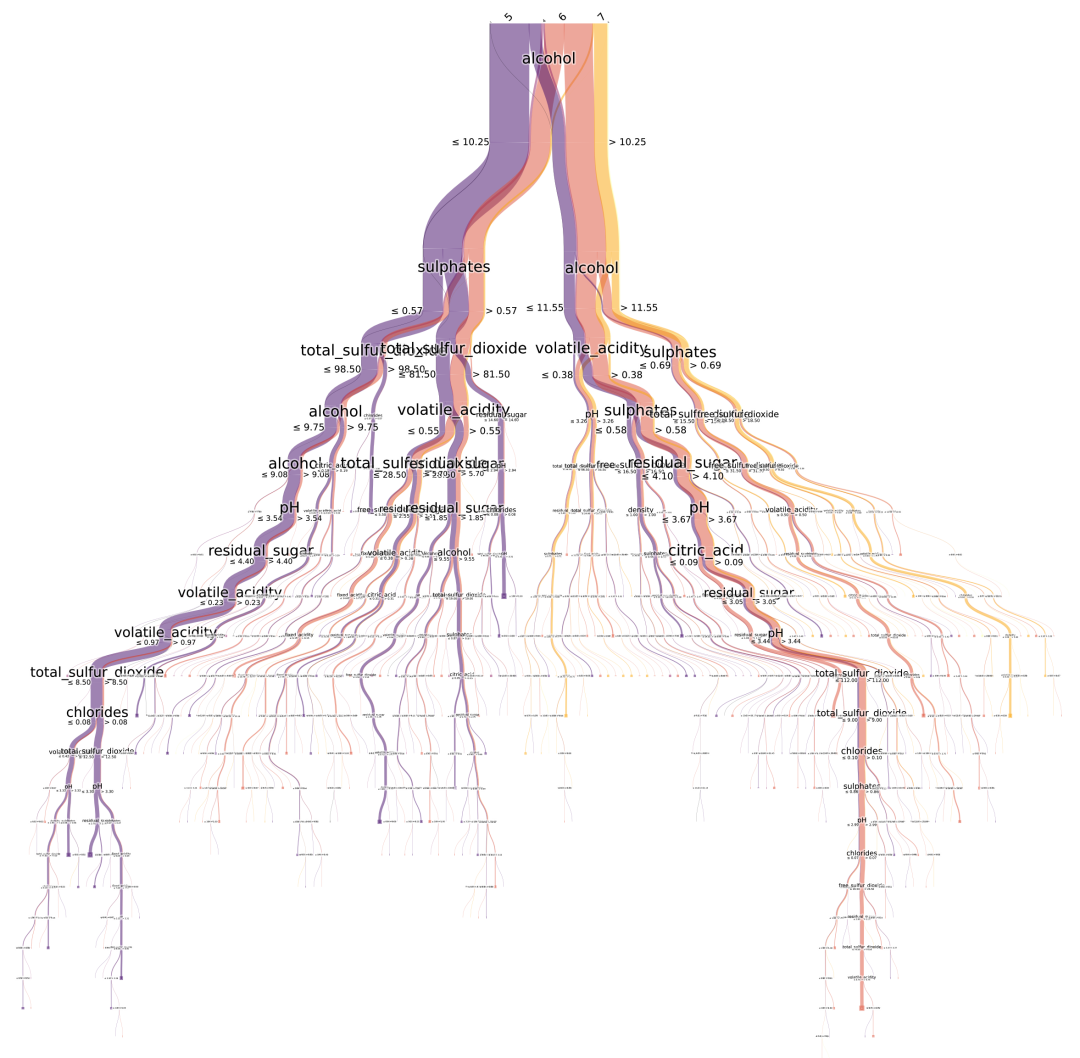
ax = pybaobabdt.drawTree(clf, size=10, dpi=72, features=features, colormap='Spectral')
What do you think of this picture?
Different colors correspond to different categories (target s), and each fork is marked with the condition of division, so the division logic is clear at a glance. The depth of the tree is also neatly reflected.
The diameter of branches is not decoration, but represents the number (proportion) of samples. The more samples under this division condition, the thicker the trunk.
When you find that the branches at the bottom are too thin and fragile, should you consider the risk of over fitting, such as the need to adjust the minimum number of samples?
Draw random forest
import pybaobabdt
import pandas as pd
from scipy.io import arff
import matplotlib.pyplot as plt
from sklearn.ensemble import RandomForestClassifier
data = arff.loadarff('vehicle.arff')

df = pd.DataFrame(data[0])
y = list(df['class'])
features = list(df.columns)
features.remove('class')
X = df.loc[:, features]

clf = RandomForestClassifier(n_estimators=20, n_jobs=-1, random_state=0)
clf.fit(X, y)
size = (15,15)
plt.rcParams['figure.figsize'] = size
fig = plt.figure(figsize=size, dpi=300)

for idx, tree in enumerate(clf.estimators_):
    ax1 = fig.add_subplot(5, 4, idx+1)
    pybaobabdt.drawTree(tree, model=clf, size=15, dpi=300, features=features, ax=ax1)

fig.savefig('random-forest.png', format='png', dpi=300, transparent=True)
How to use it? Isn't it cool? Go and try it quickly!
reference resources: https://mp.weixin.qq.com/s/uIazCL9SjNDguu59up5KjA