Tushare big data community - I have everything I want
Wande is too expensive? Reptiles don't? But what if we still need financial data? Tushare big data community: I have everything! (tushare ID: 436348)
For economic and management researchers, financial data is just needed. A clever woman can't make bricks without straw. In most empirical studies, good data is the sharp weapon for publishing documents and periodicals, but I know that I buy Wande There are relatively few universities in guotai'an database (Xiaobian's school is a 211 university, only Rex bought the database, and some data do not have permission). And Tushare big data community can become an important source of your data! There are student permissions, and free data is not easy to use!
for who?
Through the above words, you may also see that this blog is mainly aimed at the economic and management scientific research workers with financial data needs, especially the scientific research Xiaobai who has just entered graduate school. If you are a student or a teacher in school, by applying for student permission, the data you can get can basically meet your scientific research needs
What are the contents?
tushare itself provides very abundant data, and focuses on what data can be obtained after applying for student rights, including but not limited to stock index, fund, futures and options market data, balance sheet, profit statement and other basic data of company, and GDP, price index and other macro data. There are also offbeat data such as news communication, COVID-19 and so on. It can be said that it is really rich. For more specific information, please refer to Official website: https://tushare.pro/
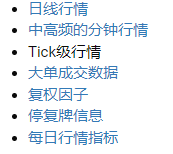
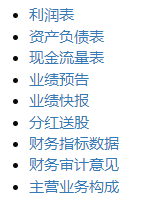
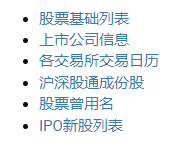
. . . Wait, wait
How about data quality?
For the same data, the data provided by Tushare big data community is quite reliable. Here is an example of python. (compare with some data) (the codes in the following are completed in jupyter)
A comparative example of Shanghai Stock Exchange 50 index data
First look at the data on tushare
Import necessary packages
import numpy as np
import pandas as pd
import tushare as ts
import matplotlib.pyplot as plt
ts.set_token('##############')
#You need to write your own token in parentheses
pro = ts.pro_api()
Import the data of Shanghai 50 Index in March 2021
szh_tS = pro.index_daily(ts_code='000016.SH', start_date='20210301', end_date='20210331')
szh_tS.iloc[:,0:9]
#The following is the output of jupyter
    ts_code 	trade_date 	close	    open	    high	    low	        pre_close	change
0	000016.SH	20210331	3539.3696	3573.8565	3573.8565	3518.1678	3577.2434	-37.8738
1	000016.SH	20210330	3577.2434	3541.3771	3582.0181	3531.6295	3537.7110	39.5324
2	000016.SH	20210329	3537.7110	3543.2452	3563.4001	3510.4110	3529.7282	7.9828
3	000016.SH	20210326	3529.7282	3483.6948	3539.2260	3480.3337	3463.8727	65.8555
4	000016.SH	20210325	3463.8727	3454.4611	3479.1275	3439.5127	3466.0422	-2.1695
5	000016.SH	20210324	3466.0422	3507.5484	3528.7345	3457.4445	3516.3626	-50.3204
6	000016.SH	20210323	3516.3626	3541.3289	3542.8163	3482.5866	3538.4271	-22.0645
7	000016.SH	20210322	3538.4271	3516.6567	3558.9361	3511.7241	3512.0203	26.4068
8	000016.SH	20210319	3512.0203	3565.0925	3573.0574	3496.3815	3605.6047	-93.5844
9	000016.SH	20210318	3605.6047	3598.8499	3619.3306	3586.5036	3590.8339	14.7708
10	000016.SH	20210317	3590.8339	3588.2332	3616.9357	3552.4871	3599.1646	-8.3307
11	000016.SH	20210316	3599.1646	3579.0111	3608.1148	3556.6180	3566.8773	32.2873
12	000016.SH	20210315	3566.8773	3620.0419	3627.3069	3539.4859	3632.5784	-65.7011
13	000016.SH	20210312	3632.5784	3647.5097	3647.5097	3600.3919	3625.3052	7.2732
14	000016.SH	20210311	3625.3052	3554.6825	3633.7724	3554.6825	3532.0523	93.2529
15	000016.SH	20210310	3532.0523	3563.5639	3572.3740	3528.3165	3509.6137	22.4386
16	000016.SH	20210309	3509.6137	3570.2561	3595.1858	3489.9697	3573.4310	-63.8173
17	000016.SH	20210308	3573.4310	3713.4587	3732.7790	3571.4154	3688.6818	-115.2508
18	000016.SH	20210305	3688.6818	3655.9072	3721.2755	3627.2889	3708.6606	-19.9788
19	000016.SH	20210304	3708.6606	3769.9730	3781.2754	3686.0903	3817.4128	-108.7522
20	000016.SH	20210303	3817.4128	3710.2632	3818.0719	3708.2309	3718.7739	98.6389
21	000016.SH	20210302	3718.7739	3812.3503	3812.3503	3689.0111	3787.8695	-69.0956
22	000016.SH	20210301	3787.8695	3793.3653	3795.0518	3747.5791	3756.8597	31.0098
Then take the closing price as a comparison
szh_tS.index=szh_tS['trade_date']
szh_tS1=szh_tS[['close']]
szh_tSf=szh_tS1.sort_index()
szh_tSI=szh_tSf.index
szh_tSf.index = pd.DatetimeIndex(szh_tSI)
szh_tSf
#The following is the output from jupyter

trade_date	close
2021-03-01	3787.8695
2021-03-02	3718.7739
2021-03-03	3817.4128
2021-03-04	3708.6606
2021-03-05	3688.6818
2021-03-08	3573.4310
2021-03-09	3509.6137
2021-03-10	3532.0523
2021-03-11	3625.3052
2021-03-12	3632.5784
2021-03-15	3566.8773
2021-03-16	3599.1646
2021-03-17	3590.8339
2021-03-18	3605.6047
2021-03-19	3512.0203
2021-03-22	3538.4271
2021-03-23	3516.3626
2021-03-24	3466.0422
2021-03-25	3463.8727
2021-03-26	3529.7282
2021-03-29	3537.7110
2021-03-30	3577.2434
2021-03-31	3539.3696
Load the data of a good thought
shz50=pd.read_csv(lj+"shangzhRs.csv",index_col='Transaction date_TrdDt',parse_dates=['Transaction date_TrdDt'],encoding='gbk')
shz50['2021-03']['Closing price(element/spot)_ClPr']
##The following is the output from jupyter
 Transaction date_TrdDt
2021-03-01    3787.87
2021-03-02    3718.77
2021-03-03    3817.41
2021-03-04    3708.66
2021-03-05    3688.68
2021-03-08    3573.43
2021-03-09    3509.61
2021-03-10    3532.05
2021-03-11    3625.31
2021-03-12    3632.58
2021-03-15    3566.88
2021-03-16    3599.16
2021-03-17    3590.83
2021-03-18    3605.60
2021-03-19    3512.02
2021-03-22    3538.43
2021-03-23    3516.36
2021-03-24    3466.04
2021-03-25    3463.87
2021-03-26    3529.73
2021-03-29    3537.71
2021-03-30    3577.24
2021-03-31    3539.37
Name: Closing price(element/spot)_ClPr, dtype: float64
Put the two data together
szh_tSf['close_Rs']=shz50['2021-03']['Closing price(element/spot)_ClPr']
szh_tSf
##The following is the output from jupyter
				close	close_Rs
trade_date
2021-03-01	3787.8695	3787.87
2021-03-02	3718.7739	3718.77
2021-03-03	3817.4128	3817.41
2021-03-04	3708.6606	3708.66
2021-03-05	3688.6818	3688.68
2021-03-08	3573.4310	3573.43
2021-03-09	3509.6137	3509.61
2021-03-10	3532.0523	3532.05
2021-03-11	3625.3052	3625.31
2021-03-12	3632.5784	3632.58
2021-03-15	3566.8773	3566.88
2021-03-16	3599.1646	3599.16
2021-03-17	3590.8339	3590.83
2021-03-18	3605.6047	3605.60
2021-03-19	3512.0203	3512.02
2021-03-22	3538.4271	3538.43
2021-03-23	3516.3626	3516.36
2021-03-24	3466.0422	3466.04
2021-03-25	3463.8727	3463.87
2021-03-26	3529.7282	3529.73
2021-03-29	3537.7110	3537.71
2021-03-30	3577.2434	3577.24
2021-03-31	3539.3696	3539.37
It can be seen from the above data that the data provided by tushare is accurate to 4 decimal places. After rounding and retaining 2 decimal places, it is no different from the data of Yousi. Therefore, in terms of data quality, tushare's data is very qualified.
How to get it?
The acquisition of tushare data is relatively simple and can be obtained through a variety of methods. For academic Xiaobai of economics and management, it is recommended to learn a simple programming, which will also be helpful for your future thesis writing.
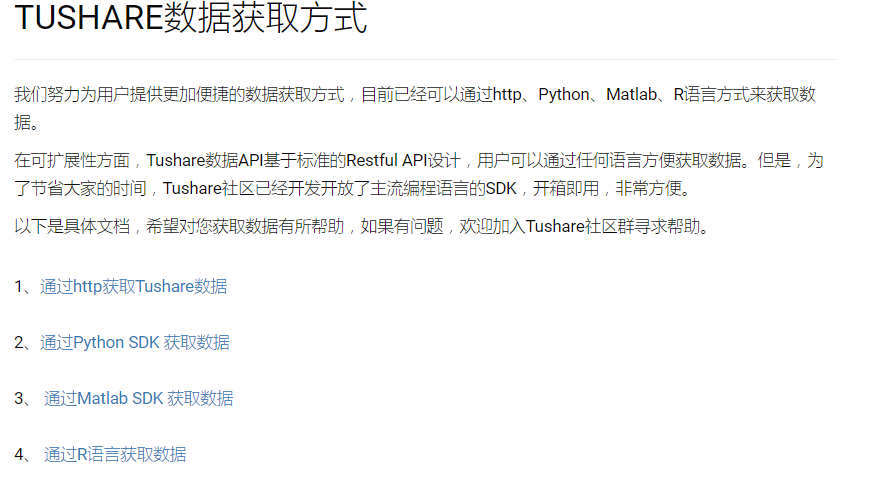
For small partners with programming foundation, it's not easy to get started with data in an afternoon. If you don't want to take the trouble to remember, you can also refer to the tushare data interface tushare data interface The examples given are easy to use and check!
Write at the end
Tushare has rich data and easy access. It is very friendly to college students. If you also need financial data, tushare can become your data backing.
I intend to start the time series column. Those who are interested can praise and encourage!
Thanks for watching
Thank you for watching. I hope this article can help you!