Content Review:
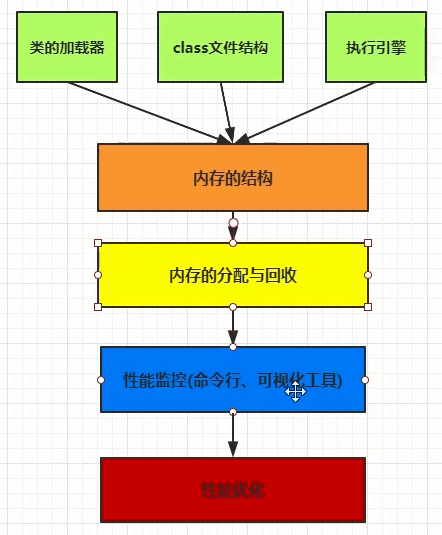
1. Core overview of Heap
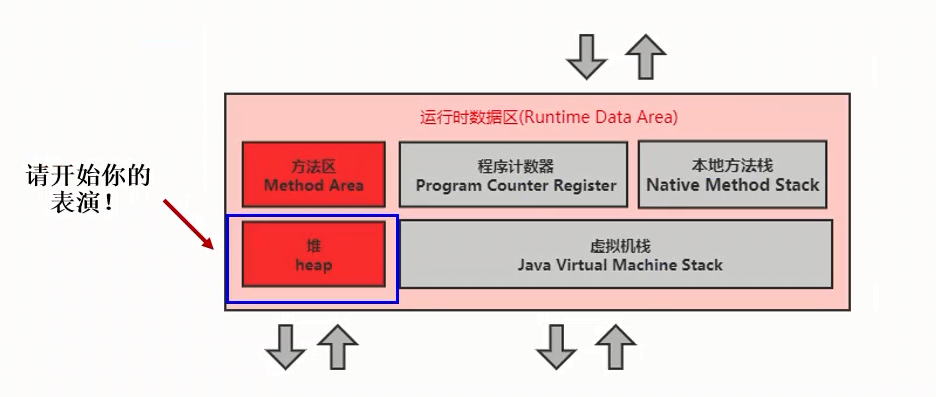
Description of 1.1 heap memory
- There is only one heap memory for a JVM instance, and the heap is also the core area of Java memory management.
- The Java heap area is created when the JVM starts and its size is determined. It is the largest piece of memory space managed by the JVM.
- The size of heap memory is adjustable.
- The Java Virtual Machine Specification states that a heap can be in physically discontinuous memory space, but logically it should be considered continuous.
- All threads share a Java heap, where threads'private buffers (Thread Local Allocation Buffer, TLAB) can also be divided.
Example:
package com.atguigu.java;

/**
 * -Xms10m -Xmx10m
 *
 * @author shkstart  shkstart@126.com
 * @create 2020  16:41
 */
public class HeapDemo {
    public static void main(String[] args) {
        System.out.println("start...");
        try {
            Thread.sleep(1000000);
        } catch (InterruptedException e) {
            e.printStackTrace();
        }

        System.out.println("end...");
    }

}
package com.atguigu.java;

/**
 * -Xms20m -Xmx20m
 * @author shkstart  shkstart@126.com
 * @create 2020  16:42
 */
public class HeapDemo1 {
    public static void main(String[] args) {
        System.out.println("start...");
        try {
            Thread.sleep(1000000);
        } catch (InterruptedException e) {
            e.printStackTrace();
        }

        System.out.println("end...");
    }
}
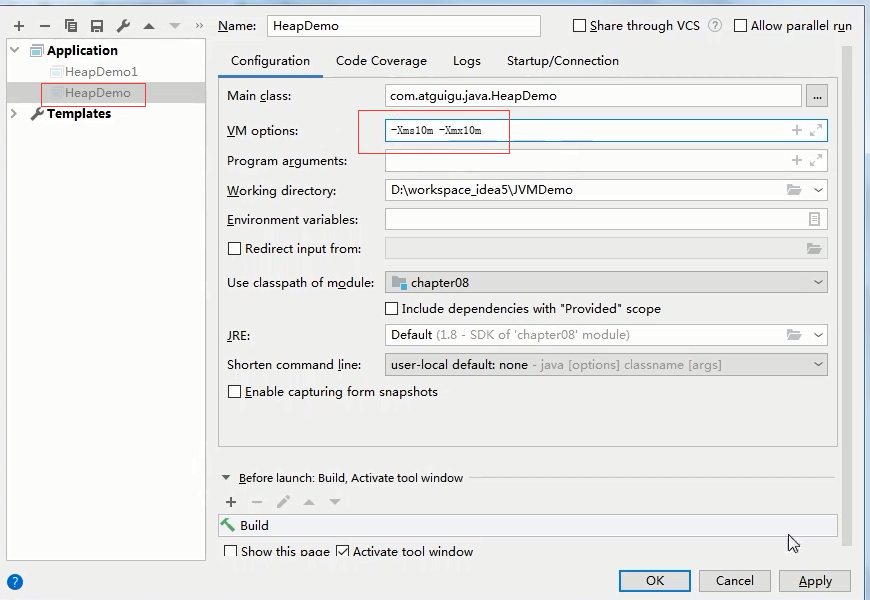
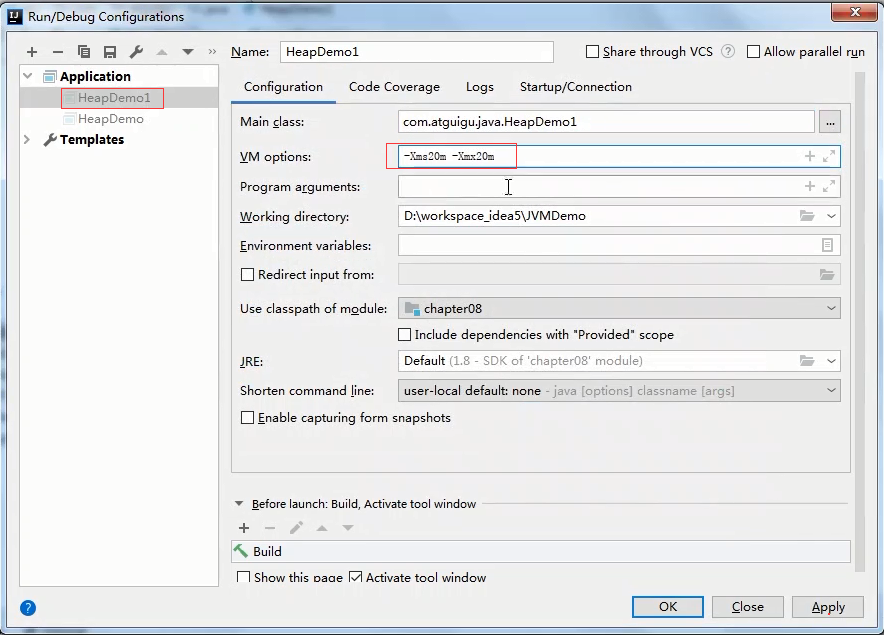
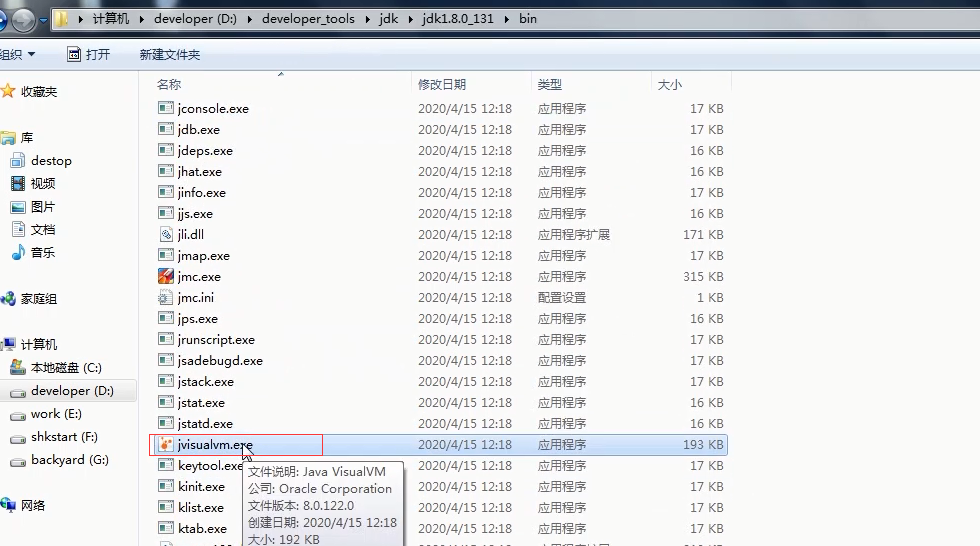
Execute two programs
Open the jvisualvm.exe tool in the jdk/bin directory
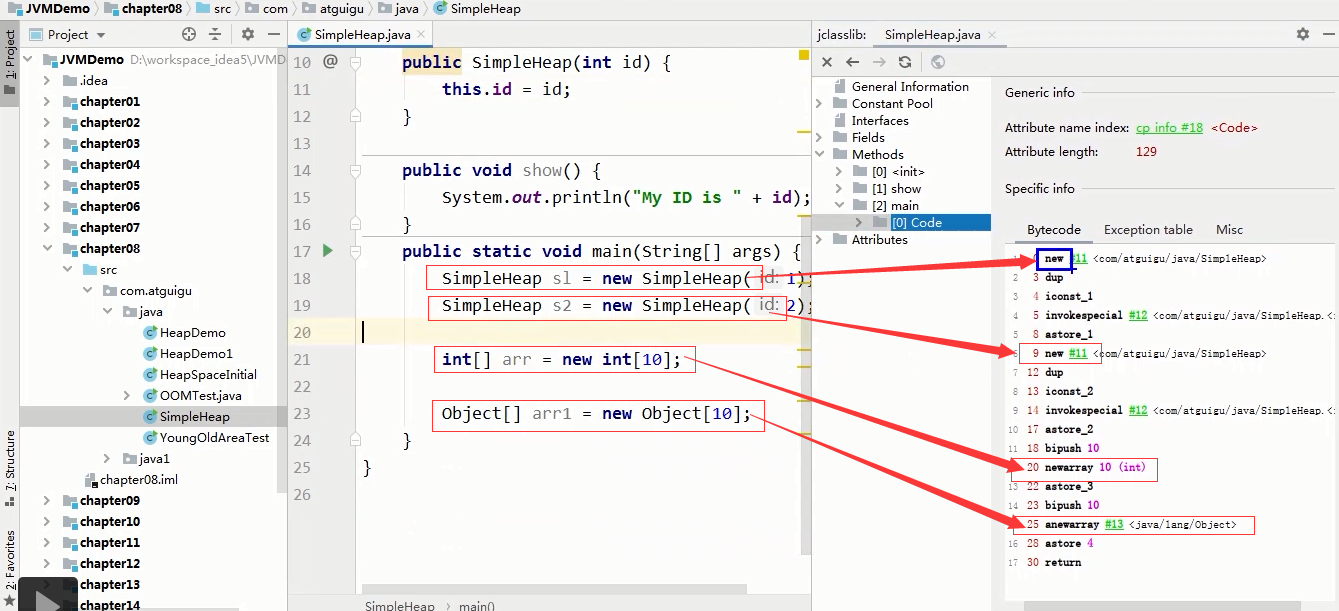
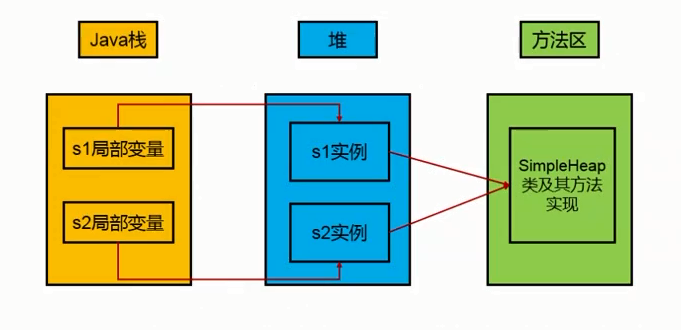
- The description of the Java heap in the Java Virtual Machine Specification is that all object instances and arrays should be allocated on the heap at run time. (The heap is the run-time data area from which memory for all class instances and arrays is allocated)
- What I want to say is, "Almost all object instances allocate memory here." - From a practical point of view.
- Arrays and objects may never be stored on the stack because a reference is saved in the stack frame that points to the object or the location of the array in the stack.
- At the end of the method, objects in the heap are not removed immediately; they are only removed when garbage is collected.
- A heap is a key area for a GC (Garbage Collection) to perform garbage collection.
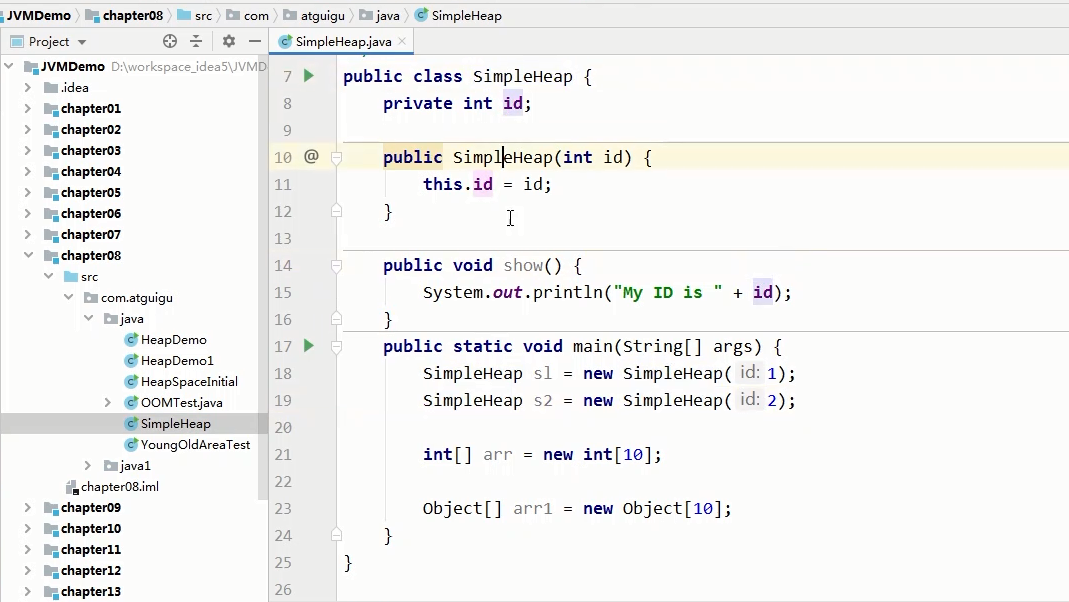
Example: The following example corresponds to the image below
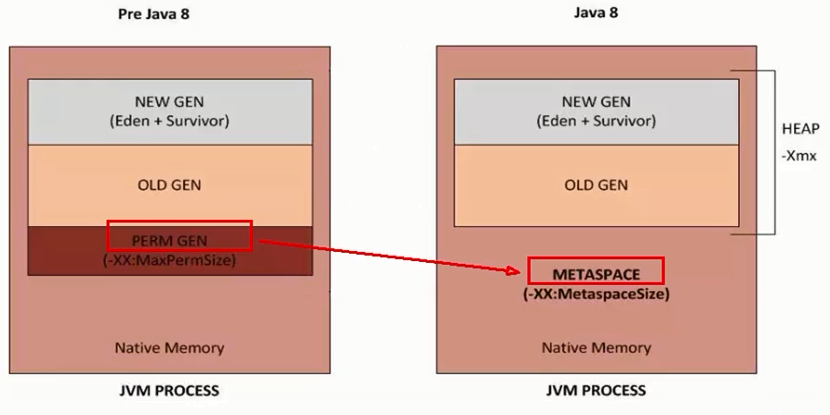
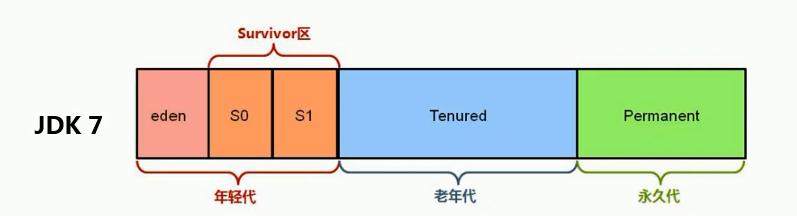
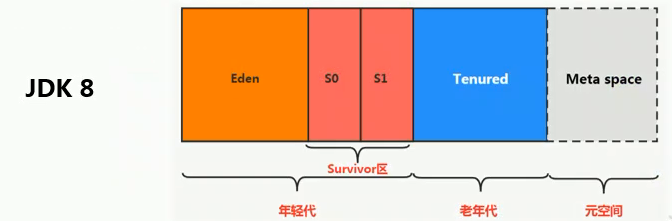
1.2 heap memory subdivision
Most modern garbage collectors are designed based on the theory of generational collection, with heap space subdivided into:
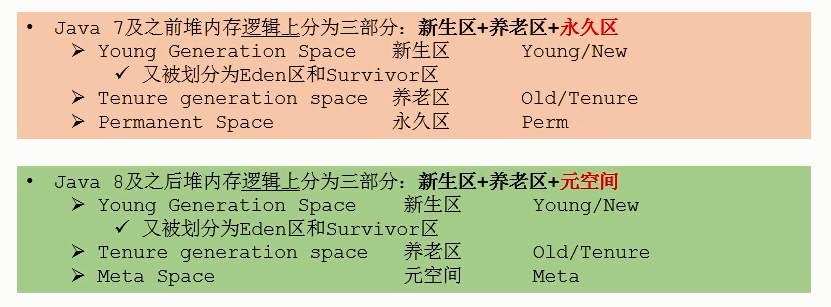
Contract: New Zone <->New Generation <->Youth Generation <->Old Zone <->Old Generation <->Permanent Zone <->Permanent Generation
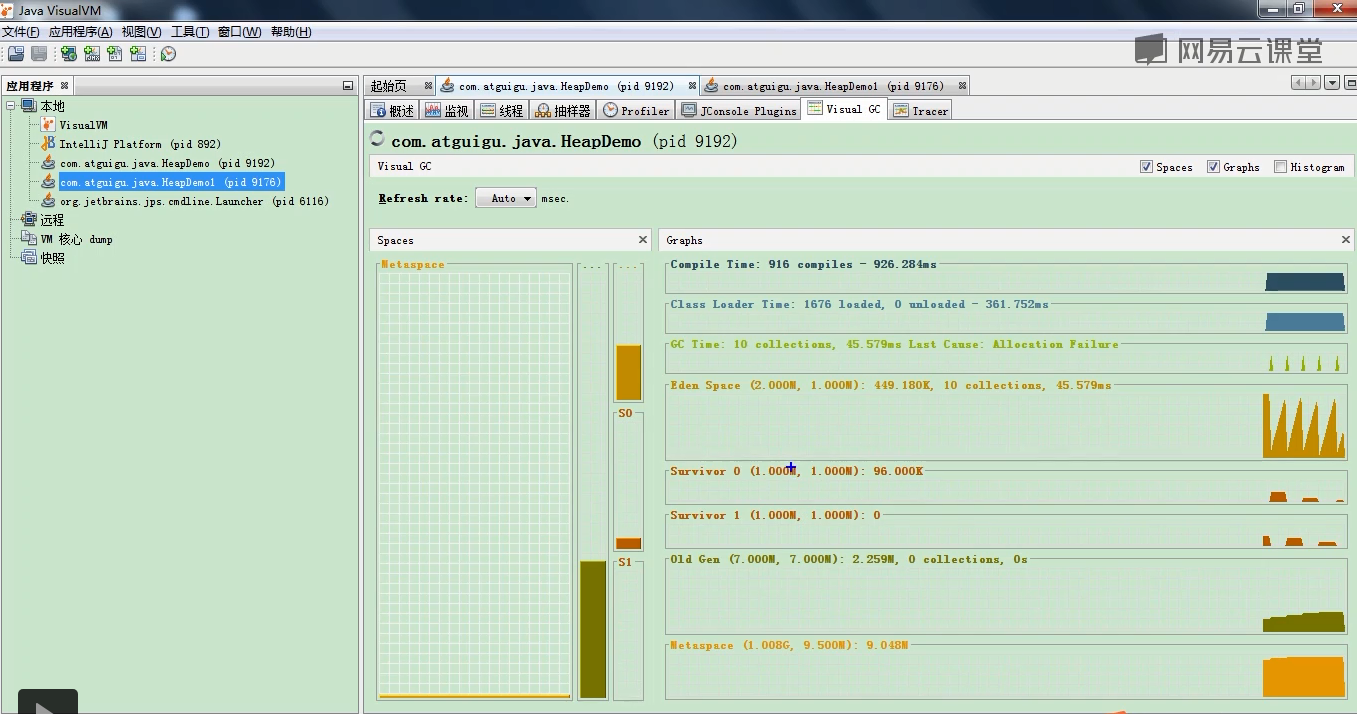
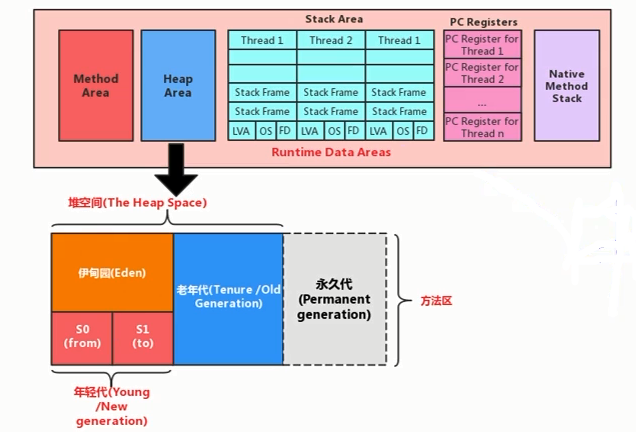
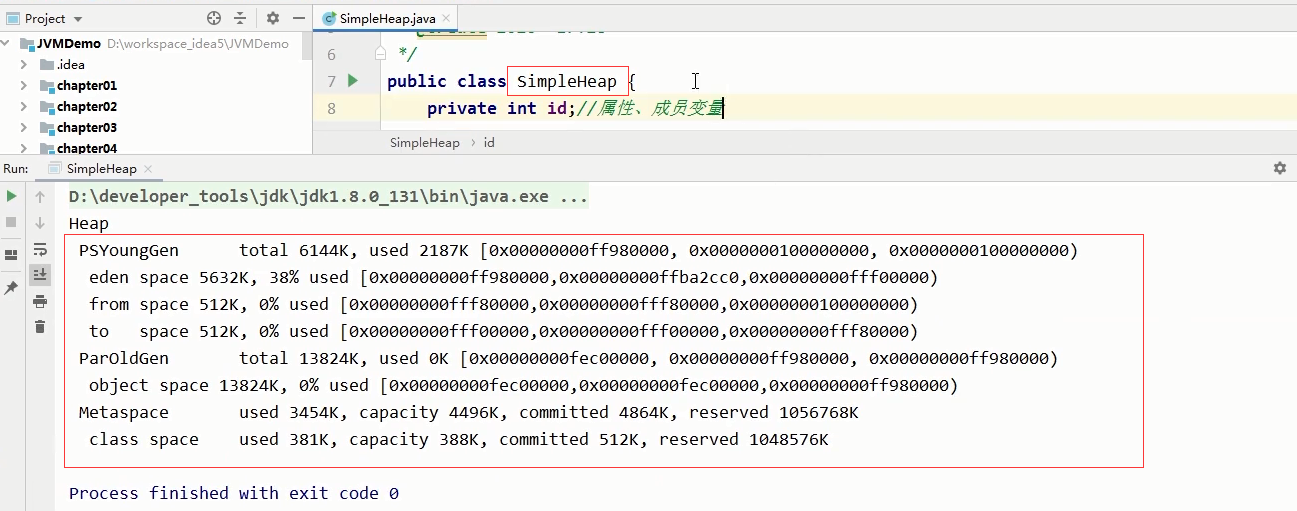
1.2.3 Heap Space Internal Structure
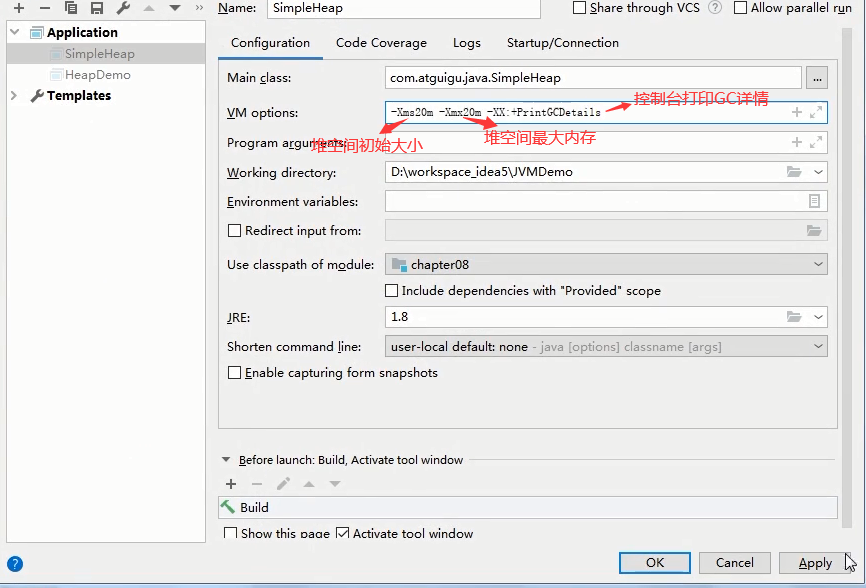
Print the GC details of the SimpleHeap.java class in the example above, execute the program
2. Set heap memory size and OOM
2.1 Set heap memory size
- The Java heap is used to store Java object instances, so the size of the heap is set when the JVM starts. You can set it by choosing'-Xmx'and'-Xms'.
- '-Xms'is used to represent the starting memory of the heap area, equivalent to -XX:InitialHeapSize
- "-Xmx" is used to represent the maximum memory in the heap, equivalent to -XX:MaxHeapSize
- An OutOfMemoryError exception will be thrown once the memory size in the heap exceeds the maximum memory specified by'-Xmx'.
- Typically, the -Xms and -Xmx parameters are configured with the same value to provide performance without having to re-separate the calculated heap size after the java garbage collection mechanism has cleaned up the heap.
- By default, initial memory size: physical computer memory size / 64; maximum memory size: physical computer memory size / 4
Example:
package com.atguigu.java;
/**
* 1. Parameters for setting heap space size
* -Xms Initial memory size used to set heap space (younger generation + older generation)
* -X Is the running parameter of the jvm
* ms Is memory start
* -Xmx Maximum memory size used to set heap space (younger generation + older generation)
*
* 2. Default heap space size
* Initial memory size: physical computer memory size / 64
* Maximum memory size: physical computer memory size / 4
*
* 3. Manual setting: -Xms600m-Xmx600m
* It is recommended that initial and maximum heap memory be set to the same value during development.
*
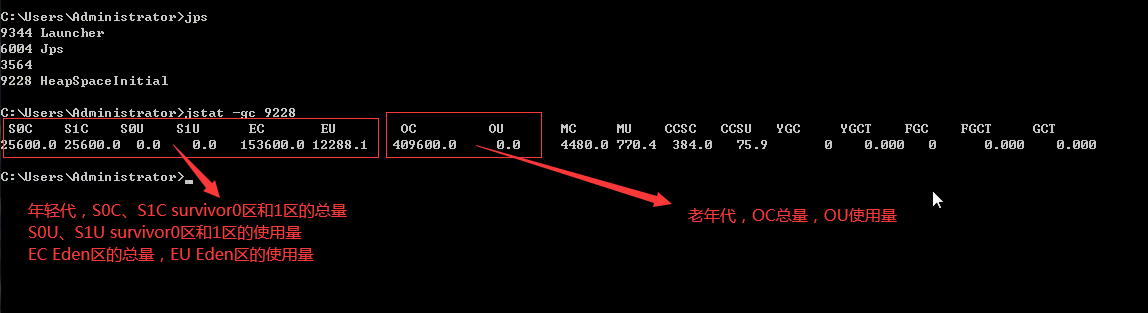
* 4. View the set parameters: Mode 1: jps-l / jstat-gc process id
* Mode 2: -XX:+PrintGCDetails
*
* @author shkstart shkstart@126.com
* @create 2020 20:15
*/
public class HeapSpaceInitial {
public static void main(String[] args) {
//Returns the total amount of heap memory in the Java virtual machine
long initialMemory = Runtime.getRuntime().totalMemory() / 1024 / 1024;
//Returns the maximum amount of heap memory the Java virtual machine is trying to use
long maxMemory = Runtime.getRuntime().maxMemory() / 1024 / 1024;
System.out.println("-Xms : " + initialMemory + "M");
System.out.println("-Xmx : " + maxMemory + "M");
System.out.println("System memory size is:" + initialMemory * 64.0 / 1024 + "G");
System.out.println("System memory size is:" + maxMemory * 4.0 / 1024 + "G");
try {
Thread.sleep(1000000);
} catch (InterruptedException e) {
e.printStackTrace();
}
}
}
2.2 OOM
Example:
package com.atguigu.java;

import java.util.ArrayList;
import java.util.Random;

/**
 * -Xms600m -Xmx600m
 * @author shkstart  shkstart@126.com
 * @create 2020  21:12
 */
public class OOMTest {
    public static void main(String[] args) {
        ArrayList<Picture> list = new ArrayList<>();
        while(true){
            try {
                Thread.sleep(20);
            } catch (InterruptedException e) {
                e.printStackTrace();
            }
            // Create many Picture objects in heap space
            list.add(new Picture(new Random().nextInt(1024 * 1024)));
        }
    }
}

class Picture{
    //In heap space
    private byte[] pixels;

    public Picture(int length) {
        this.pixels = new byte[length];
    }
}
Result
Exception in thread "main" java.lang.OutOfMemoryError: Java heap space
	at com.atguigu.java.Picture.<init>(OOMTest.java:31)
	at com.atguigu.java.OOMTest.main(OOMTest.java:21)
3. Younger and Older Generations
- Java objects stored in the jvm can be divided into two categories:
- One is an instantaneous object with a short declaration period, and the creation and extinction of such objects are rapid
- Another type of object has a very long declaration cycle and can be consistent with the JVM's life cycle in some extreme cases.
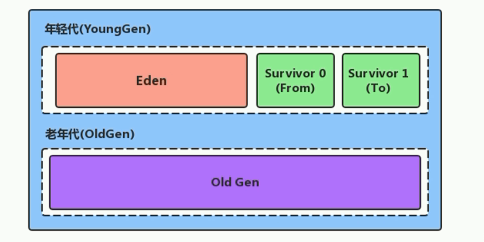
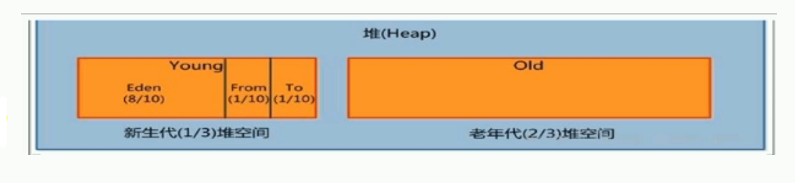
- Java heaps can be further subdivided into YoungGen and OldGen
- The younger generations can also be divided into Eden space, Survivor0 space and Survivor1 space (sometimes called from area, to area).
The following parameters are generally not tuned in development:
- Configure the proportion of heap structure between the new generation and the older generation.
- Default -XX:NewRatio=2, which means that the new generation accounts for 1, the old generation for 2, and the new generation for 1/3 of the entire heap
- You can modify -XX:NewRatio=4 to indicate that the new generation accounts for 1, the old for 4, and the new generation for 1/5 of the entire heap.
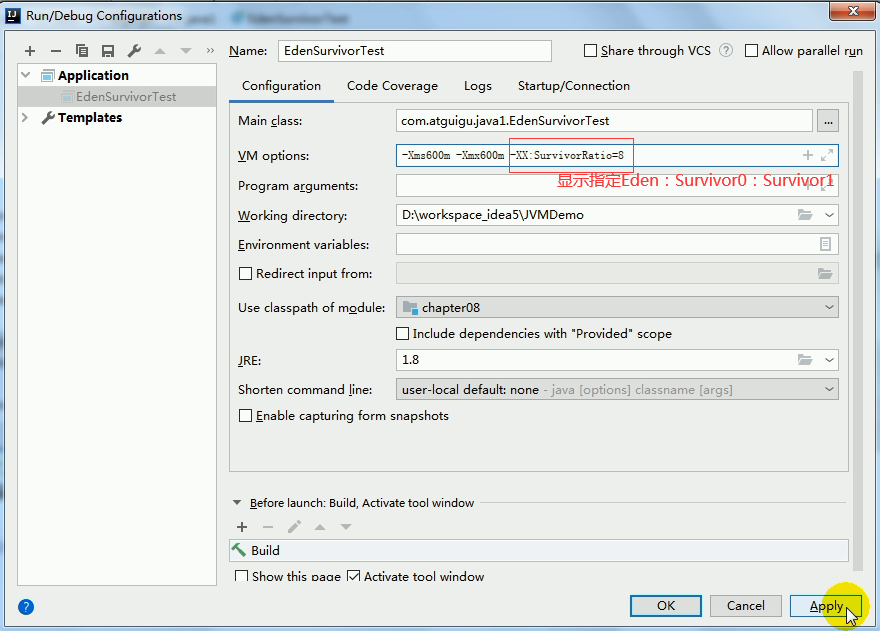
Example: Set the ratio of the new generation to the old generation, the ratio of Eden area to Survivor0 and Survivor1 area in the new generation
package com.atguigu.java1;

/**
 * -Xms600m -Xmx600m
 * <p>
 * -XX:NewRatio :  Set the ratio of the new generation to the older generation. The default value is 2.
 * <p>
 * -XX:SurvivorRatio : Set the ratio of Eden zone to Survivor zone in the new generation to 8:1:1. The default value is 8
 * -XX:-UseAdaptiveSizePolicy : Turn off adaptive memory allocation policy (temporarily not needed)
 * <p>
 * -Xmn:Set the size of the space for the new generation. (Normally not set)
 *
 * @author shkstart  shkstart@126.com
 * @create 2020  17:23
 */
public class EdenSurvivorTest {
    public static void main(String[] args) {
        System.out.println("I just want to make a soy sauce~");
        try {
            Thread.sleep(1000000);
        } catch (InterruptedException e) {
            e.printStackTrace();
        }
    }
}
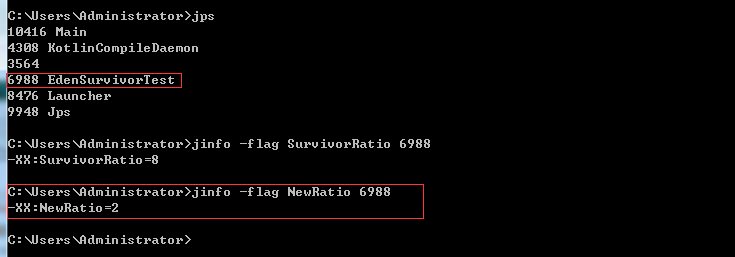
Look at the ratio of the new generation to the old:
Mode 1:
Mode 2:
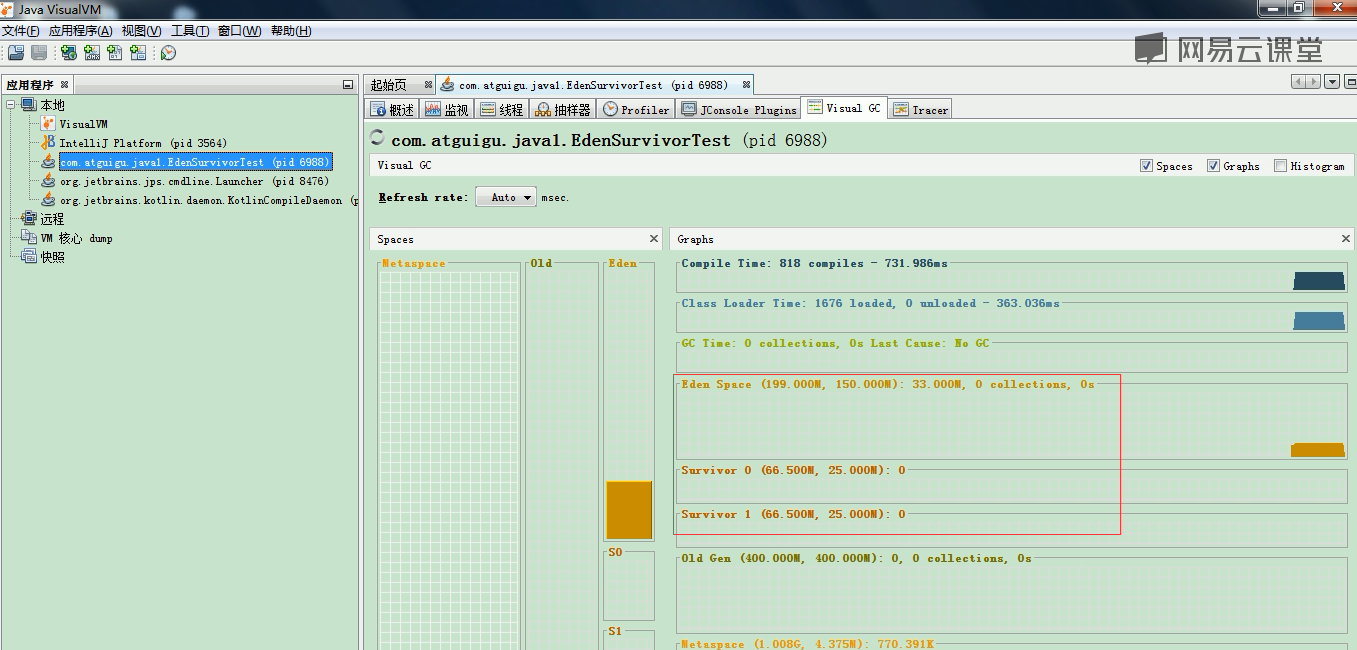
Eden and survivor 0, survivor 1 proportions:
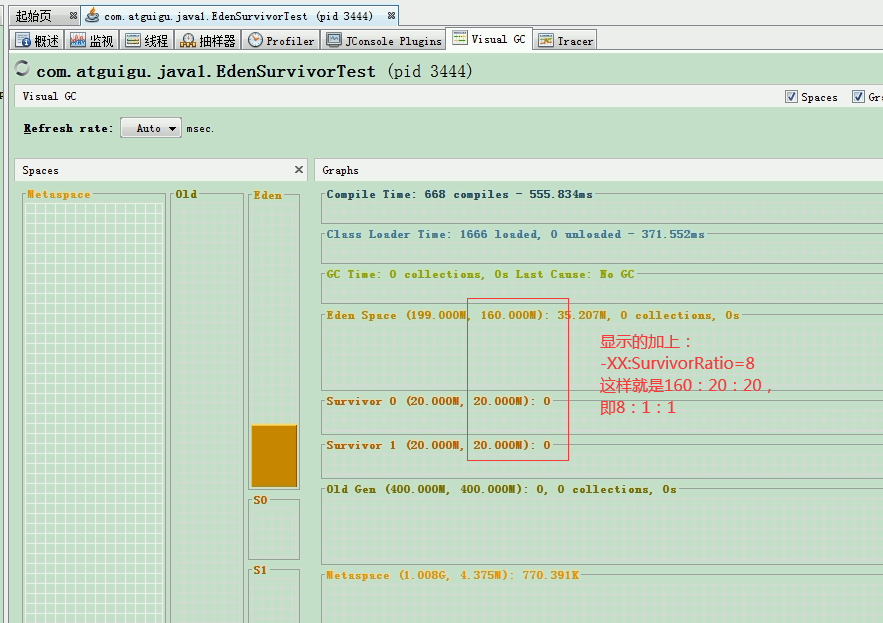
- In HotSpot, the default proportion of Eden space and the other two Survivor spaces is 8:1:1
- Developers can adjust this spatial scale with the option'-XX:SurvivorRatio'. For example, -XX:SurvivorRatio=8
- Almost all Java objects are new in the Eden area
- Most Java objects have been destroyed in the new generation.
- According to a special study by IBM, 80% of the people in the new generation are "dying from birth".
- You can use the option'-Xmn'to set the maximum memory size for the new generation
- This parameter is usually the default value.
Note: Display that specifying the maximum memory size for the new generation using -Xmn is based on this setting. For example, setting the heap space memory bit 600M in the example above, the new generation space is 200M if the ratio of the new generation to the old is 1:2 by default, but with -Xmn100m, the new generation space is 100m. -(This value is not generally set)
In the example above, the ratio of Eden:survivor 0 to survivor 1 is 8:1:1 by default, but what we see with the jvisualvm tool is 150:25:25, which is actually 6:1:1. Why? There is an adaptive mechanism to turn off the adaptive with this command: -XX:-UseAdaptiveSizePolicy (after turning off the adaptive or 6:1:1)Or add -XX:ServivorRatio=8 to display so you can see 8:1:1.
Object instances of the new and old age interact:
4. Illustrate the process of object assignment
4.1 Overview
Object assignment process:
Allocating memory for new objects is a very rigorous and complex task. Designers of JVM s need to consider not only how and where to allocate memory, but also whether memory fragmentation will occur in the memory space after the GC has finished collecting memory, since memory allocation algorithms are closely related to memory recycling algorithms.
- new's object goes to Eden Park first. There are limits on size in this area.
- When the space in the Garden of Eden is filled, the program needs to create objects. The JVM's garbage collector will recycle (Minor GC) the Garden of Eden and destroy objects in the Garden that are no longer referenced by other objects. It will also load new objects and place them in the Garden of Eden.
- Then move the rest of the objects in Eden to Survivor 0
- If the garbage collection is triggered again, the last survivors who survived at this time are placed in Survivor 0. If no recycling is done, they are placed in Survivor 1.
- If you re-manage the garbage collection, it will be replaced in Survivor 0 and then in Survivor 1.
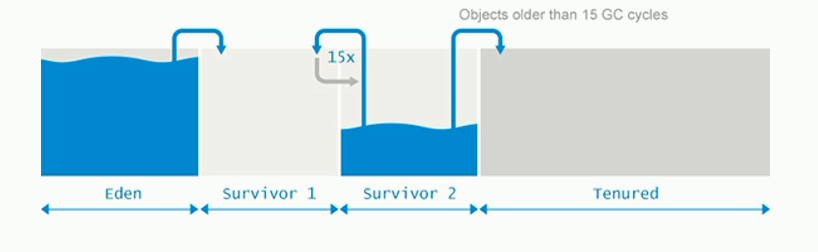
- When can I go to the nursing home? You can set the number of times. The default is 15 times. (You can set parameters: -XX: MaxTenuringThreshold=<N>to set)
- Relatively leisurely in the pension area. When there is insufficient memory in the pension area, trigger GC:Major GC again to clean up the memory in the pension area.
- OOM exceptions occur when a Major GC is executed in a pension area and it is found that the object cannot be saved.

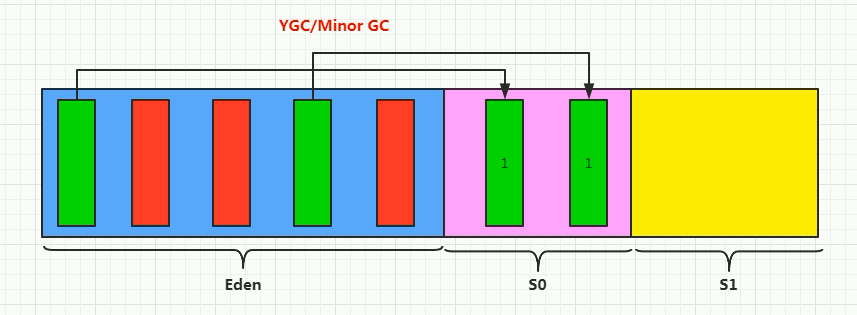
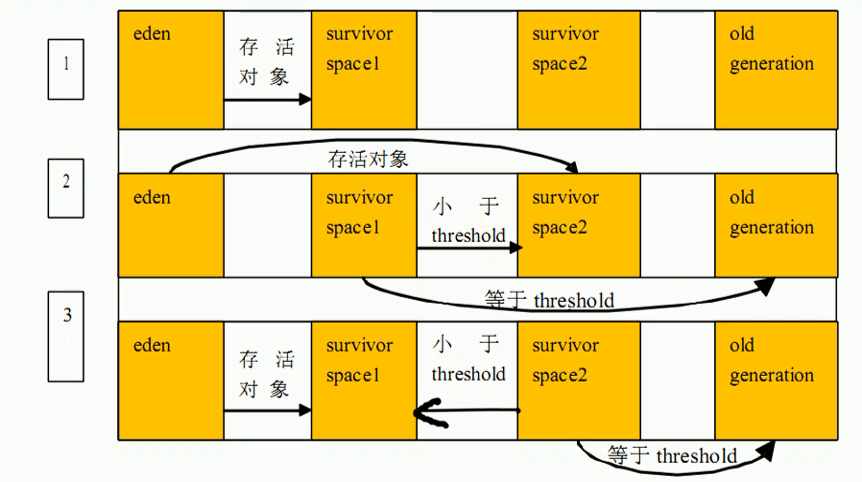
new objects are all placed in the Eden area at first. Due to the limited space in the Eden area, when the Eden area is full, a GC will occur, that is, YGC (youngGC) or Minor GC, which will recycle garbage objects (red), not garbage objects (green).In the Survivor0 area, each object has an age counter, that is, the object age counter from the Eden area to the Survivor0 area will be increased by 1; the data in the Eden area will be completely emptied; at this time, the Survivor0 area is the from area, the Survivor1 area is the to area, before which Survivor0 is the to area (to area is where the object in the Eden area will be placed next GC)Survivor1 is from.
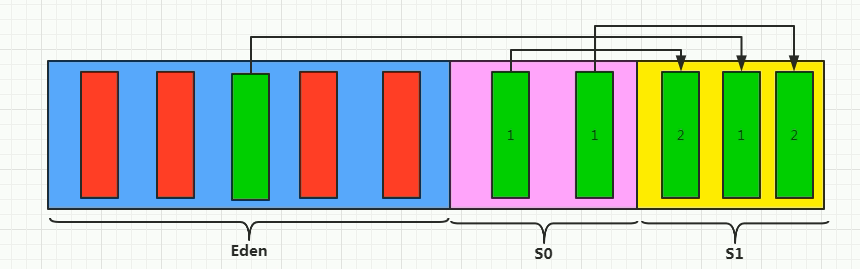
Then continue to store the new object in the Eden area until the Eden area is full again and start YGC/Minor GC again, placing the surviving object in the Eden area in the Survivor1 area (that is, the one empty in the Survivor areas of the two survivors)The age counter adds 1 to determine whether the objects in the Survivor0 area survive. If they survive, they are also placed in the Survivor1 area. The age counter adds 1 to become 2. At this time, the Survivor1 area becomes from area and the Survivor0 area becomes to area.
Note: There is no division between the two areas of Survivor, one is always empty.
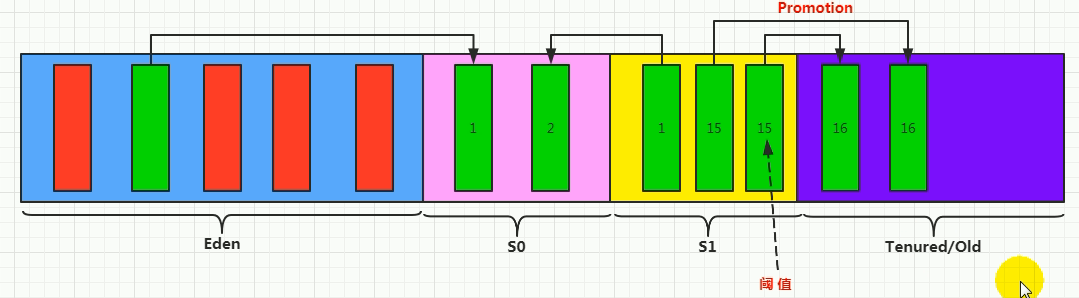
In this cycle: Eden area new object, full of rich GC, then stored in Survivor0/1 area, when Eden area is full, YGC/Minor GC occurs (assuming the to area is Survivor0 area at this time), then one object in Survivor1 area is still in use, then put into Survivor0 area, the remaining two objects are in special condition, the age counter reaches 15, so the two objects should be promoted(Promotion), stored in older generations.
Note: YGC/Minor GC triggers when the Eden zone is full and Survivor zone is not. Triggering YGC/Minor GC when the Eden zone is full also reclaims Survivor zone.
Summary:
- Summary for Survivors s0, s1: After replication there is an exchange, who is empty and who is to.
- About garbage collection: Frequent collection in new areas, rarely in pension areas, and almost no longer in permanent/meta-space.
4.2 Special cases
4.3 Code Example and Assignment Process of JvisualVM Demonstration Objects
package com.atguigu.java1;
import java.util.ArrayList;
import java.util.Random;
/**
* -Xms600m -Xmx600m
* @author shkstart shkstart@126.com
* @create 2020 17:51
*/
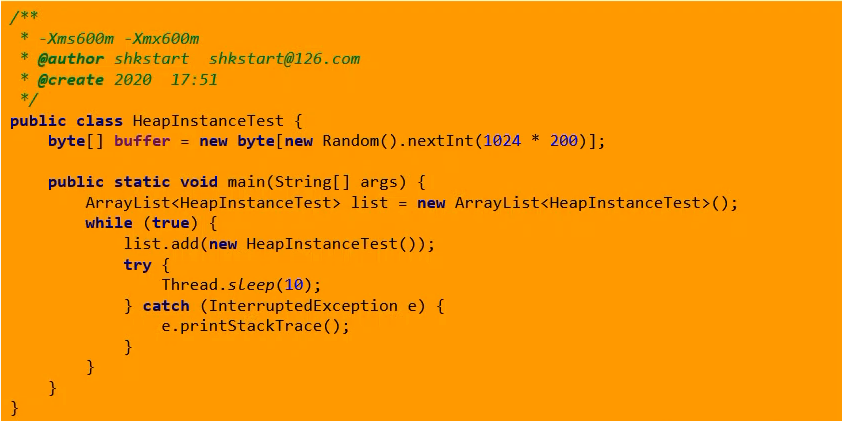
public class HeapInstanceTest {
byte[] buffer = new byte[new Random().nextInt(1024 * 200)];
public static void main(String[] args) {
ArrayList<HeapInstanceTest> list = new ArrayList<HeapInstanceTest>();
while (true) {
list.add(new HeapInstanceTest());
try {
Thread.sleep(10);
} catch (InterruptedException e) {
e.printStackTrace();
}
}
}
}
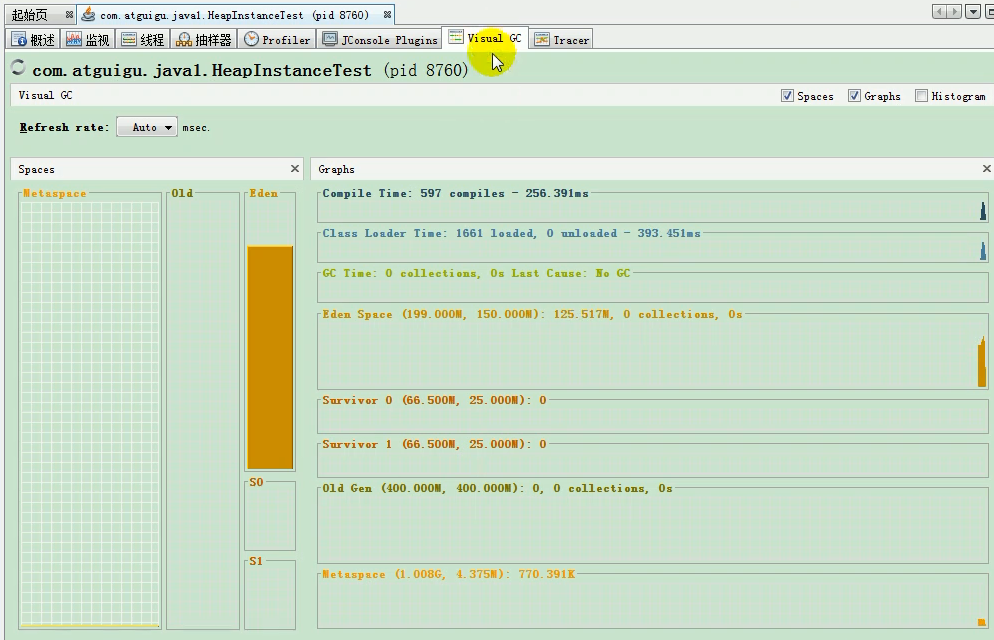
JvisualVM View:
4.4 Common Tuning Tools
- JDK Command Line
- Eclipse:Memory Analyzer Tool
- Jconsole
- VisualVM
- Jprofiler
- Java Flight Recorder
- GCViewer
- GC Easy
4.5 Minor GC, Major GC and Full GC
When a JVM performs GC, not all three memory (new generation, old generation; method area) regions above are recycled together, most of the time they are recycled referring to the new generation.
For the implementation of HotSpot VM, there are two types of GC in HotSpot VM: Partial GC and Full GC.
- Partial collection: Not a complete collection of the entire Java heap. It is divided into:
- New Generation Collection (Minor GC / Young GC): Just New Generation (EdenS0, S1) garbage collection
- Older generation collection (Major GC / Old GC): Only older generation garbage collection.
- Currently, only CMS GC will collect the behavior of older generations separately.
- Note that Major GC is often confused with Full GC and needs to be specifically distinguished between older generation or heap recycling.
- Mixed collection (Mixed GC): Garbage collection for the entire new and some older generations.
- Currently, only G1 GC does this
- Full GC: Garbage collection for the entire Java heap and method area.
Trigger Conditions for 4.5.1 Generated GC Policy
The simplest trigger condition for a generational GC strategy:
- The trigger mechanism of young generation GC (Minor GC):
- Minor GC triggers when there is not enough space in the younger generation, where Youth Full refers to Eden Full and Survivor Full does not trigger GC. (Each Minor GC cleans up the memory of the younger generation)
- Because most Java objects are mortal, Minor GC is frequent and generally recycles faster. This definition is clear and easy to understand.
- Minor GC causes STW, suspends other users'threads, and waits for garbage collection to end before user threads resume running.
- The trigger mechanism of older generation GC (Major GC / Full GC):
- "Major GC" or "Full GC" occurs when the object disappears from the older generation.
- Major GC appears, often accompanied by at least one Minor GC (but not absolutely, there is a direct Major GC policy selection process within the collection strategy of the Parallel Scavenge collector).
- In other words, when there is not enough space in the older generation, the Minor GC will be triggered first. If there is not enough space later, the Major GC will be triggered.
- Major GC is generally 10 times slower than Minor GC and STW takes longer.
- If there is not enough memory after Major GC, report OOM.
- Major GC is generally 10 times slower than Minor GC.
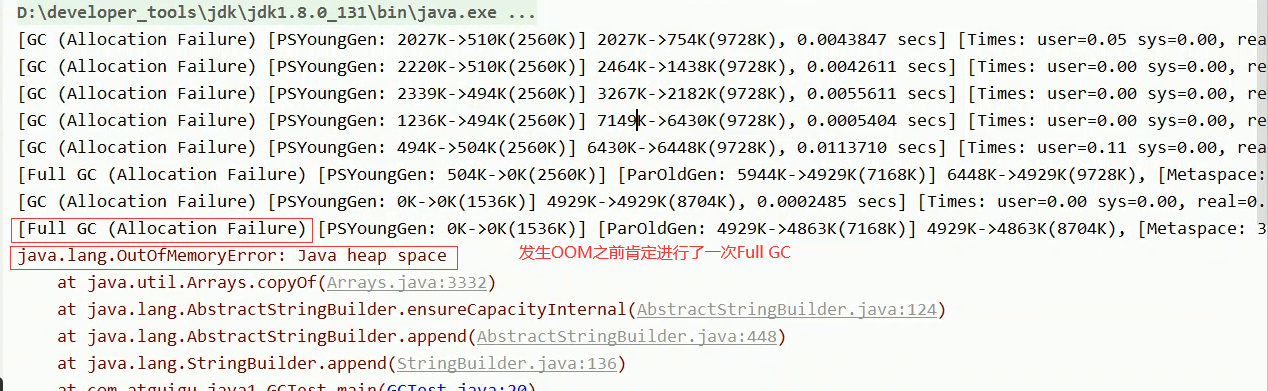
- Full GC trigger condition: (detailed later)
- There are five situations that trigger Full GC execution:
- When System.gc() is called, Full GC is recommended but not necessarily executed
- Insufficient space in older generations
- Insufficient method area space
- The average size of older generations after Minor GC is larger than the available memory of older generations
- When the Eden area, the survivor space 0 (From Space) area are copied to the survivor space 1 (To Space) area and the object size is larger than the To Space available memory, the object is transferred to the older generation, and the available memory of the older generation is smaller than the object size
- There are five situations that trigger Full GC execution:
Note: Full GC is avoided as much as possible in development or tuning. This pause time will be interrupted.
Example:
package com.atguigu.java1;

import java.util.ArrayList;
import java.util.List;

/**
 * Testing MinorGC, MajorGC, FullGC
 * -Xms9m -Xmx9m -XX:+PrintGCDetails
 * @author shkstart  shkstart@126.com
 * @create 2020  14:19
 */
public class GCTest {
    public static void main(String[] args) {
        int i = 0;
        try {
            List<String> list = new ArrayList<>();
            String a = "atguigu.com";
            while (true) {
                list.add(a);
                a = a + a;
                i++;
            }

        } catch (Throwable t) {
            t.printStackTrace();
            System.out.println("The number of traversals is:" + i);
        }
    }
}
4.6 Heap Space Generation Thought
Why does the Java heap need to be generated? Does it not work without generations?
- The life cycle of different objects is different. 70%-99% of objects are temporary objects.
- New Generation: There is Eden, two Survivor s of the same size (also known as from/to, s0/s1), and to is always empty.
- Older generations: Store objects that survive multiple GC cycles in the new generation.
- Actually, no generation is all right. The only reason for generation is to optimize GC performance. Without generation, all objects are together, just like people in a school are locked in a classroom. When GC is running, it finds out which objects are useless, so it scans all areas of the heap. Many objects are dying and dying. If it is not, set up a new dialogue.If you put it somewhere, when the GC is in place, recycle the area that stores the objects that "die every day" first, which will make up a lot of space.
4.7 Memory Allocation Policy
If the object is still alive after Eden's birth and after the first Minor GC and can be accommodated by Survivor, it will be moved into the Survivor space and set the object's age to 1. Every Minor GC that the object has survived in the Survivor area will increase its age by one year when it reaches a certain level (default is 15, each JVM, each GC is different).When you do, you will be promoted to the older generation.
The age threshold for an object to promote older generations can be set by choosing -XX:MaxTenuringThreshold
The principles for assigning objects to different age groups are as follows:
- Priority assigned to Eden
- Large objects are directly allocated to older generations
- Try to avoid too many large objects in your program
- Distribution of long-term survivors to older generations
- Dynamic Object Age Judgment
- If the sum of all objects of the same age in the Survivor area is greater than half the size of the Survivor space, those older than or equal to that age can go directly into the older age group without waiting for the age required in the MacTenuring Threshold.
- Space Allocation Guarantee
- -XX:HandlePromotionFailure
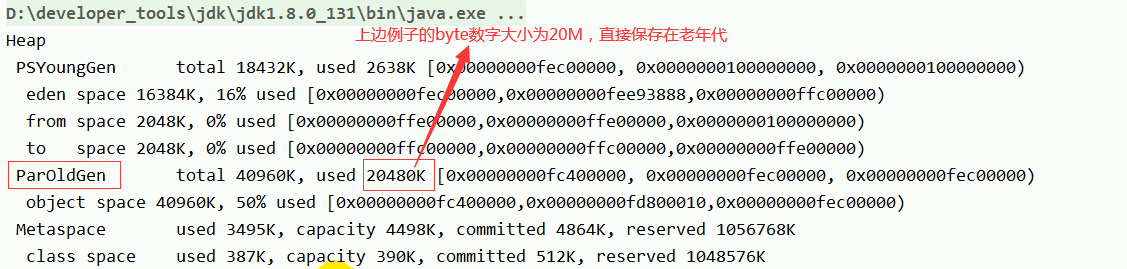
Example: Large objects are directly allocated to older generations
package com.atguigu.java1;

/** Test: Big people go directly into the older generation
 * -Xms60m -Xmx60m -XX:NewRatio=2 -XX:SurvivorRatio=8 -XX:+PrintGCDetails
 * @author shkstart  shkstart@126.com
 * @create 2020  21:48
 */
public class YoungOldAreaTest {
    public static void main(String[] args) {
        byte[] buffer = new byte[1024 * 1024 * 20];//20m

    }
}
4.8 Allocate memory for objects
Why is there TLAB (Thread Local Allocation Buffer)?
- A heap is a thread-shared area where any thread can access shared data
- Since object instances are created frequently in the JVM, it is thread insecure to partition memory space from the heap in a concurrent environment
- To avoid multiple threads operating on the same address, mechanisms such as locking are needed to affect the allocation speed.
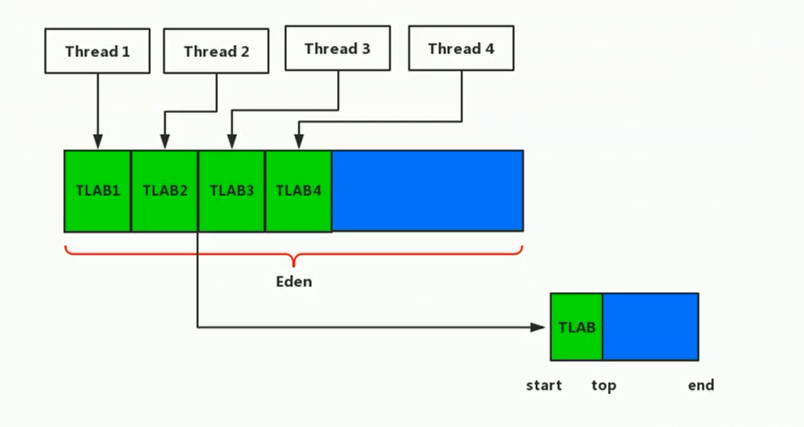
What is TLAB?
- From a memory model rather than garbage collection perspective, the heap Eden region continues to be partitioned, and the JVM allocates a private cache region for each thread that is contained within the Eden space.
- When multiple threads allocate memory simultaneously, TLAB avoids a series of non-threaded security issues and improves memory allocation throughput, so we can call this a fast allocation strategy.
- All OpenJDK-derived JVM s I know provide TLAB design.
Description of TLAB:
- Although not all object instances can successfully allocate memory in TLAB, JVM does prefer TLAB for memory allocation.
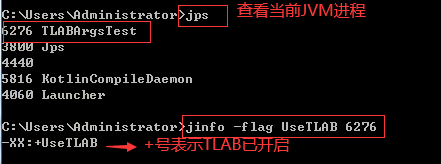
- In the program, developers can set whether to open TLAB space by choosing the option'-XX:UseTLAB'.
- By default, TLAB space is very small, occupying only 1% of the total Eden space. Of course, we can set the percentage of Eden space occupied by TLAB space with the option'-XX:TLABWasteTargetPercent'.
- Once an object fails to allocate memory in TLAB space, the JVM attempts to allocate memory directly in Eden space by ensuring the atomicity of data operations using a locking mechanism.
Example:
package com.atguigu.java1;

/**
 * Test whether the -XX:UseTLAB parameter is turned on: the default is turned on
 *
 * @author shkstart  shkstart@126.com
 * @create 2020  16:16
 */
public class TLABArgsTest {
    public static void main(String[] args) {
        System.out.println("I just want to make a soy sauce~");
        try {
            Thread.sleep(1000000);
        } catch (InterruptedException e) {
            e.printStackTrace();
        }
    }
}
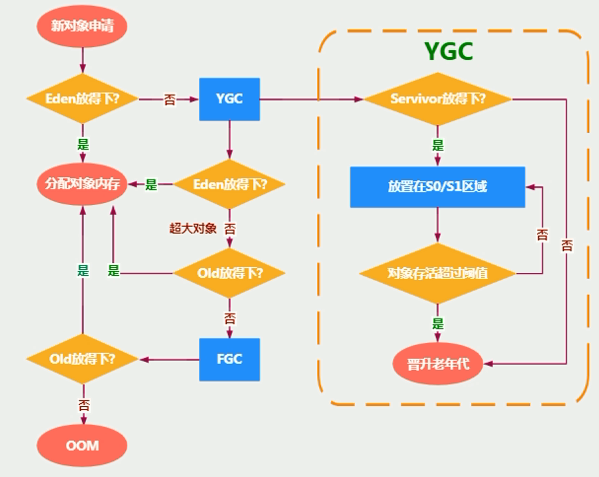
Object Assignment Flowchart:
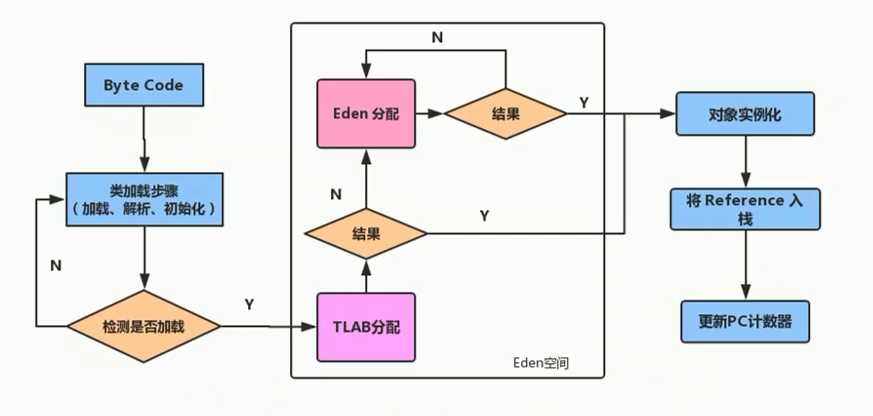
Byte codes are loaded (load, link, initialize), new keyword creation objects allocate space in the TLAB area first, instantiate if allocation is successful, and allocate space in the Eden area (non-TLAB area) if allocation fails (follow the normal process).
Parameter Settings for 4.9 Node Heap Space
Official description:https://docs.oracle.com/javase/8/docs/technotes/tools/unix/java.html
- -XX:+PrintFlagsInitial: View default initial values for all parameters
- -XX:+PrintFlagsFinal: View the final values of all parameters (there may be modifications, not initial values anymore)
- -Xms: Initial heap space memory (defaults to 1/64 of physical memory)
- -Xmx: Maximum heap space memory (defaults to 1/4 of physical memory)
- -Xmn: Set the size of the new generation. (Initial and maximum)
- -XX:NewRatio: Configure the proportion of heap structure between the new and the old generations
- -XX:SurvivorRatio: Set the proportion of Eden and S 0/S1 space in the new generation
- -XX:MaxTenuringThreshold: Set the maximum age for new generation garbage
- -XX:+PrintGCDetails: Output detailed GC processing log
- Print GC brief information: -XX:+PrintGC >-verbose:gc
- -XX:HandlePromotionFailure: Is space allocation guaranteed
Example:
package com.atguigu.java1;

/**
 * Common jvm parameters for testing heap space:
 * -XX:+PrintFlagsInitial : View default initial values for all parameters
 * -XX:+PrintFlagsFinal  : View the final values of all parameters (there may be modifications, no longer initial values)
 *      -XX:+PrintFlagsFinal -XX:SurvivorRatio=5
 *      Instructions to view a parameter specifically: jps: View currently running processes
 *                             jinfo -flag SurvivorRatio Process id
 *
 * -Xms: Initial heap space memory (defaults to 1/64 of physical memory)
 * -Xmx: Maximum heap space memory (default is 1/4 of physical memory)
 * -Xmn: Set the size of the new generation. (Initial and maximum)
 * -XX:NewRatio: Configure the proportion of heap structure between the new generation and the older generation
 * -XX:SurvivorRatio: Setting the proportion of Eden and S 0/S1 space in the New Generation
 * -XX:MaxTenuringThreshold: Set maximum age for new generation garbage
 * -XX:+PrintGCDetails: Output detailed GC processing log
 * Print GC brief information: 1-XX:+PrintGC2-verbose:gc
 * -XX:HandlePromotionFailure: Whether to set up space allocation guarantee
 *
 * @author shkstart  shkstart@126.com
 * @create 2020  17:18
 */
public class HeapArgsTest {
    public static void main(String[] args) {

    }
}
Before Minor GC occurs, the virtual opportunity checks to see if the maximum available contiguous space in the older generation is larger than the total space of all objects in the new generation.
- Minor GC is safe if larger than
- If less than, the virtual opportunity checks to see if the -XX:HandlePromotionFailure setting allows guarantee failures.
- If HandlePromotionFailure=true, it continues to check whether the maximum available contiguous space in older generations is larger than the average size of objects that have been promoted to older generations.
- If larger, try a Minor GC, but this Minor GC is still risky;
- If less than, perform a Full GC instead.
- If HandlePromotionFailure=false, do a Full GC instead.
- If HandlePromotionFailure=true, it continues to check whether the maximum available contiguous space in older generations is larger than the average size of objects that have been promoted to older generations.
After JDK6 Update24 (JDK7)The HandlePromotionFailure parameter no longer affects the virtual machine's space allocation guarantee policy, and observes source changes in OpenJDK. Although the HandlePromotionFailure parameter is also defined in the source code, it is no longer used in the code. JDK6The rule after Update24 changes to Minor GC as long as the continuous space of the older generation is larger than the total size of the new generation objects or the average size of successive promotions, or Full GC will occur.
Is the 4.10 heap the only option for allocating object storage?
There is a description about Java heap memory in Deep Understanding Java Virtual Machines:
With the development of JIT compilers and the maturity of escape analysis techniques, on-stack allocation and scalar substitution optimization techniques will lead to some subtle changes, and all objects allocated to the heap will gradually become less absolute.
It is common knowledge that objects allocate memory in the Java heap in a Java virtual machine, but there is a special case where an Escape Analysis occurs.Then it is discovered that if an object does not escape the method, it may be optimized for stack allocation. This eliminates the need for memory allocation on the stack and garbage collection. This is also the most common out-of-heap storage technology.
In addition, TaoBaoVM based on OpenJDK deep customization mentioned above, in which innovative GCIH (GC invisible heap) technology implements off-heap, moving Java objects with a longer life cycle from heap to heap, and GC cannot manage Java objects inside GCIH, in order to reduce GC recycling frequency and improve GC recycling efficiency.
4.10.1 Escape Analysis
- How to assign objects on the stack to the stack requires the use of escape analysis.
- This is a cross-function global data flow analysis algorithm that can effectively reduce synchronous load and memory heap allocation pressure in Java programs
- By escaping analysis, the Java HotSpot compiler can analyze the scope of use of a reference to a new object to determine whether to allocate it to the heap or not.
- The basic behavior of escape analysis is to analyze the dynamic scope of an object:
- When an object is defined in a method and the object is used only within the method, no escape is considered to have occurred.
- When an object is defined in a method and it is referenced by an external method, an escape is considered. For example, it is passed to another method as a call parameter.
Example:
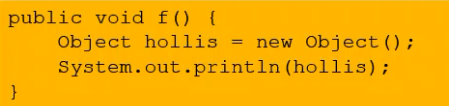
public void my_method() {
    V v = new V();
    ...
    v = null;
}
If no escape object occurs, it can be assigned to the stack, and the stack space is removed as the method execution ends.
Example:
public static StringBuffer createStringBuffer(String s1, String s2) {
    StringBuffer sb = new StringBuffer();
    sb.append(s1);
    sb.append(s2);
    return sb;
}
The StringBuffer object created in the above method escapes because it is returned to the calling method. If you want the sb object not to escape, you can change it to the following:
public static String createStringBuffer(String s1, String s2) {
    StringBuffer sb = new StringBuffer();
    sb.append(s1);
    sb.append(s2);
    return sb.toString();
}
There are several cases of escape analysis:
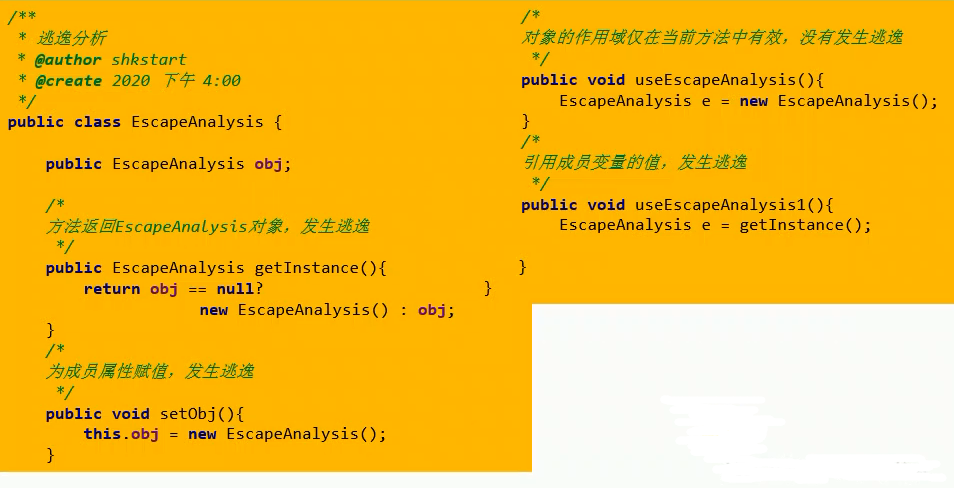
package com.atguigu.java2;

/**
 * escape analysis
 *
 *  How quickly you can tell if escape analysis has occurred depends on whether the new object entity is likely to be called outside of the method.
 * @author shkstart
 * @create 2020 4:00 p.m.
 */
public class EscapeAnalysis {

    public EscapeAnalysis obj;

    /*
    Method returns an EscapeAnalysis object, escaping
     */
    public EscapeAnalysis getInstance(){
        return obj == null? new EscapeAnalysis() : obj;
    }
    /*
    Assign values to member attributes, escape occurs
     */
    public void setObj(){
        this.obj = new EscapeAnalysis();
    }
    //Think: If the current obj reference is declared static? Escape will still occur.

    /*
    The scope of the object is valid only in the current method and no escape occurs
     */
    public void useEscapeAnalysis(){
        EscapeAnalysis e = new EscapeAnalysis();
    }
    /*
    Escape occurs by referencing the value of a member variable
     */
    public void useEscapeAnalysis1(){
        EscapeAnalysis e = getInstance();
        //getInstance().xxx() will also escape
    }
}
Parameter settings:
- Escape analysis has been turned on by default in HotSpot since the JDK 6u23 release.
- If you are using an earlier version, developers can do this by:
- Option: -XX:+DoEscapeanalysis Displays Open Escape Analysis
- View the screening results for escape analysis by choosing: -XX:+PringEscapeAnalysis
Conclusion: If local variables can be used in development, do not use out-of-method definitions.
4.10.2 Code optimization
With escape analysis, the compiler can optimize heap code as follows:
- Stack allocation. Converts a stack allocation to a stack allocation. If an object is allocated in a subprogram, the pointer to that object will never escape. The object may be a candidate for a stack allocation, not a heap allocation.
- Synchronization omission. If an object is found to be accessible only from one thread, then operations on that object may not consider synchronization.
- Separate objects or scalar substitutions. Some objects may not exist as a continuous memory structure or can be accessed, so some (or all) of the objects may be stored in CPU registers instead of in memory.
Allocation on stack of code optimization
- Based on the results of escape analysis during compilation, the JIT compiler finds that if an object does not escape a method, it may be optimized for stack allocation. After allocation is complete, execution continues in the call stack, and at the end of the thread, stack space is reclaimed, and local variable objects are also reclaimed. There is no need for garbage collection.
- Common scenarios allocated on the stack
- Escape occurs when member variables are assigned, method return values are passed, and instance references are passed.
Example: -XX:-DoEscapeAnalysis, minus sign means no escape analysis is enabled
package com.atguigu.java2;
/**
* Assign Tests on Stack
* <p>
* Test 1
* Unopened escape analysis: -Xmx1G -Xms1G -XX:-DoEscapeAnalysis -XX:+PrintGCDetails
* Turn on escape analysis: -Xmx1G -Xms1G-XX:+DoEscapeAnalysis-XX:+PrintGCDetails
* <p>
* No gc logs are generated, but when escape analysis is turned on, execution is faster
* <p>
* Test 2
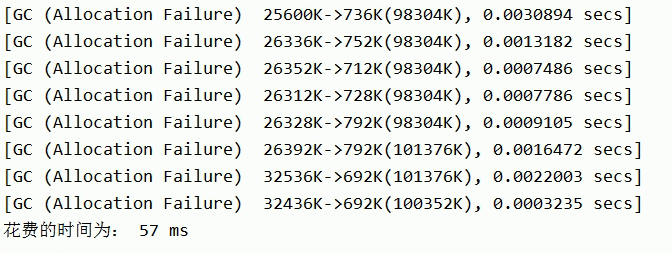
* Unopened escape analysis: -Xmx256m -Xms256m -XX:-DoEscapeAnalysis -XX:+PrintGCDetails
* Generated gc log
* <p>
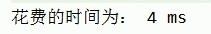
* Turn on escape analysis: -Xmx256m-Xms256m-XX:+DoEscapeAnalysis-XX:+PrintGCDetails
* No gc log generated
*
* @author shkstart shkstart@126.com
* @create 2020 10:31
*/
public class StackAllocation {
public static void main(String[] args) {
long start = System.currentTimeMillis();
for (int i = 0; i < 10000000; i++) {
alloc();
}
// View execution time
long end = System.currentTimeMillis();
System.out.println("The time spent is: " + (end - start) + " ms");
// To facilitate viewing the number of objects in heap memory, thread sleep
try {
Thread.sleep(1000000);
} catch (InterruptedException e1) {
e1.printStackTrace();
}
}
private static void alloc() {
User user = new User();//No escape occurred
}
static class User {
}
}
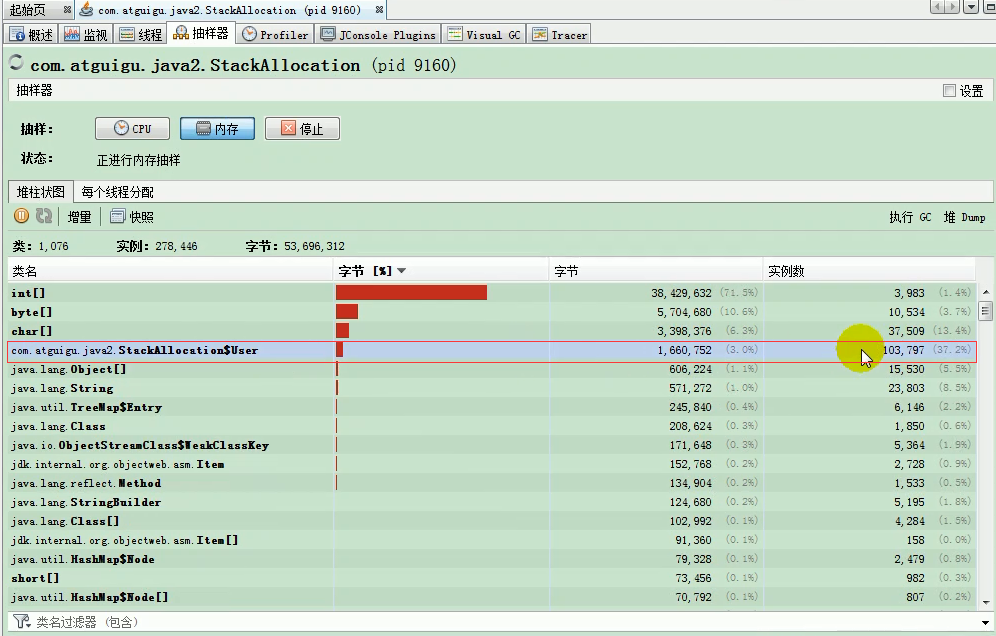
Viewing with Java Visual VM
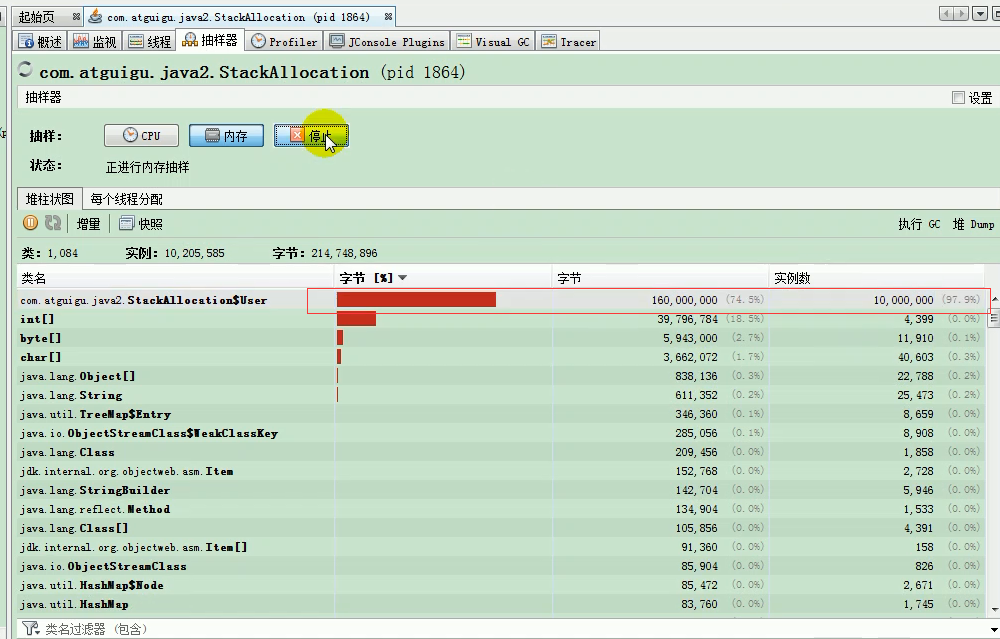
-XX:+DoEscapeAnalysis,+means turn on escape analysis, turn on escape analysis and look at memory allocation:
Synchronization omission for code optimization (elimination)
- Thread synchronization is expensive, and the consequence of synchronization is reduced concurrency and performance.
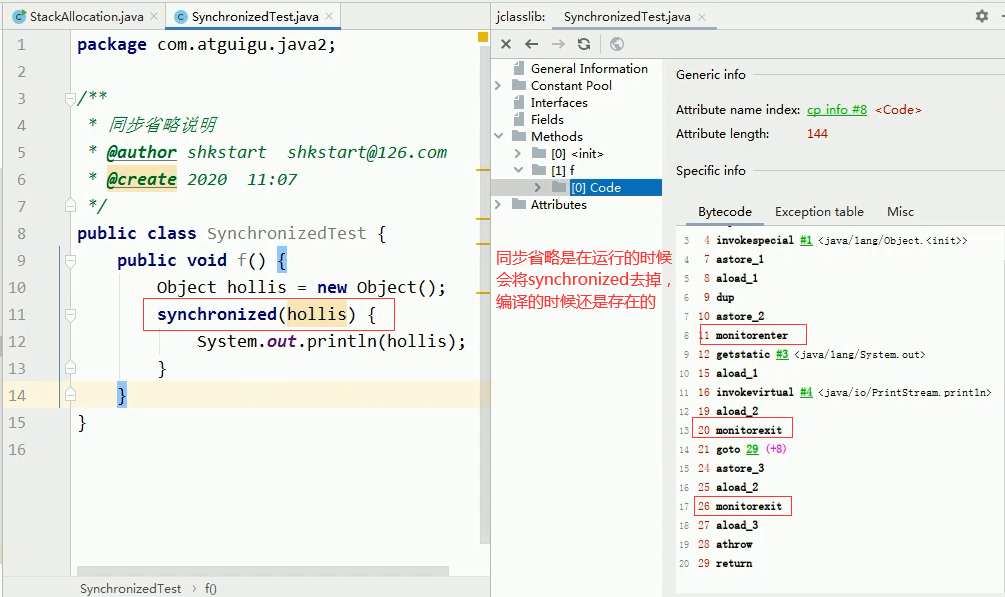
- When compiling a synchronization block dynamically, the JIT compiler can use escape analysis to determine if the lock object used by the synchronization block can only be accessed by one thread and not published to other threads. If not, the JIT compiler will unsynchronize this part of the code when compiling this synchronization block. This cancellation can greatly improve concurrency and performance.The process of synchronization is called synchronization omission, which eliminates the lock.
Example:
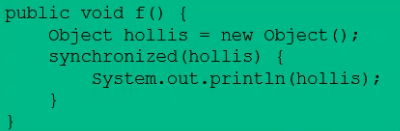
The hollis object is locked in code, but the hollis object's life cycle is only in the f() method and is not accessed by other threads, so it is optimized during the JIT compilation phase. Optimize as follows:
Example:
package com.atguigu.java2;

/**
 * Synchronization Omission Description
 * @author shkstart  shkstart@126.com
 * @create 2020  11:07
 */
public class SynchronizedTest {
    public void f() {
        Object hollis = new Object();
        synchronized(hollis) {
            System.out.println(hollis);
        }
    }
}
Scalar substitution for code optimization
Scalar is data that can no longer be broken down into smaller pieces. The original data type in Java is scalar.
In contrast, those data that can also be decomposed are called Aggregate s, and objects in Java are aggregates because they can be decomposed into other aggregates and scalars.
In the JIT stage, if an object is found not to be accessed by the outside world through escape analysis, it will be split into several member variables to replace it after JIT optimization. This process is scalar replacement.
Example:
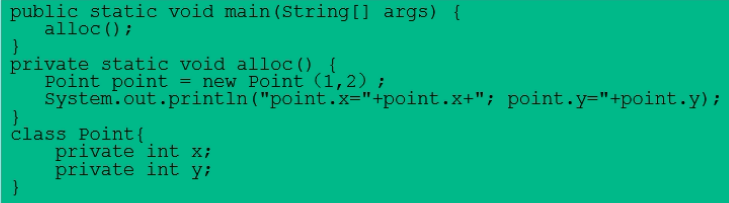
With the above code, when the result scalar is replaced, it becomes:
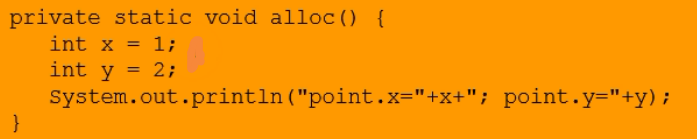
You can see that after escape analysis, Point is replaced with two scalars. What's the advantage of scalar replacement? It can reduce the heap memory consumption significantly. Because once you don't need to create objects, you don't need to allocate heap memory.
Scalar substitution provides a good basis for allocation on the stack.
Scalar replacement parameter settings:
Parameter -XX:+EliminateAllocations: Scalar substitution is turned on (by default), allowing for scattered objects to be allocated on the stack.
Example:
package com.atguigu.java2;

/**
 * Scalar Replacement Test
 * Scalar replacement not turned on: -Xmx100m -Xms100m -XX:+DoEscapeAnalysis-XX:+PrintGC-XX:-EliminateAllocations
 * <p>
 * Turn on scalar replacement: -Xmx100m - Xms100m -XX:+DoEscapeAnalysis-XX:+PrintGC-XX:+EliminateAllocations
 * Conclusion: Switching on scalar replacement takes less time and does not produce gc
 *
 * @author shkstart  shkstart@126.com
 * @create 2020  12:01
 */
public class ScalarReplace {
    public static class User {
        public int id;
        public String name;
    }

    public static void alloc() {
        User u = new User();//No escape occurred
        u.id = 5;
        u.name = "www.atguigu.com";
    }

    public static void main(String[] args) {
        long start = System.currentTimeMillis();
        for (int i = 0; i < 10000000; i++) {
            alloc();
        }
        long end = System.currentTimeMillis();
        System.out.println("The time spent is: " + (end - start) + " ms");
    }
}

/*
class Customer{
    String name;
    int id;
    Account acct;

}

class Account{
    double balance;
}


 */
Scalar replacement results not turned on:
Turn on scalar replacement results:
The above code makes 100 million alloc calls in the main function. Calling for object creation, since the User object instance takes up about 16 bytes of space, the cumulative allocation space reaches nearly 1.5 GB. If the heap space is smaller than this value, a GC is bound to occur. Run the above code with the following parameters:
-server -Xmx100m -Xms100m -XXL+DoEscapeAnalysis -XX:+PrintGC -XX:+EliminateAllocations
The parameters used here are as follows:
- Parameter-server: Start Server mode because in Server mode, escape analysis can be enabled.
- Parameter -XX:+DoEscapeAnalysis: Enable escape analysis
- Parameter -Xmx100m: Specifies heap space up to 100MB
- Parameter -XX:+PrintGC: GC log will be printed
- Parameter -XX:+EliminateAllocations: Scalar substitution is turned on (the default is turned on), allowing scattered objects to be allocated on the stack, such as objects having fields id and name, which are considered two separate local variables for allocation.
Summary: (Escape analysis is immature)
- The paper on escape analysis was published in 1999, but JDK 1.6 was not implemented, and this technology is not very mature today.
- The root cause is that there is no guarantee that the performance consumption of escape analysis is higher than other consumption. Although scalar substitution, stack allocation, and lock elimination can be done through escape analysis, it also requires a series of complex analysis, which is actually a relatively time-consuming process.
- An extreme example is when, after an escape analysis, no object is found to be escapable. The process of escape analysis is wasted.
- Although this technology is not very mature, it is also a very important means of instant compiler optimization technology.
- Notice that it is theoretically possible for JVM to assign objects on the stack that will not escape through escape analysis, but depending on the choice of the JVM designer. As far as I know, this is not done in Oracle HotSpot JVM, which wins in the documentation related to escape analysis, so it is clear that all object instances are created on the stack.
- Many books are still based on pre-JDK7 versions. JDK has changed a lot. Internal string caches and static variables have been allocated on the permanent generation and the permanent generation has been replaced by the metadata area. However, intern al string caches and static variables are not transferred to metadata, they are allocated directly on the heap, so this also corresponds to the previous point.The conclusion: Object instances are all allocated on the heap.
Summary of this chapter:
- The younger generation is the area where objects are born, grow and die. An object is created, applied, and finally collected and killed by the garbage collector.
- Older generations prevent long-life objects, usually Java objects that are copied from the Survivor area. Of course, there are special cases where we know that ordinary objects are assigned to TLAB, and if the objects are large, the JVM tries to allocate them directly to other locations in Eden; if the objects are too large to find enough continuous free space for the new generation, the JVM doesThey are allocated directly to older generations.
- When GC only occurs in the younger generation, the behavior of recycling objects in the younger generation is called Minor GC, and when GC occurs in the older generation, it is called Major GC or Full GC. Generally, Minor GC occurs much more frequently than Major GC, that is, garbage collection occurs much less frequently in the older generation than in the younger generation.