
When it comes to anomaly detection, the main challenge is that it is difficult to define anomalies. For example, how can we define and predict abnormal network intrusion, system defects and security fraud? If known exception data has been marked, we can choose from the various types of supervised machine learning models (see the link below for details) supported in BigQuery ML. But what can we do if we don't know that an exception will occur and there is no marked data? Unlike the typical prediction technology using supervised learning, we may need to be able to detect exceptions without labeled data at this time.
Machine learning model: https://cloud.google.com/bigquery-ml/docs/reference/standard-sql/bigqueryml-syntax-create#create_model_syntax
In early July, Google announced that it would publicly preview the new exception detection function in BigQuery ML, which uses unsupervised machine learning to help detect exceptions without marking data. Depending on whether the training data is a time series, users can now use the new ml.detect_ The anomalies function uses the following model to detect anomalies in training data or new input data:
-
Autoencoder model, under internal test;
-
K-means model, which has been opened to the outside world;
-
ARIMA_PLUS time series model has been opened to the public.
How to use ML.DETECT_ANOMALIES model for anomaly detection?
To detect anomalies in non time series data, we can use:
K-means clustering model: when the K-means model is used, anomalies are identified according to the normalized distance between each input data point and its nearest cluster. If the distance exceeds the threshold determined by the pollution value provided by the user, the data point is recognized as abnormal.
Autoencoder model: when using the autoencoder model, exceptions will be identified according to the reconstruction errors of each data point. If the error exceeds the threshold determined by the contamination value, it is recognized as an exception.
To detect anomalies in time series data, you can use:
ARIMA_PLUS time series model: using Arima_ When using the plus model, exceptions will be identified according to the confidence interval of the timestamp. If the probability that the data point in the timestamp occurs outside the prediction interval exceeds the probability threshold provided by the user, the data point is recognized as an exception.
Let's show the code examples of exception detection in BigQuery} ML in each scenario one by one.
CREATE MODEL `mydataset.my_kmeans_model`OPTIONS( MODEL_TYPE = 'kmeans', NUM_CLUSTERS = 8, KMEANS_INIT_METHOD = 'kmeans++' ) ASSELECT * EXCEPT(Time, Class)FROM `bigquery-public-data.ml_datasets.ulb_fraud_detection`;
After training the K-means clustering model, run ML.DETECT_ANOMALIES to detect anomalies in training data or new input data. Ml.detect is required_ Anomalies is the same data used during training:
SELECT *FROM ML.DETECT_ANOMALIES(MODEL `mydataset.my_kmeans_model`, STRUCT(0.02 AS contamination), TABLE `bigquery-public-data.ml_datasets.ulb_fraud_detection`);
Ml.detect is also required_ Anomalies and provide new data as input:
SELECT *FROM ML.DETECT_ANOMALIES(MODEL `mydataset.my_kmeans_model`, STRUCT(0.02 AS contamination), (SELECT * FROM `mydataset.newdata`));

How does anomaly detection of K-means clustering model work?
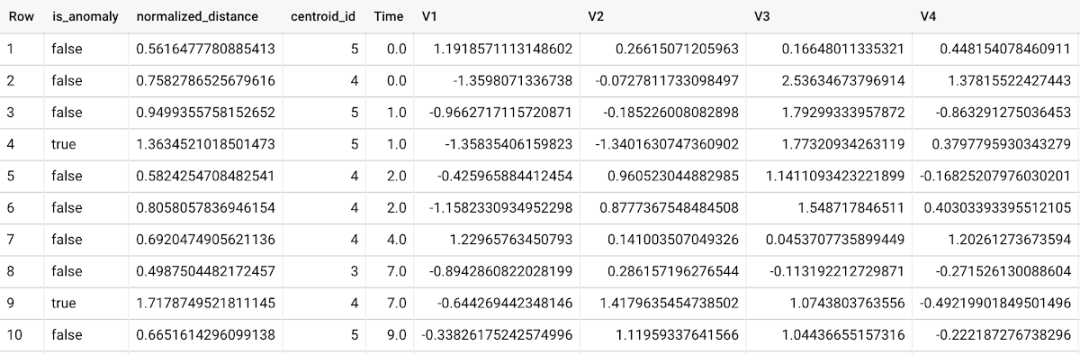
The anomaly is identified based on the value of the normalized distance from each input data point to its nearest cluster. If it exceeds the threshold determined by the pollution value, it is identified as an anomaly. With K-means model and data as input, ML.DETECT_ANOMALIES first calculates the absolute distance from each input data point to the centroid of all clusters in the model, and then through their respective cluster radius (defined as the absolute distance from all points in the cluster to the centroid). For each data point, ML.DETECT_ANOMALIES according to normalized_distance returns the nearest centroid_id, as shown in the screenshot above. The pollution value specified by the user determines the threshold whether the data point is considered abnormal. For example, a contamination value of 0.1 means that the first 10% of the normalized distance in descending order from the training data will be used as the cut-off threshold. If the normalized distance of the data point exceeds the threshold, it is recognized as an anomaly. Setting appropriate pollution will highly depend on the requirements of users or enterprises.
For more information on anomaly detection using K-means clustering, read:
https://cloud.google.com/bigquery-ml/docs/reference/standard-sql/bigqueryml-syntax-detect-anomalies#kmeans_model_example
Anomaly detection using Autoencoder model
Using the Autoencoder model, run ML.DETECT_ANOMALIES to detect anomalies in training data or new input data.
First, create an Autoencoder model:
CREATE MODEL `mydataset.my_autoencoder_model`OPTIONS( model_type='autoencoder', activation_fn='relu', batch_size=8, dropout=0.2, hidden_units=[32, 16, 4, 16, 32], learn_rate=0.001, l1_reg_activation=0.0001, max_iterations=10, optimizer='adam' ) AS SELECT * EXCEPT(Time, Class) FROM `bigquery-public-data.ml_datasets.ulb_fraud_detection`;
To detect anomalies in training data, ml.detect is required_ Anomalies is the same data used during training:
SELECT *FROM ML.DETECT_ANOMALIES(MODEL `mydataset.my_autoencoder_model`, STRUCT(0.02 AS contamination), TABLE `bigquery-public-data.ml_datasets.ulb_fraud_detection`)
To detect exceptions in new data, use ML.DETECT_ANOMALIES and provide new data as input:
SELECT *FROM ML.DETECT_ANOMALIES(MODEL `mydataset.my_autoencoder_model`, STRUCT(0.02 AS contamination), (SELECT * FROM `mydataset.newdata`));

How does anomaly detection work for the Autoencoder model?
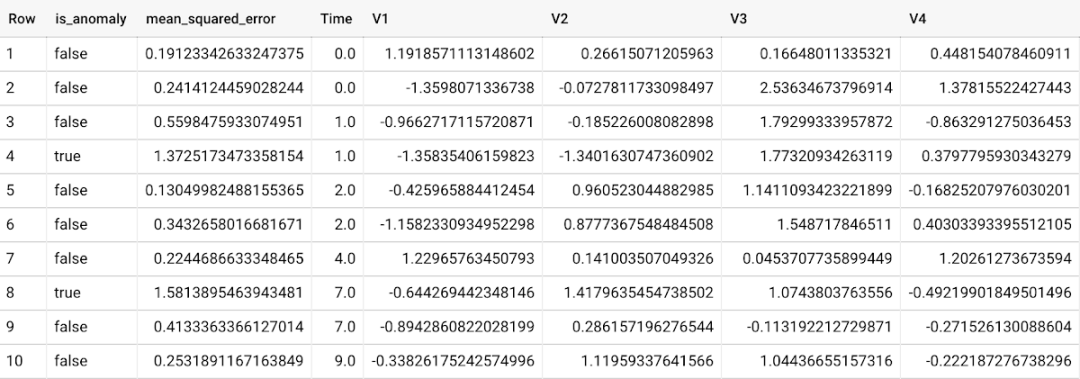
The anomaly is identified based on the reconstruction error value of each input data point. If it exceeds the threshold determined by the pollution value, it is identified as an anomaly. Using Autoencoder model and data as input, ML.DETECT_ANOMALIES first calculates the mean between the original value and the reconstructed value of each data point_ squared_ error. The pollution value specified by the user determines the threshold whether the data point is considered abnormal. For example, a pollution value of 0.1 means that the first 10% of the descending error of the training data will be used as the cut-off threshold. Setting appropriate pollution will highly depend on the requirements of users or enterprises.
For more information about using the Autoencoder model for exception detection, you can read the documentation:
https://cloud.google.com/bigquery-ml/docs/reference/standard-sql/bigqueryml-syntax-detect-anomalies#autoencoder_model_example
Using ARIMA_PLUS time series model for anomaly detection
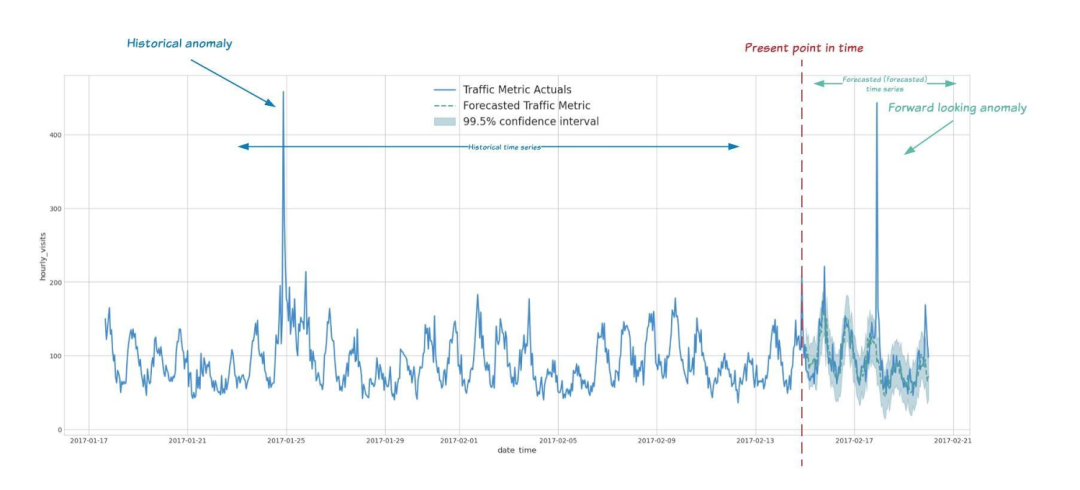
We can now use Arima_ The plus time series model detects anomalies in (historical) training data or new input data. The following are some examples of detecting time series data exceptions in some scenarios:
Detect exceptions in historical data:
Clean up data for prediction and modeling purposes, such as preprocessing ML models before training them with historical time series.
For example, when there are a large number of retail demand time series (hundreds of stores or thousands of products in zip codes), we may want to quickly determine which stores and product categories have abnormal sales patterns, and then conduct a more in-depth analysis of the causes of the exceptions.
Prospective anomaly detection:
Detect consumer behavior and pricing anomalies as early as possible: for example, if the traffic on a specific product page suddenly surges unexpectedly, the price may be abnormally low due to errors in the pricing process.
When there are a large number of retail demand time series (hundreds of stores or thousands of products in zip codes), we can determine which stores and product categories have abnormal sales patterns according to the forecast, so that we can quickly respond to any unexpected peak or trough.
So how to use ARIMA_PLUS detection exception? First create an ARIMA_PLUS time series model:
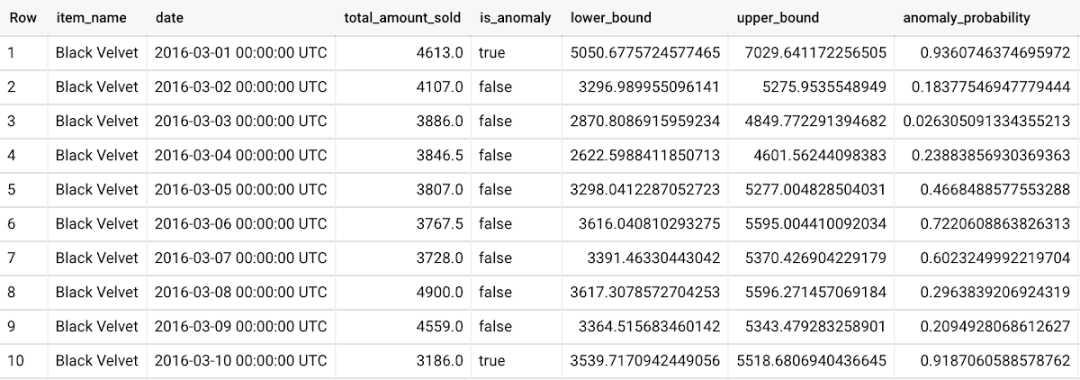
CREATE OR REPLACE MODEL mydataset.my_arima_plus_modelOPTIONS( MODEL_TYPE='ARIMA_PLUS', TIME_SERIES_TIMESTAMP_COL='date', TIME_SERIES_DATA_COL='total_amount_sold', IME_SERIES_ID_COL='item_name', HOLIDAY_REGION='US' ) ASSELECT date, item_description AS item_name, SUM(bottles_sold) AS total_amount_soldFROM `bigquery-public-data.iowa_liquor_sales.sales`GROUP BY date, item_nameHAVING date BETWEEN DATE('2016-01-04') AND DATE('2017-06-01') AND item_name IN ("Black Velvet", "Captain Morgan Spiced Rum", "Hawkeye Vodka", "Five O'Clock Vodka", "Fireball Cinnamon Whiskey")To detect anomalies in the training data, it is also necessary to use ml.detect for the model obtained above_ ANOMALIES
SELECT * FROM ML.DETECT_ANOMALIES(MODEL `mydataset.my_arima_plus_model`, STRUCT(0.8 AS anomaly_prob_threshold));
In addition, we also use ML.DETECT_ANOMALIES and provide new data as input:
WITH new_data AS ( SELECT date, item_description AS item_name, SUM(bottles_sold) AS total_amount_sold FROM `bigquery-public-data.iowa_liquor_sales.sales` GROUP BY date, item_name HAVING date BETWEEN DATE('2017-06-02') AND DATE('2017-10-01') AND item_name IN ('Black Velvet', 'Captain Morgan Spiced Rum', 'Hawkeye Vodka', "Five O'Clock Vodka", 'Fireball Cinnamon Whiskey') )SELECT *FROM ML.DETECT_ANOMALIES(MODEL `mydataset.my_arima_plus_model`, STRUCT(0.8 AS anomaly_prob_threshold), (SELECT * FROM new_data));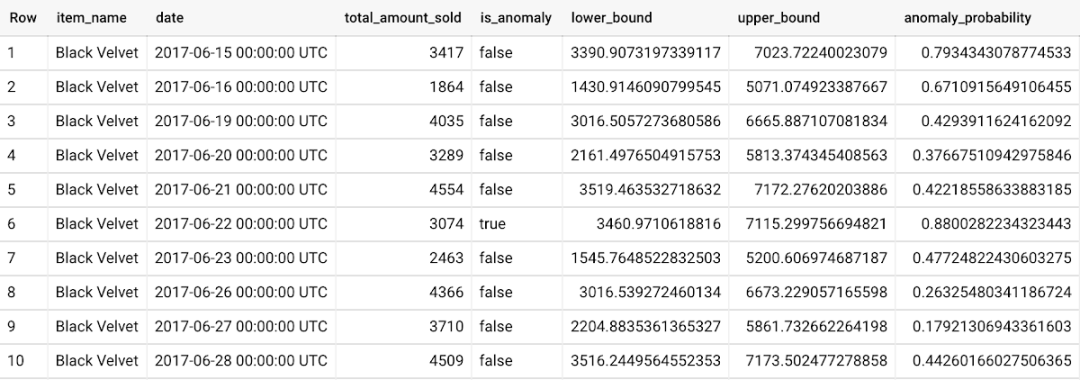
Finally, about using Arima_ For more information on anomaly detection with plus time series model, please refer to the document: https://cloud.google.com/bigquery-ml/docs/reference/standard-sql/bigqueryml-syntax-detect-anomalies#arima_plus_model_example_without_specified_settings
Compiled from: what's new with bigquery ml: unsupervised anomaly detection for time series and non time series data