Original link: Tcpdump sample tutorial
The main content of this paper is translated from <Tcpdump Examples>.
Tcpdump is a powerful network packet capturing tool. It uses libpcap library to grab network packets, which is found in almost all Linux/Unix. Familiar with the use of tcpdump can help you to analyze and debug network data. This article will introduce its use methods in different scenarios through specific examples. Whether you are a system administrator, programmer, cloud native engineer or yaml engineer, mastering the use of tcpdump can make you more powerful and get a raise.
1. Basic grammar and usage
The common parameters of tcpdump are as follows:
$ tcpdump -i eth0 -nn -s0 -v port 80
- -i: select the interface to capture, usually Ethernet card or wireless card, or vlan or other special interface. If there is only one network interface on the system, you do not need to specify it.
- -N n: single n means domain name is not resolved, and IP is displayed directly; two N means domain name and port are not resolved. This is not only convenient to view the IP and port numbers, but also very efficient in capturing a large amount of data, because domain name resolution will reduce the speed of capturing.
- -S0: tcpdump only intercepts the first 96 bytes by default. To intercept all message contents, you can use - s number, which is the number of bytes you want to intercept. If it is 0, it means to intercept all message contents.
- -v: use - v, - vv and - vvv to display more details, usually more protocol specific information.
- Port 80: This is a common port filter, indicating that only the traffic on port 80 is fetched, usually HTTP.
In addition, several common parameters are introduced:
- -p: do not let the network interface enter hybrid mode. By default, when tcpdump is used to grab packets, the network interface will enter hybrid mode. Generally, the network card works in the non hybrid mode. At this time, the network card only accepts the data that the destination address from the network port points to itself. When the network card works in hybrid mode, the network card captures all data from the interface and hands it to the corresponding driver. If the switch to which the device is connected turns on hybrid mode, the - p option can effectively filter the noise.
- -E: display data link layer information. By default, tcpdump does not display data link layer information. Use the - e option to display source and destination MAC addresses, as well as VLAN tag information. For example:
$ tcpdump -n -e -c 5 not ip6

tcpdump: verbose output suppressed, use -v or -vv for full protocol decode
listening on br-lan, link-type EN10MB (Ethernet), capture size 262144 bytes
18:27:53.619865 24:5e:be:0c:17:af > 00:e2:69:23:d3:3b, ethertype IPv4 (0x0800), length 1162: 192.168.100.20.51410 > 180.176.26.193.58695: Flags [.], seq 2045333376:2045334484, ack 3398690514, win 751, length 1108
18:27:53.626490 00:e2:69:23:d3:3b > 24:5e:be:0c:17:af, ethertype IPv4 (0x0800), length 68: 220.173.179.66.36017 > 192.168.100.20.51410: UDP, length 26
18:27:53.626893 24:5e:be:0c:17:af > 00:e2:69:23:d3:3b, ethertype IPv4 (0x0800), length 1444: 192.168.100.20.51410 > 220.173.179.66.36017: UDP, length 1402
18:27:53.628837 00:e2:69:23:d3:3b > 24:5e:be:0c:17:af, ethertype IPv4 (0x0800), length 1324: 46.97.169.182.6881 > 192.168.100.20.59145: Flags [P.], seq 3058450381:3058451651, ack 14349180, win 502, length 1270
18:27:53.629096 24:5e:be:0c:17:af > 00:e2:69:23:d3:3b, ethertype IPv4 (0x0800), length 54: 192.168.100.20.59145 > 192.168.100.1.12345: Flags [.], ack 3058451651, win 6350, length 0
5 packets captured
Show ASCII strings
-A means to print all the data of the message with ascii string, which makes it easier to read and use grep and other tools to analyze the output content. -X means to print all data of the message using both hexadecimal and ASCII strings. These two parameters cannot be used together. For example:
$ tcpdump -A -s0 port 80
Capture protocol specific data
You can follow the protocol name to filter the traffic of a specific protocol. Take UDP as an example, you can add the parameter UDP or protocol 17. These two commands have the same meaning.
$ tcpdump -i eth0 udp
$ tcpdump -i eth0 proto 17
Similarly, tcp and protocol 6 have the same meaning.
Grabbing data from a specific host
Use the filter host to grab traffic for a specific destination and source IP address.
$ tcpdump -i eth0 host 10.10.1.1
You can also use src or dst to grab only the source or destination:
$ tcpdump -i eth0 dst 10.10.1.20
Write the captured data to a file
When tcpdump is used to intercept data messages, it will print to the default output of the screen by default. You will see that in order and format, a lot of data line by line flash quickly, and there is no time to see all the contents clearly. However, tcpdump provides the ability to save the intercepted data to a file for later analysis using other graphical tools (such as wireshark, Snort).
-The w option is used to output data message to file:
$ tcpdump -i eth0 -s0 -w test.pcap
Line buffer mode
If you want to pipe the captured data to other tools for processing in real time, you need to use the - l option to turn on row buffering mode (or the - c option to turn on packet buffering mode). Use the - l option to send the output immediately to other commands, which respond immediately.
$ tcpdump -i eth0 -s0 -l port 80 | grep 'Server:'
Combined filter
The real power of filtering is that you can combine them at will, and the logic to connect them is commonly used with / and / & &, OR / OR / |, and / not /!.
and or &&
or or ||
not or !
2. filter
It is necessary to introduce the filter of tcpdump separately.
The number of network packets on the machine is abnormally large. In many cases, we only concern the data packets related to specific problems (such as the data of visiting a website, or the messages of icmp timeout, etc.), and these data only account for a small part. It is a time-consuming and laborious work to capture all the data and find the desired information from it. tcpdump provides a flexible syntax that can accurately intercept the concerned datagram and simplify the workload of analysis. These packet selection statements are filter s!
Host filter
Host filter is used to filter the data message of a host. For example:
$ tcpdump host 1.2.3.4
This command grabs all traffic sent to or from the host 1.2.3.4. If you want to capture only the traffic from this host, you can use the following command:
$ tcpdump src host 1.2.3.4
Network filter
The Network filter is used to filter the data of a certain Network segment CIDR Pattern. You can use four tuples (x.x.x), three tuples (x.x.x), two tuples (x.x), and one tuple (x). Quadruple is to specify a host. Triple indicates that the subnet mask is 255.255.255.0, two indicates that the subnet mask is 255.255.0.0, and one indicates that the subnet mask is 255.0.0.0. For example,
Capture all traffic sent to or from segment 192.168.1.x:
$ tcpdump net 192.168.1
Capture all traffic sent to or from segment 10.x.x.x:
$ tcpdump net 10
As with the Host filter, you can specify the source and destination here:
$ tcpdump src net 10
You can also use the CIDR format:
$ tcpdump src net 172.16.0.0/12
Proto filter
Proto filter is used to filter the data of a protocol. The keyword is proto, which can be omitted. Proto can be followed by the protocol number or protocol name. It supports icmp, igmp, igrp, pim, ah, esp, carp, vrrp, udp and tcp. Because the usual protocol name is a reserved field, when the proto instruction is used together, one or two backslashes (/) must be used to escape based on the shell type. The shell in Linux needs two backslashes to escape, and Mac OS only needs one.
For example, capture the message of icmp Protocol:
$ tcpdump -n proto \\icmp
# perhaps
$ tcpdump -n icmp
Port filter
The port filter is used to filter the data messages passing through a port. The key word is port. For example:
$ tcpdump port 389
3. Understand the output of tcpdump
Intercepting data is only the first step, and the second step is to understand the data. Next, we will explain the significance of the output parts of tcpdump command.
21:27:06.995846 IP (tos 0x0, ttl 64, id 45646, offset 0, flags [DF], proto TCP (6), length 64)
    192.168.1.106.56166 > 124.192.132.54.80: Flags [S], cksum 0xa730 (correct), seq 992042666, win 65535, options [mss 1460,nop,wscale 4,nop,nop,TS val 663433143 ecr 0,sackOK,eol], length 0

21:27:07.030487 IP (tos 0x0, ttl 51, id 0, offset 0, flags [DF], proto TCP (6), length 44)
    124.192.132.54.80 > 192.168.1.106.56166: Flags [S.], cksum 0xedc0 (correct), seq 2147006684, ack 992042667, win 14600, options [mss 1440], length 0

21:27:07.030527 IP (tos 0x0, ttl 64, id 59119, offset 0, flags [DF], proto TCP (6), length 40)
    192.168.1.106.56166 > 124.192.132.54.80: Flags [.], cksum 0x3e72 (correct), ack 2147006685, win 65535, length 0
The most basic and important information is the source address / port and destination address / port of the datagram. In the first datagram in the above example, the source address ip is 192.168.1.106, the source port is 56166, the destination address is 124.192.132.54, and the destination port is 80. >The symbol represents the direction of the data.
In addition, the above three data are the three-way handshake process of TCP protocol. The first one is SYN message, which can be seen from Flags [S]. The following are the Flags of common TCP messages:
- [S] : SYN (start connection)
- [.]: no Flag
- [P] : PSH (push data)
- [F] : FIN (end connection)
- [R] : RST (reset connection)
The [S.] of the second data indicates SYN-ACK, which is the response message of SYN message.
4. examples
Here are some specific examples. Each example can use multiple methods to get the same output. The method you use depends on the output you need and the traffic on the network. When we are troubleshooting, we usually only want to get what we want. We can achieve this goal through filter and ASCII output, and combining pipeline with grep, cut, awk and other tools.
For example, when grabbing HTTP request and response packets, you can filter the noise by deleting the flag SYN/ACK/FIN, but there is a simpler way, which is to pipe it to grep. At the same time, we should choose the simplest and most efficient method. Here's an example.
Extract HTTP user agent
Extract the HTTP user agent from the HTTP request header:
$ tcpdump -nn -A -s1500 -l | grep "User-Agent:"
With egrep, you can extract both user agent and host name (or other header file):
$ tcpdump -nn -A -s1500 -l | egrep -i 'User-Agent:|Host:'
Capture only HTTP GET and POST traffic
Grab HTTP GET traffic:
$ tcpdump -s 0 -A -vv 'tcp[((tcp[12:1] & 0xf0) >> 2):4] = 0x47455420'
You can also grab HTTP POST request traffic:
$ tcpdump -s 0 -A -vv 'tcp[((tcp[12:1] & 0xf0) >> 2):4] = 0x504f5354'
Note: this method can't guarantee to grab HTTP POST effective data traffic, because a POST request will be divided into multiple TCP packets.
The hexadecimal in these two expressions will match the ASCII strings of GET and POST requests. For example, TCP [((TCP [12:1] & 0xf0) > Determine the location of the bytes we are interested in (after the TCP header), then select the four bytes we want to match.
Extract the URL of the HTTP request
Extract the host name and path of the HTTP request:
$ tcpdump -s 0 -v -n -l | egrep -i "POST /|GET /|Host:"

tcpdump: listening on enp7s0, link-type EN10MB (Ethernet), capture size 262144 bytes
    POST /wp-login.php HTTP/1.1
    Host: dev.example.com
    GET /wp-login.php HTTP/1.1
    Host: dev.example.com
    GET /favicon.ico HTTP/1.1
    Host: dev.example.com
    GET / HTTP/1.1
    Host: dev.example.com
Extract the password in the HTTP POST request
Extract password and hostname from HTTP POST request:
$ tcpdump -s 0 -A -n -l | egrep -i "POST /|pwd=|passwd=|password=|Host:"

tcpdump: verbose output suppressed, use -v or -vv for full protocol decode
listening on enp7s0, link-type EN10MB (Ethernet), capture size 262144 bytes
11:25:54.799014 IP 10.10.1.30.39224 > 10.10.1.125.80: Flags [P.], seq 1458768667:1458770008, ack 2440130792, win 704, options [nop,nop,TS val 461552632 ecr 208900561], length 1341: HTTP: POST /wp-login.php HTTP/1.1
.....s..POST /wp-login.php HTTP/1.1
Host: dev.example.com
.....s..log=admin&pwd=notmypassword&wp-submit=Log+In&redirect_to=http%3A%2F%2Fdev.example.com%2Fwp-admin%2F&testcookie=1
Extract Cookies
Extract set Cookie (server's Cookie) and Cookie (client's Cookie):
$ tcpdump -nn -A -s0 -l | egrep -i 'Set-Cookie|Host:|Cookie:'

tcpdump: verbose output suppressed, use -v or -vv for full protocol decode
listening on wlp58s0, link-type EN10MB (Ethernet), capture size 262144 bytes
Host: dev.example.com
Cookie: wordpress_86be02xxxxxxxxxxxxxxxxxxxc43=admin%7C152xxxxxxxxxxxxxxxxxxxxxxxxxxxxxxxxxxxxxxxxxxxxxxxxxfb3e15c744fdd6; _ga=GA1.2.21343434343421934; _gid=GA1.2.927343434349426; wordpress_test_cookie=WP+Cookie+check; wordpress_logged_in_86be654654645645645654645653fc43=admin%7C15275102testtesttesttestab7a61e; wp-settings-time-1=1527337439
Grab ICMP packets
To view all ICMP packets on the network:
$ tcpdump -n icmp

tcpdump: verbose output suppressed, use -v or -vv for full protocol decode
listening on enp7s0, link-type EN10MB (Ethernet), capture size 262144 bytes
11:34:21.590380 IP 10.10.1.217 > 10.10.1.30: ICMP echo request, id 27948, seq 1, length 64
11:34:21.590434 IP 10.10.1.30 > 10.10.1.217: ICMP echo reply, id 27948, seq 1, length 64
11:34:27.680307 IP 10.10.1.159 > 10.10.1.1: ICMP 10.10.1.189 udp port 59619 unreachable, length 115
Grab ICMP packets of non ECHO/REPLY type
By excluding echo and reply type packets, the captured packets do not include standard ping packets:
$ tcpdump 'icmp[icmptype] != icmp-echo and icmp[icmptype] != icmp-echoreply'

tcpdump: verbose output suppressed, use -v or -vv for full protocol decode
listening on enp7s0, link-type EN10MB (Ethernet), capture size 262144 bytes
11:37:04.041037 IP 10.10.1.189 > 10.10.1.20: ICMP 10.10.1.189 udp port 36078 unreachable, length 156
Grab mail of SMTP/POP3 protocol
You can extract the body of an email and other data. For example, extract only recipients of e-mail:
$ tcpdump -nn -l port 25 | grep -i 'MAIL FROM\|RCPT TO'
Retrieving the query and response of NTP service
$ tcpdump dst port 123

tcpdump: verbose output suppressed, use -v or -vv for full protocol decode
listening on eth0, link-type EN10MB (Ethernet), capture size 65535 bytes
21:02:19.112502 IP test33.ntp > 199.30.140.74.ntp: NTPv4, Client, length 48
21:02:19.113888 IP 216.239.35.0.ntp > test33.ntp: NTPv4, Server, length 48
21:02:20.150347 IP test33.ntp > 216.239.35.0.ntp: NTPv4, Client, length 48
21:02:20.150991 IP 216.239.35.0.ntp > test33.ntp: NTPv4, Server, length 48
Capture the query and response of SNMP service
Through SNMP service, penetration testers can get a lot of equipment and system information. Among these information, system information is the most critical, such as operating system version, kernel version, etc. Use the SNMP protocol fast scanner onesixtyone to see the information of the target system:
$ onesixtyone 10.10.1.10 public

Scanning 1 hosts, 1 communities
10.10.1.10 [public] Linux test33 4.15.0-20-generic #21-Ubuntu SMP Tue Apr 24 06:16:15 UTC 2018 x86_64
GetRequest and GetResponse can be retrieved through tcpdump:
$ tcpdump -n -s0  port 161 and udp
tcpdump: verbose output suppressed, use -v or -vv for full protocol decode
listening on wlp58s0, link-type EN10MB (Ethernet), capture size 262144 bytes
23:39:13.725522 IP 10.10.1.159.36826 > 10.10.1.20.161:  GetRequest(28)  .1.3.6.1.2.1.1.1.0
23:39:13.728789 IP 10.10.1.20.161 > 10.10.1.159.36826:  GetResponse(109)  .1.3.6.1.2.1.1.1.0="Linux testmachine 4.15.0-20-generic #21-Ubuntu SMP Tue Apr 24 06:16:15 UTC 2018 x86_64"
Cut pcap file
When a large amount of data is grabbed and written to a file, it can be automatically cut into multiple files of the same size. For example, the following command means to create a new file capture-(hour).pcap every 3600 seconds, with each file size no more than 200 * 1000000 bytes:
$ tcpdump -w /tmp/capture-%H.pcap -G 3600 -C 200
These files are named capture-{1-24}.pcap. After 24 hours, the previous files will be overwritten.
Grab IPv6 traffic
IPv6 traffic can be captured through filter ip6, and protocol such as TCP can be specified at the same time:
$ tcpdump -nn ip6 proto 6
Read IPv6 UDP data message from the previously saved file:
$ tcpdump -nr ipv6-test.pcap ip6 proto 17
Test port scan
In the following example, you will find that the source and destination of the captured message remain the same, with flag bits [S] and [R], which match a series of seemingly random target ports. After sending SYN, if the port of the target host is not opened, a RESET will be returned. This is the standard practice of port scanning tools such as Nmap.
$ tcpdump -nn

21:46:19.693601 IP 10.10.1.10.60460 > 10.10.1.199.5432: Flags [S], seq 116466344, win 29200, options [mss 1460,sackOK,TS val 3547090332 ecr 0,nop,wscale 7], length 0
21:46:19.693626 IP 10.10.1.10.35470 > 10.10.1.199.513: Flags [S], seq 3400074709, win 29200, options [mss 1460,sackOK,TS val 3547090332 ecr 0,nop,wscale 7], length 0
21:46:19.693762 IP 10.10.1.10.44244 > 10.10.1.199.389: Flags [S], seq 2214070267, win 29200, options [mss 1460,sackOK,TS val 3547090333 ecr 0,nop,wscale 7], length 0
21:46:19.693772 IP 10.10.1.199.389 > 10.10.1.10.44244: Flags [R.], seq 0, ack 2214070268, win 0, length 0
21:46:19.693783 IP 10.10.1.10.35172 > 10.10.1.199.1433: Flags [S], seq 2358257571, win 29200, options [mss 1460,sackOK,TS val 3547090333 ecr 0,nop,wscale 7], length 0
21:46:19.693826 IP 10.10.1.10.33022 > 10.10.1.199.49153: Flags [S], seq 2406028551, win 29200, options [mss 1460,sackOK,TS val 3547090333 ecr 0,nop,wscale 7], length 0
21:46:19.695567 IP 10.10.1.10.55130 > 10.10.1.199.49154: Flags [S], seq 3230403372, win 29200, options [mss 1460,sackOK,TS val 3547090334 ecr 0,nop,wscale 7], length 0
21:46:19.695590 IP 10.10.1.199.49154 > 10.10.1.10.55130: Flags [R.], seq 0, ack 3230403373, win 0, length 0
21:46:19.695608 IP 10.10.1.10.33460 > 10.10.1.199.49152: Flags [S], seq 3289070068, win 29200, options [mss 1460,sackOK,TS val 3547090335 ecr 0,nop,wscale 7], length 0
21:46:19.695622 IP 10.10.1.199.49152 > 10.10.1.10.33460: Flags [R.], seq 0, ack 3289070069, win 0, length 0
21:46:19.695637 IP 10.10.1.10.34940 > 10.10.1.199.1029: Flags [S], seq 140319147, win 29200, options [mss 1460,sackOK,TS val 3547090335 ecr 0,nop,wscale 7], length 0
21:46:19.695650 IP 10.10.1.199.1029 > 10.10.1.10.34940: Flags [R.], seq 0, ack 140319148, win 0, length 0
21:46:19.695664 IP 10.10.1.10.45648 > 10.10.1.199.5060: Flags [S], seq 2203629201, win 29200, options [mss 1460,sackOK,TS val 3547090335 ecr 0,nop,wscale 7], length 0
21:46:19.695775 IP 10.10.1.10.49028 > 10.10.1.199.2000: Flags [S], seq 635990431, win 29200, options [mss 1460,sackOK,TS val 3547090335 ecr 0,nop,wscale 7], length 0
21:46:19.695790 IP 10.10.1.199.2000 > 10.10.1.10.49028: Flags [R.], seq 0, ack 635990432, win 0, length 0
Filter Nmap NSE script test results
In this case, the Nmap NSE test script http-enum.nse is used to detect the legal URL of the HTTP service.
On the host where the script test is performed:
$ nmap -p 80 --script=http-enum.nse targetip
On the target host:
$ tcpdump -nn port 80 | grep "GET /"

GET /w3perl/ HTTP/1.1
GET /w-agora/ HTTP/1.1
GET /way-board/ HTTP/1.1
GET /web800fo/ HTTP/1.1
GET /webaccess/ HTTP/1.1
GET /webadmin/ HTTP/1.1
GET /webAdmin/ HTTP/1.1
Grab DNS requests and responses
The outbound DNS request and A record response sent to Google public DNS can be retrieved through tcpdump:
$ tcpdump -i wlp58s0 -s0 port 53

tcpdump: verbose output suppressed, use -v or -vv for full protocol decode
listening on wlp58s0, link-type EN10MB (Ethernet), capture size 262144 bytes
14:19:06.879799 IP test.53852 > google-public-dns-a.google.com.domain: 26977+ [1au] A? play.google.com. (44)
14:19:07.022618 IP google-public-dns-a.google.com.domain > test.53852: 26977 1/0/1 A 216.58.203.110 (60)
Grab HTTP valid packets
Grab the HTTP valid packets of port 80, and exclude the packets (SYN / FIN / ACK) during the establishment of TCP connection:
$ tcpdump 'tcp port 80 and (((ip[2:2] - ((ip[0]&0xf)<<2)) - ((tcp[12]&0xf0)>>2)) != 0)'
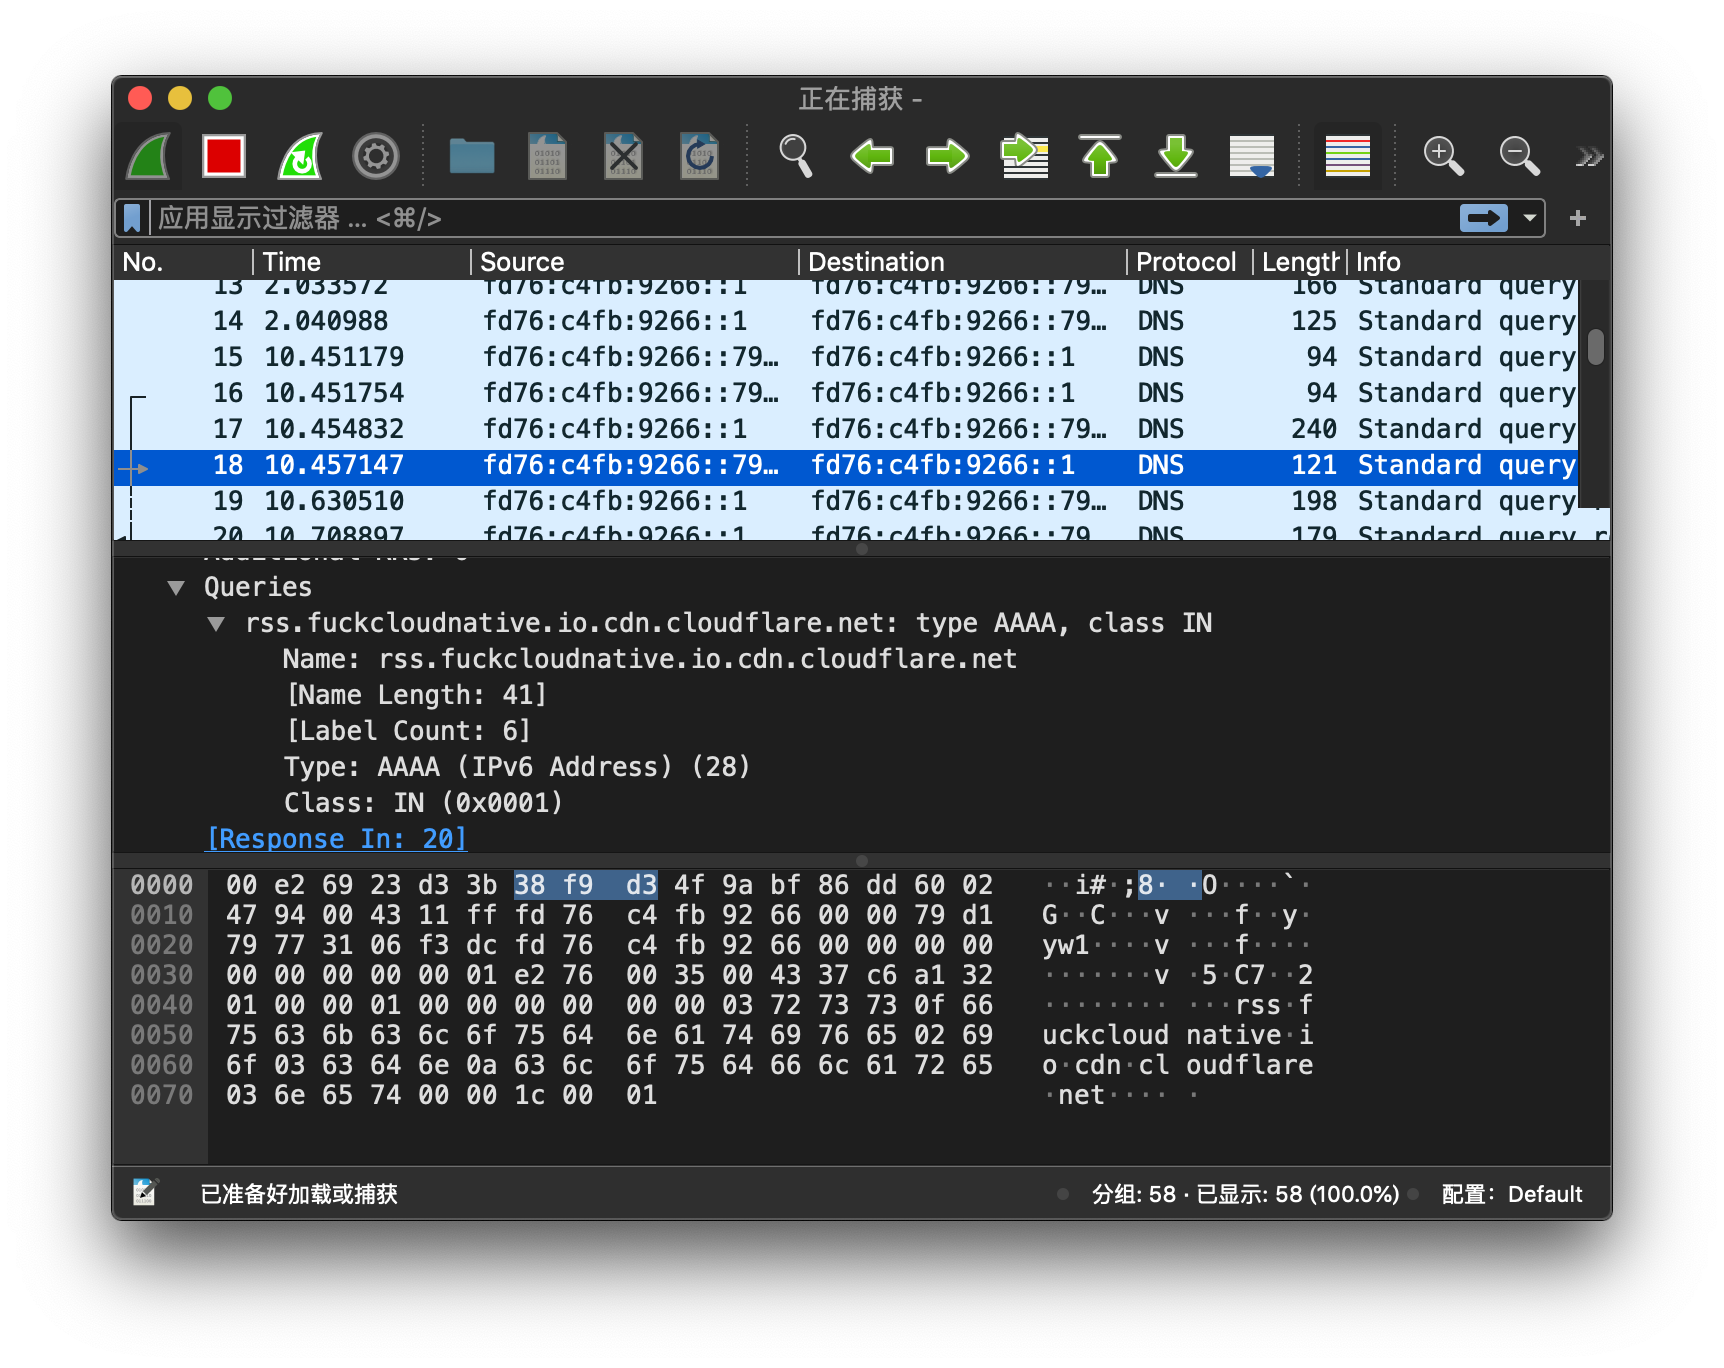
Redirect output to Wireshark
Generally, Wireshark (or tshark) is easier to analyze application layer protocol than tcpdump. The general method is to use tcpdump to grab data and write it to the file on the remote server, and then copy the file to the local workstation for Wireshark analysis.
There is a more efficient way to send the captured data to Wireshark for analysis in real time through ssh connection. Take the MacOS system for example, you can install it through brew cask install wireshark, and then analyze it through the following command:
$ ssh root@remotesystem 'tcpdump -s0 -c 1000 -nn -w - not port 22' | /Applications/Wireshark.app/Contents/MacOS/Wireshark -k -i -
For example, if you want to analyze the DNS protocol, you can use the following command:
$ ssh root@remotesystem 'tcpdump -s0 -c 1000 -nn -w - port 53' | /Applications/Wireshark.app/Contents/MacOS/Wireshark -k -i -
Captured data:
-The C option is used to limit the size of the fetched data. If you do not limit the size, you can only use ctrl-c to stop fetching, which not only turns off tcpdump, but also turns off wireshark.
Identify the IP with the highest number of contracts
To find the IP with the most packets in a period of time, or to find the IP with the most packets from a heap of messages, use the following command:
$ tcpdump -nnn -t -c 200 | cut -f 1,2,3,4 -d '.' | sort | uniq -c | sort -nr | head -n 20

tcpdump: verbose output suppressed, use -v or -vv for full protocol decode
listening on enp7s0, link-type EN10MB (Ethernet), capture size 262144 bytes
200 packets captured
261 packets received by filter
0 packets dropped by kernel
    108 IP 10.10.211.181
     91 IP 10.10.1.30
1 IP 10.10.1.50- cut -f 1,2,3,4 -d '.': print the first four columns of each row with. As the separator. I.e. IP address.
- sort | uniq -c: sort and count
- sort -nr: reverse order by value size
Grab user name and password
This example focuses on the standard plain text protocol to filter messages related to user name and password:
$ tcpdump port http or port ftp or port smtp or port imap or port pop3 or port telnet -l -A | egrep -i -B5 'pass=|pwd=|log=|login=|user=|username=|pw=|passw=|passwd=|password=|pass:|user:|username:|password:|login:|pass |user '
Grab DHCP message
In the last example, the request and response messages of the DHCP service are retrieved. 67 is the DHCP port and 68 is the client port.
$ tcpdump -v -n port 67 or 68

tcpdump: listening on enp7s0, link-type EN10MB (Ethernet), capture size 262144 bytes
14:37:50.059662 IP (tos 0x10, ttl 128, id 0, offset 0, flags [none], proto UDP (17), length 328)
    0.0.0.0.68 > 255.255.255.255.67: BOOTP/DHCP, Request from 00:0c:xx:xx:xx:d5, length 300, xid 0xc9779c2a, Flags [none]
      Client-Ethernet-Address 00:0c:xx:xx:xx:d5
      Vendor-rfc1048 Extensions
        Magic Cookie 0x63825363
        DHCP-Message Option 53, length 1: Request
        Requested-IP Option 50, length 4: 10.10.1.163
        Hostname Option 12, length 14: "test-ubuntu"
        Parameter-Request Option 55, length 16:
          Subnet-Mask, BR, Time-Zone, Default-Gateway
          Domain-Name, Domain-Name-Server, Option 119, Hostname
          Netbios-Name-Server, Netbios-Scope, MTU, Classless-Static-Route
          NTP, Classless-Static-Route-Microsoft, Static-Route, Option 252
14:37:50.059667 IP (tos 0x10, ttl 128, id 0, offset 0, flags [none], proto UDP (17), length 328)
    0.0.0.0.68 > 255.255.255.255.67: BOOTP/DHCP, Request from 00:0c:xx:xx:xx:d5, length 300, xid 0xc9779c2a, Flags [none]
      Client-Ethernet-Address 00:0c:xx:xx:xx:d5
      Vendor-rfc1048 Extensions
        Magic Cookie 0x63825363
        DHCP-Message Option 53, length 1: Request
        Requested-IP Option 50, length 4: 10.10.1.163
        Hostname Option 12, length 14: "test-ubuntu"
        Parameter-Request Option 55, length 16:
          Subnet-Mask, BR, Time-Zone, Default-Gateway
          Domain-Name, Domain-Name-Server, Option 119, Hostname
          Netbios-Name-Server, Netbios-Scope, MTU, Classless-Static-Route
          NTP, Classless-Static-Route-Microsoft, Static-Route, Option 252
14:37:50.060780 IP (tos 0x0, ttl 64, id 53564, offset 0, flags [none], proto UDP (17), length 339)
    10.10.1.1.67 > 10.10.1.163.68: BOOTP/DHCP, Reply, length 311, xid 0xc9779c2a, Flags [none]
      Your-IP 10.10.1.163
      Server-IP 10.10.1.1
      Client-Ethernet-Address 00:0c:xx:xx:xx:d5
      Vendor-rfc1048 Extensions
        Magic Cookie 0x63825363
        DHCP-Message Option 53, length 1: ACK
        Server-ID Option 54, length 4: 10.10.1.1
        Lease-Time Option 51, length 4: 86400
        RN Option 58, length 4: 43200
        RB Option 59, length 4: 75600
        Subnet-Mask Option 1, length 4: 255.255.255.0
        BR Option 28, length 4: 10.10.1.255
        Domain-Name-Server Option 6, length 4: 10.10.1.1
        Hostname Option 12, length 14: "test-ubuntu"
        T252 Option 252, length 1: 10
        Default-Gateway Option 3, length 4: 10.10.1.1
5. summary
This paper mainly introduces the basic syntax and usage of tcpdump, and shows its powerful filtering function through some examples. The combination of tcpdump and wireshark can play a more powerful role. This paper also shows how to combine tcpdump and wireshark gracefully and smoothly. If you want to know more details, you can check tcpdump's man manual.