This article describes how to use benchmark sql5 0 to test the OLTP performance of opengauss database, and two server performance monitoring tools, htop iostat.
1. Concept introduction
1.1. Introduction to TPC-C
TPC-C is an On-Line Transaction Processing Benchmark.
TPC-C is measured in transactions per minute (tpmC).
TPC-C is a set of benchmark s commonly used in the industry. It is formulated and released by the TPC committee to evaluate the online transaction processing (OLTP) capability of the database.
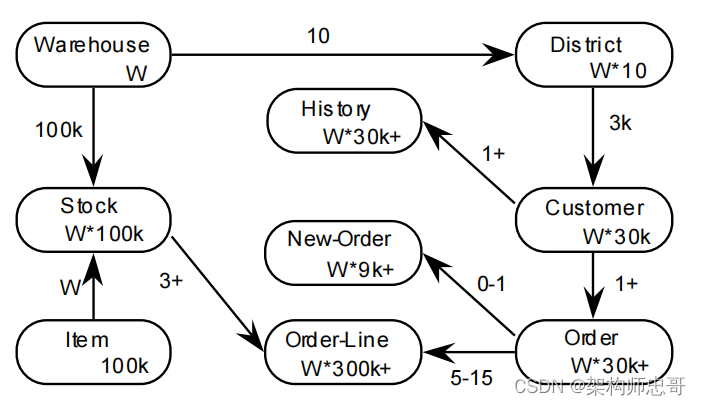
It mainly involves 10 tables, including five types of business transaction models (NewOrder – new order generation, Payment – order Payment, OrderStatus – recent order query, Delivery – distribution, StockLevel – inventory shortage status analysis).
TPC-C transaction model
TPC-C needs to deal with the following five types of transactions:
- New order: the customer enters a new order transaction;
- Payment: update the customer's account balance to reflect its payment status;
- Delivery: shipment (simulating batch transaction);
- Order status query: query the status of the customer's recent transaction;
- Stock level query: query the inventory status of the warehouse so that replenishment can be made in time.
TPC-C measures the maximum effective throughput (MQTh) of the system through the tpmC value (Transactions per Minute), where Transactions are subject to NewOrder Transaction s, that is, the final measurement unit is the number of new orders processed per minute
TPC-C performance measurement index tpmC
Flow indicator (tpmC): according to the definition of TPC organization, flow indicator describes how many new order transactions can be processed by the system every minute while performing four transactions: payment operation, order status query, shipment and inventory status query.
The response time of all transactions must meet the requirements of TPC-C test specification, and the proportion of various transactions should also meet the requirements of TPC-C test specification. In this case, the larger the traffic index value, the higher the online transaction processing capacity of the system.
The model of TPC-C table is as follows:
1.2. BenchmarkSQL
BenchmarkSQL5.0 is the TPCC standard test tool.
benchmark is written in java language and compiled with ant, so you need to install and configure java and ant environment in advance
1.3. htop tools
Htop is a monitoring tool on linux. It can be considered as an enhanced version of top. During the operation of tpcc, it is recommended to use htop to monitor the resource status
Htop one click Install using yum source yum install htop
1.4. iostat tool
iostat tool monitors the system disk and analyzes the read and write status of the disk
htop one click Install sysstat using yum source
2. Test environment preparation
2.1. Install java/ant
Install JDK 1.8 x,ant 1.9.x. And configure the environment variables to compile benchmark sql5 with ant 0 and execute the java program
2.2. benchmark installation
2.2.1. benchmark Download
It can be downloaded from the following two addresses
- https://blog.opengauss.org/zh/post/optimize/images/benchmarksql-5.0.zip
- https://sourceforge.net/projects/benchmarksql/
2.2.2. Replace jdbc driver jar package
Enter the unzipped directory benchmark sql-5.0/lib/postgres
- from Official website Download the corresponding jdbc driver package, extract it and put it in this directory
- Back up or delete the self-contained postgresql driver jar package [otherwise, an error will be reported: 10 authentication type is not supported. Please check that you have configured pg_hba.conf file to contain the IP address or network section of the client, and that the authentication architecture mode supported by the driver is supported.]
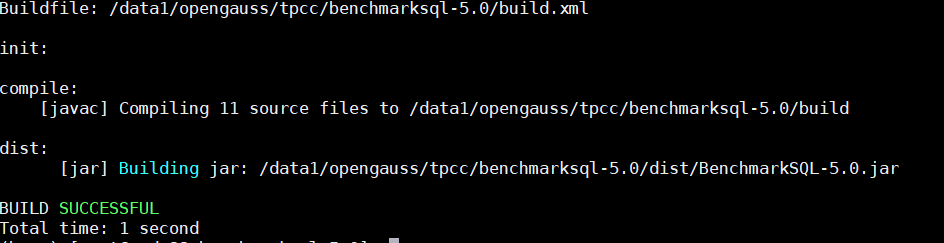
2.2.3. compile
Enter the root directory of benchmark sql-5.0 and enter the ant command to compile.
3. Test TPC-C performance
3.1. Create tpcc database and database users
create user tpcc identified by 'test@123' profile default;
alter user tpcc sysadmin;
grant all privilege to tpcc;
create database tpccdb encoding 'UTF8' template=template0 ;
3.2. Configure props PG file
//db refers to the type of database. Currently, postgres and oracle are supported
db=postgres
driver=org.postgresql.Driver
conn=jdbc:postgresql://172.25.xx.xx:16001/tpccdb?prepareThreshold=1&batchMode=on&fetchsize=10
user=tpcc
password=test@123

//The number of warehouses, and the size of each warehouse is about 100MB
warehouses=1000
//The number of load processes used to initialize data in the database
loadWorkers=200

//Number of terminals, i.e. number of concurrent clients. The maximum concurrent quantity set here corresponds to the maximum number of work on the server.
terminals=812
//The number of fixed transactions run by each terminal,
//For example, if the value is set to 10, it means that each terminal runs 10 transactions. If there are 32 terminals, the test ends after 320 transactions are run as a whole.
//When this parameter is configured as a non-zero value, the following runMins parameter must be set to 0
runTxnsPerTerminal=0
//The overall time to be tested, in minutes,
//If runMins is set to 60, the test will last for 1 hour.
//When the value is set to a non-zero value, the runTxnsPerTerminal parameter must be set to 0.
//These two parameters cannot be set to positive integers at the same time. If one of them is set, the other must be 0,
//The main difference is that runMins defines the time length to control the test time; runTxnsPerTerminal defines the total number of transactions to control time.
runMins=5
//Limit the total number of transactions per minute. This parameter mainly controls the number of transactions processed per minute. The number of transactions is affected by the terminals parameter, which is 300 by default.
//If the number of terminals is greater than the limitTxnsPerMin value, it means that the number of concurrent transactions is greater than the total number of transactions per minute, and this parameter will become invalid,
//If terminals is set to 1000 and limittxnspermin is set to 300, then 1000 concurrent transactions are initiated at the same time, then setting the number of transactions per minute to 300 is meaningless,
//Therefore, to make this parameter valid, you can set the number to be greater than the concurrent number, or invalidate it
limitTxnsPerMin=0

//The binding mode of terminal and warehouse can be run when it is set to true. 4 X compatibility mode means that each terminal has a fixed warehouse.
//When set to false, the overall database configuration can be used uniformly.
//TPCC stipulates that each terminal must have a bound warehouse, so the default value of true is generally used.
terminalWarehouseFixed=false

//The sum of the following five values is 100.
//The default value is 45, 43, 4, 4 & 4, which is consistent with the proportion defined in TPC-C test. During actual operation, the specific weight can be adjusted to adapt to various scenarios.
newOrderWeight=45
paymentWeight=43
orderStatusWeight=4
deliveryWeight=4
stockLevelWeight=4

//The test data generation directory does not need to be modified by default. It is generated under the run directory by default. The name is like my_result_xxxx folder.
//Cancel this content by commenting.
resultDirectory=my_result_%tY-%tm-%td_%tH%tM%tS
//The operating system performance collection script does not need to be modified by default. The operating system needs to have a python environment
osCollectorScript=./misc/os_collector_linux.py
//The collection interval of the operating system is 1 second by default
//osCollectorInterval=1
//The operating system collects the corresponding host. If the local database is tested, the parameter can be annotated,
//If you want to test the remote server, fill in the user name and host name.
//osCollectorSSHAddr=omm@172.25.xx.xx
//The network card name and disk name of the collected server in the operating system,
//For example, if you use ifconfig to view the operating system network card name, ens2f1, then the following network card name is set to net_ens2f1 (net# prefix fixed);
//Use df -h or fdisk -l to view the disk mount directory, such as / dev/sdc, / dev/sde, and set the following disk name to blk_sda1 (blk# prefix fixed)
//osCollectorDevices=net_ens2f1 blk_nvme0n1 blk_sdc blk_sde
3.3. Replace table creation SQL
Replace benchmark sql-5.0/run/sql.xml with the following common/tableCreates. The contents of SQL.
Two tablespaces and some additional data attributes are mainly added to increase disk IO during testing
During the performance test, in order to increase IO throughput, pg_ The data under xlog, tablespace 2 and tablespace 3 are scattered on different storage media, and the soft connection pointing to the real location is given at the original location.
pg_xlog is located in the database directory, and tablespace 2 and tablespace 3 are located in the database directory PG respectively_ Location.
CREATE TABLESPACE example2 relative location 'tablespace2';
CREATE TABLESPACE example3 relative location 'tablespace3';

create table bmsql_config (
  cfg_name    varchar(30),
  cfg_value   varchar(50)
);

create table bmsql_warehouse (
  w_id        integer   not null,
  w_ytd       decimal(12,2),
  w_tax       decimal(4,4),
  w_name      varchar(10),
  w_street_1  varchar(20),
  w_street_2  varchar(20),
  w_city      varchar(20),
  w_state     char(2),
  w_zip       char(9)
) WITH (FILLFACTOR=80);

create table bmsql_district (
  d_w_id       integer       not null,
  d_id         integer       not null,
  d_ytd        decimal(12,2),
  d_tax        decimal(4,4),
  d_next_o_id  integer,
  d_name       varchar(10),
  d_street_1   varchar(20),
  d_street_2   varchar(20),
  d_city       varchar(20),
  d_state      char(2),
  d_zip        char(9)
 ) WITH (FILLFACTOR=80);

create table bmsql_customer (
  c_w_id         integer        not null,
  c_d_id         integer        not null,
  c_id           integer        not null,
  c_discount     decimal(4,4),
  c_credit       char(2),
  c_last         varchar(16),
  c_first        varchar(16),
  c_credit_lim   decimal(12,2),
  c_balance      decimal(12,2),
  c_ytd_payment  decimal(12,2),
  c_payment_cnt  integer,
  c_delivery_cnt integer,
  c_street_1     varchar(20),
  c_street_2     varchar(20),
  c_city         varchar(20),
  c_state        char(2),
  c_zip          char(9),
  c_phone        char(16),
  c_since        timestamp,
  c_middle       char(2),
  c_data         varchar(500)
) WITH (FILLFACTOR=80) tablespace example2;

create sequence bmsql_hist_id_seq;

create table bmsql_history (
  hist_id  integer,
  h_c_id   integer,
  h_c_d_id integer,
  h_c_w_id integer,
  h_d_id   integer,
  h_w_id   integer,
  h_date   timestamp,
  h_amount decimal(6,2),
  h_data   varchar(24)
) WITH (FILLFACTOR=80);

create table bmsql_new_order (
  no_w_id  integer   not null,
  no_d_id  integer   not null,
  no_o_id  integer   not null
) WITH (FILLFACTOR=80);

create table bmsql_oorder (
  o_w_id       integer      not null,
  o_d_id       integer      not null,
  o_id         integer      not null,
  o_c_id       integer,
  o_carrier_id integer,
  o_ol_cnt     integer,
  o_all_local  integer,
  o_entry_d    timestamp
) WITH (FILLFACTOR=80);

create table bmsql_order_line (
  ol_w_id         integer   not null,
  ol_d_id         integer   not null,
  ol_o_id         integer   not null,
  ol_number       integer   not null,
  ol_i_id         integer   not null,
  ol_delivery_d   timestamp,
  ol_amount       decimal(6,2),
  ol_supply_w_id  integer,
  ol_quantity     integer,
  ol_dist_info    char(24)
) WITH (FILLFACTOR=80);

create table bmsql_item (
  i_id     integer      not null,
  i_name   varchar(24),
  i_price  decimal(5,2),
  i_data   varchar(50),
  i_im_id  integer
);

create table bmsql_stock (
  s_w_id       integer       not null,
  s_i_id       integer       not null,
  s_quantity   integer,
  s_ytd        integer,
  s_order_cnt  integer,
  s_remote_cnt integer,
  s_data       varchar(50),
  s_dist_01    char(24),
  s_dist_02    char(24),
  s_dist_03    char(24),
  s_dist_04    char(24),
  s_dist_05    char(24),
  s_dist_06    char(24),
  s_dist_07    char(24),
  s_dist_08    char(24),
  s_dist_09    char(24),
  s_dist_10    char(24)
) WITH (FILLFACTOR=80) tablespace example3;
3.4. Run benchmark
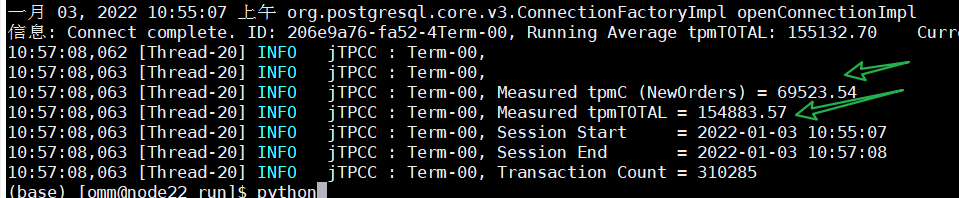
Just pay attention to tpmTOTAL and tpmC
cd benchmarksql-5.0/run
## Generate test data
## In order to facilitate multiple tests and reduce the time of importing data, the database can be backed up by stopping the database and copying the whole data directory once.
./runDatabaseBuild.sh props.pg
## TPCC test
./runBenchmark.sh props.pg

##Clear test data
 ./runDatabaseDestroy.sh props.pg
The test results are similar to the following figure. Under the single machine of OpenGauss, the tpmC can reach up to 1.5 million
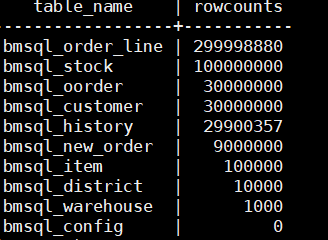
3.5. Test auxiliary SQL or command
# View the database footprint,
select datname, pg_size_pretty (pg_database_size(datname)) AS size from pg_database

# View the number of records in each table in tpccdb
select relname as TABLE_NAME, reltuples as rowCounts from pg_class where relkind = 'r' and relnamespace = (select oid from pg_namespace where nspname='public') order by rowCounts desc;
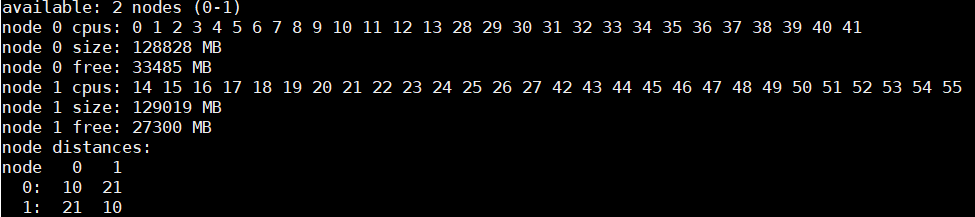
- View the configuration of NUMA through numactl or bind the process to the specified CPU core
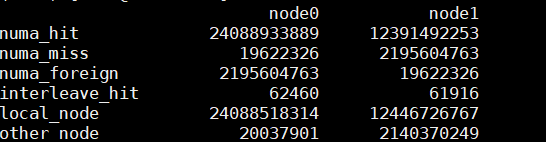
- Observe the status of each NUMA node through the numastat command.
- numa_hit indicates the number of times the CPU core in the node accesses local memory.
- numa_miss indicates the number of times the node kernel accesses the memory of other nodes. Memory access across nodes will have high latency, which will reduce performance. Therefore, NUMA_ The value of miss should be as low as possible. If it is too high, binding should be considered.
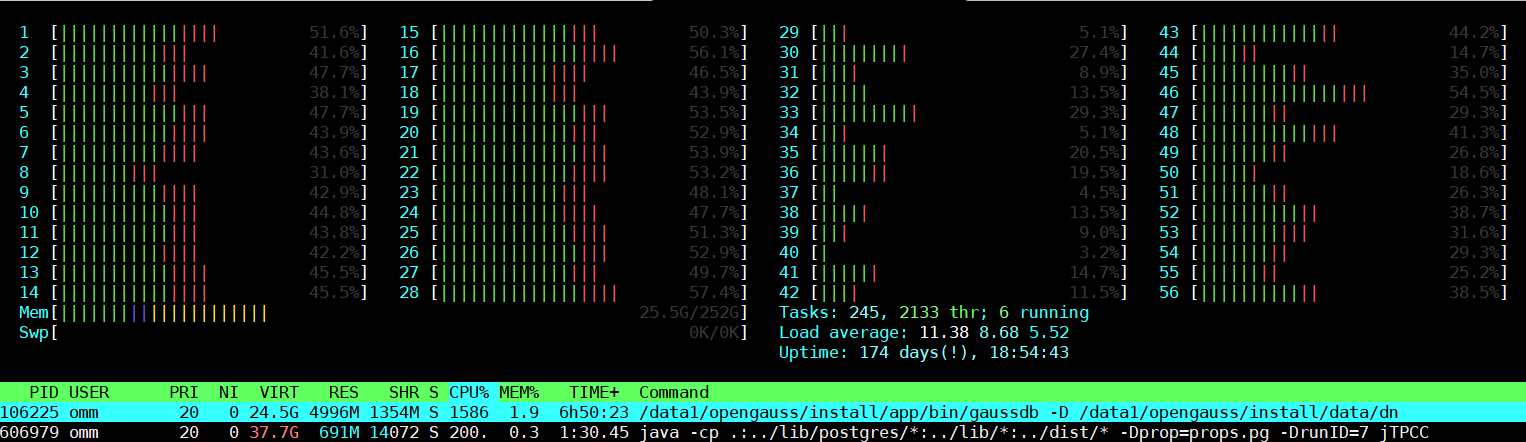
# numa installation
yum -y install numactl numastat

# View the NUMA configuration of the current server
numactl -H

#The process is bound to the specified CPU core
#Use htop to monitor the CPU utilization of database server and tpcc client. Under the best performance test, the CPU utilization of each business is very high (> 90%).
#If the CPU utilization fails to meet the standard, it may be due to the wrong binding method or other problems. You need to locate the root cause for adjustment.
numactl -C 0-13,28-41,14-27,42-55 ./runBenchmark.sh props.pg

# View the memory access hit rate of the current NUMA node
numastat

# Check the usage of each CPU through htop
As can be seen from the numactl execution result, the sample server is divided into two NUMA nodes. Each node contains 28 CPU core s, and the memory size of each node is about 128GB. At the same time, the command also gives the distance between different nodes. The farther the distance, the greater the delay of cross NUMA memory access. Application runtime should reduce memory access across NUMA.