In my previous article:
I detailed how to use the system module in Filebeat to import syslog into Elasticsearch. This is by far the quickest way. In actual use, we can also use other to import syslog. The method here is:
- Using the in Filebeat syslog input

- Import using Logstash

In today's article, I will detail how to configure Rsyslog to import data into elastic search. I will use Ubuntu 20.04 to elaborate.
Configure Rsyslog
On Linux, by default, all log files are located in the / var/log directory. There are several types of log files that store different messages, including cron, kernel, security, events, users, and so on. In most cases, these log files are controlled by the rsyslog service.
Rsyslog can be configured in client / server mode. When configured as a client, it sends logs to the remote server over the network through the TCP/UDP protocol. As a server, it receives logs over the network from remote clients on port 514 TCP/UDP or any custom port configured to listen.
If Rsyslog is not installed on your system, please follow the following instructions:
sudo apt-get update
sudo apt-get install rsyslog
In today's exercise, we will configure Rsyslog as a client so that it can send logs to Filebeat or Logstash.
We first open the file / etc / rsyslog. In the Linux machine conf. And add the following section at the end of the file:
/etc/rsyslog.conf
$PreserveFQDN on
*.* @@192.168.0.4:514
$ActionQueueFileName queue
$ActionQueueMaxDiskSpace 1g
$ActionQueueSaveOnShutdown on
$ActionQueueType LinkedList
$ActionResumeRetryCount -1
Above, I used the IP address of my own machine 192.168.0. You need to modify it according to your actual IP address. The above is configured for TCP port address 514. If you want to configure UDP, you need to change the second line above to:
*.* @192.168.0.4:514
Note that this is an @ symbol instead of the previous two @ @.
When we finish modifying the rsyslog After conf, we can restart the service with the following command:
service rsyslog restart
We can use the following command to view the operation of the service:
service rsyslog status
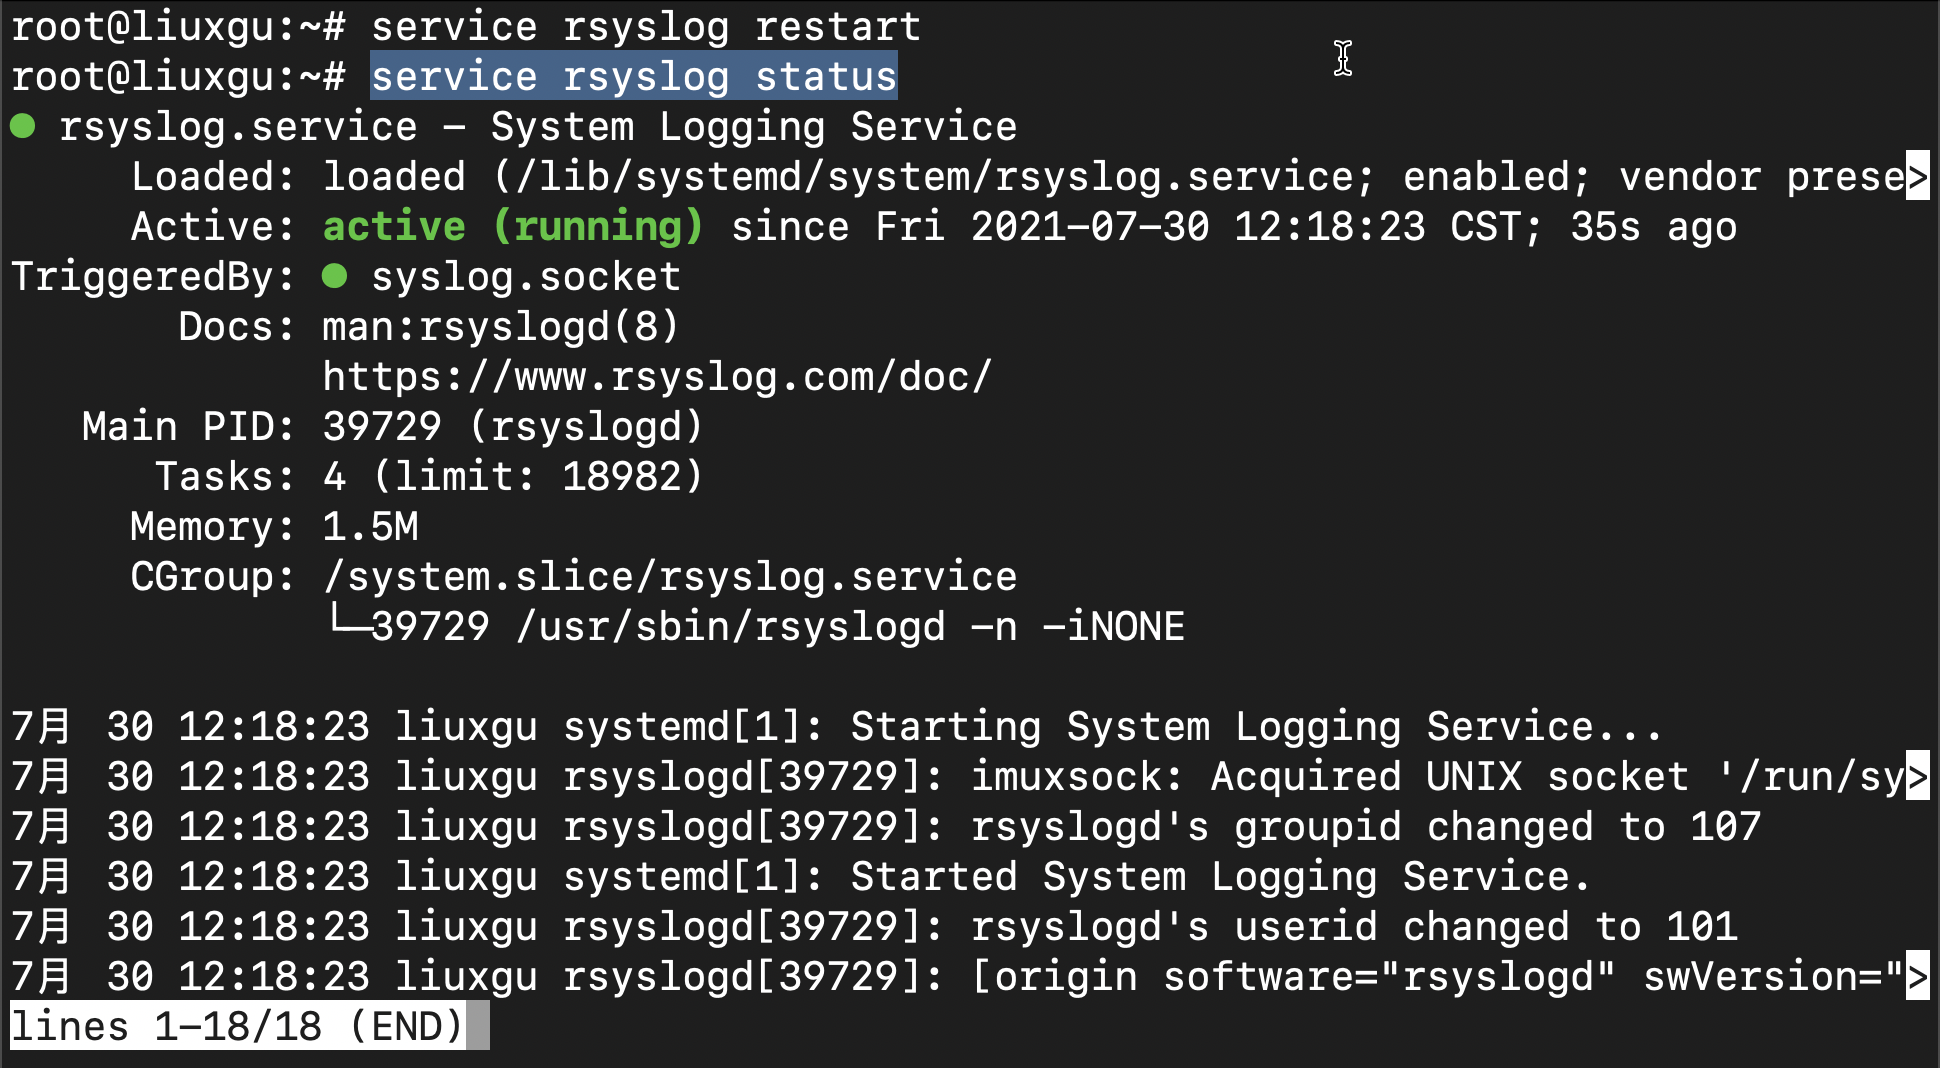
If you see active above, it means that the service is running normally.
Many times, we want to know the log of this service. We can view it through the following command:
journalctl -u rsyslog
Through the above configuration, Rsyslog is configured as a client, which will send log information like the server 192.168.0.4:512 port.
Collecting logs using Filebeat
Next, we use Filebeat to configure inputs. We can find the configuration file of Filebeat at the following location YML, and add the following input to the file:
/etc/filebeat/filebeat.yml
filebeat.inputs:

# Each - is an input. Most options can be set at the input level, so
# you can use different inputs for various configurations.
# Below are the input specific configurations.

- type: syslog
  enabled: true
  max_message_size: 10KiB
  timeout: 10
  keep_null: true
  protocol.tcp:
    host: "0.0.0.0:514"
In the above configuration, we use syslog as the type and set tcp as the protocol. In this configuration, Filebeat will run in server mode and wait for the link from the client:
netstat -tnlp | grep :514
# netstat -tnlp | grep :514
tcp6       0      0 :::514                  :::*                    LISTEN      42015/filebeat
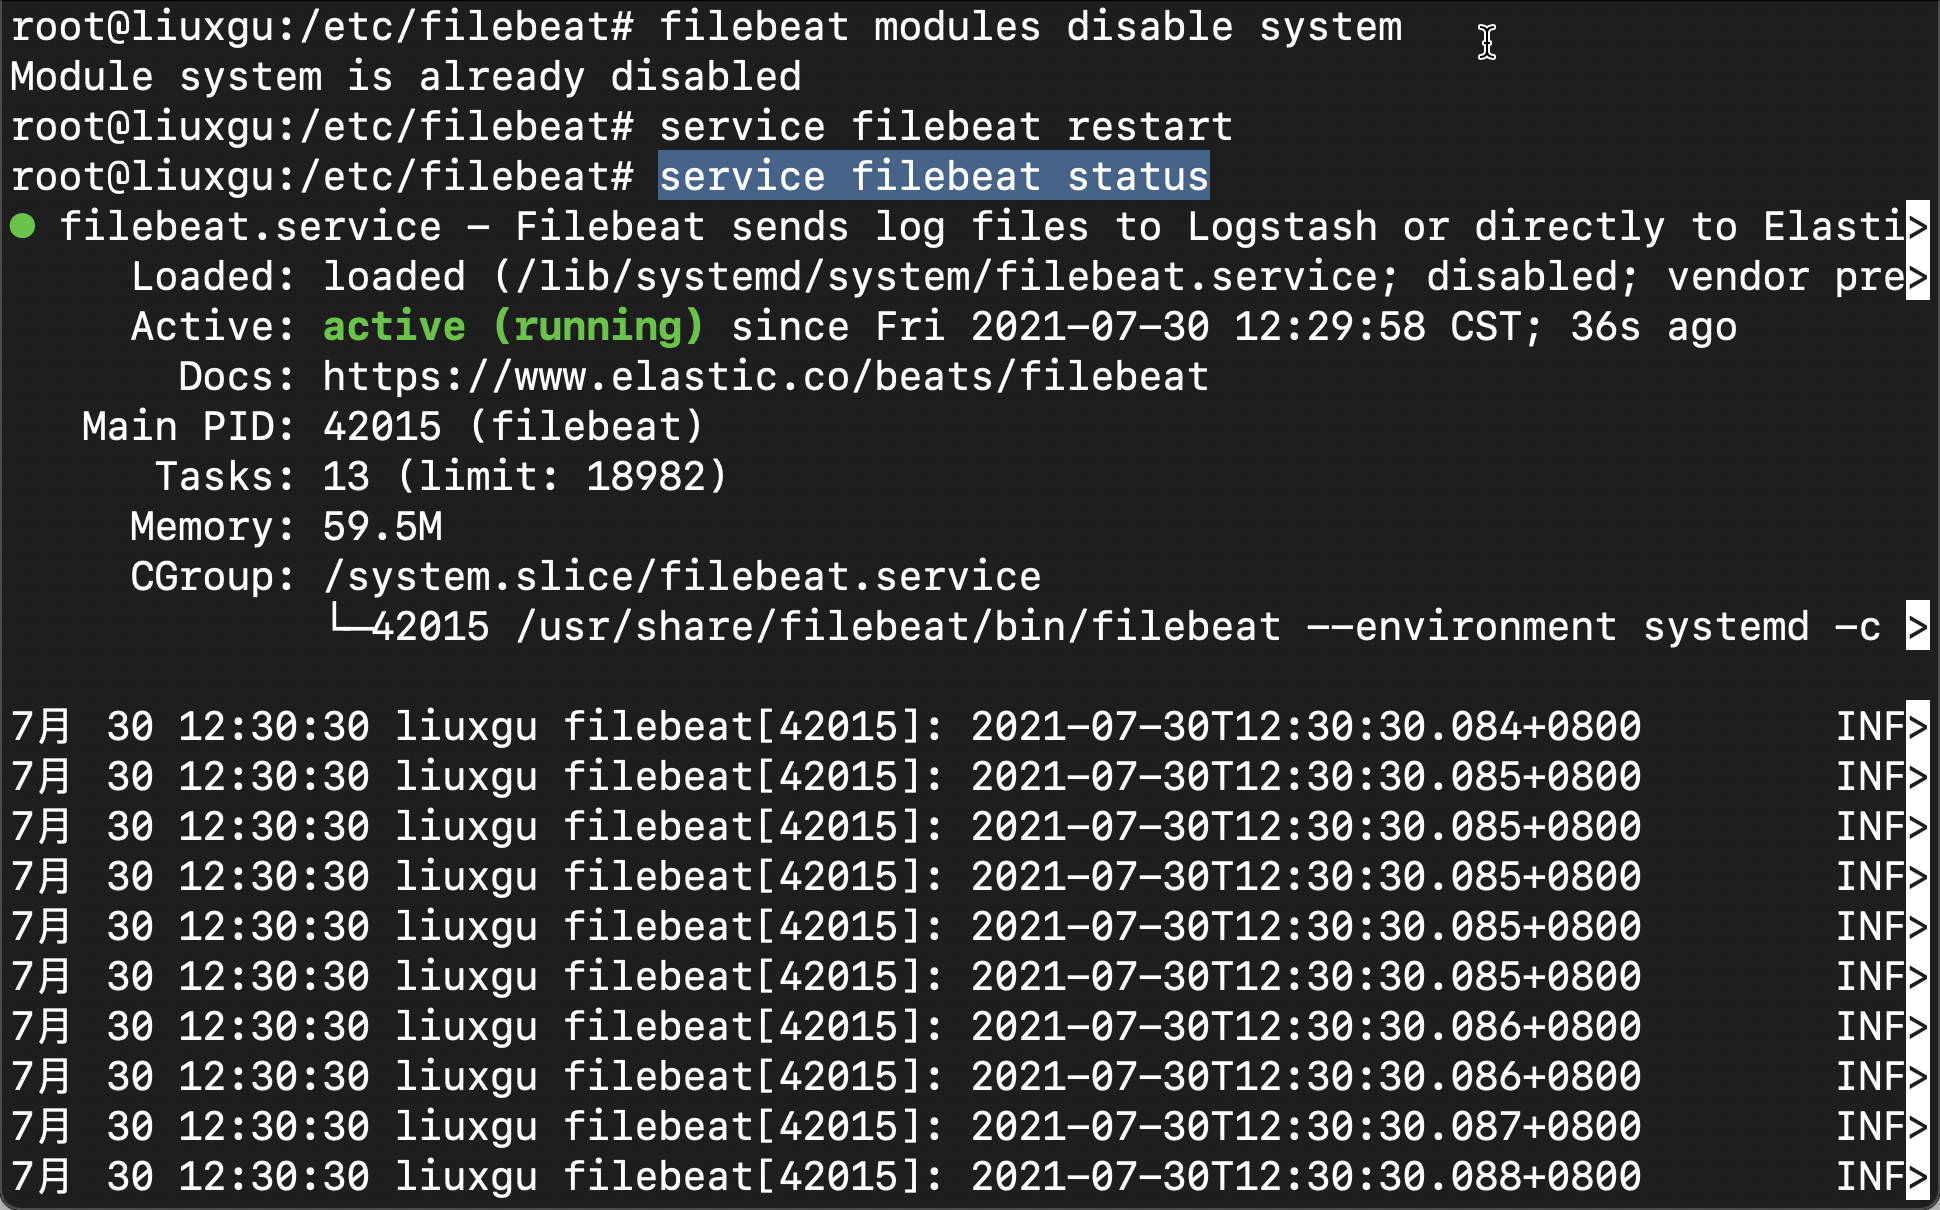
Before running Filebeat, we ensure that the system module is disabled:
filebeat modules disable system
In this way, our system module does not work. Of course, if we need other benefits brought by the system module in Filebeat, we can run it when the system module is started:
filebeat setup
Then disable the system module. For the function of the setup instruction, please refer to the article“ Beats: decrypt the setup command in Filebeat".
After modifying filebeat After the YML file, we restart the service:
service filebeat restart
We can use the following command to view the operation of the service:
service filebeat status
We open Kibana and view the document in Discover:
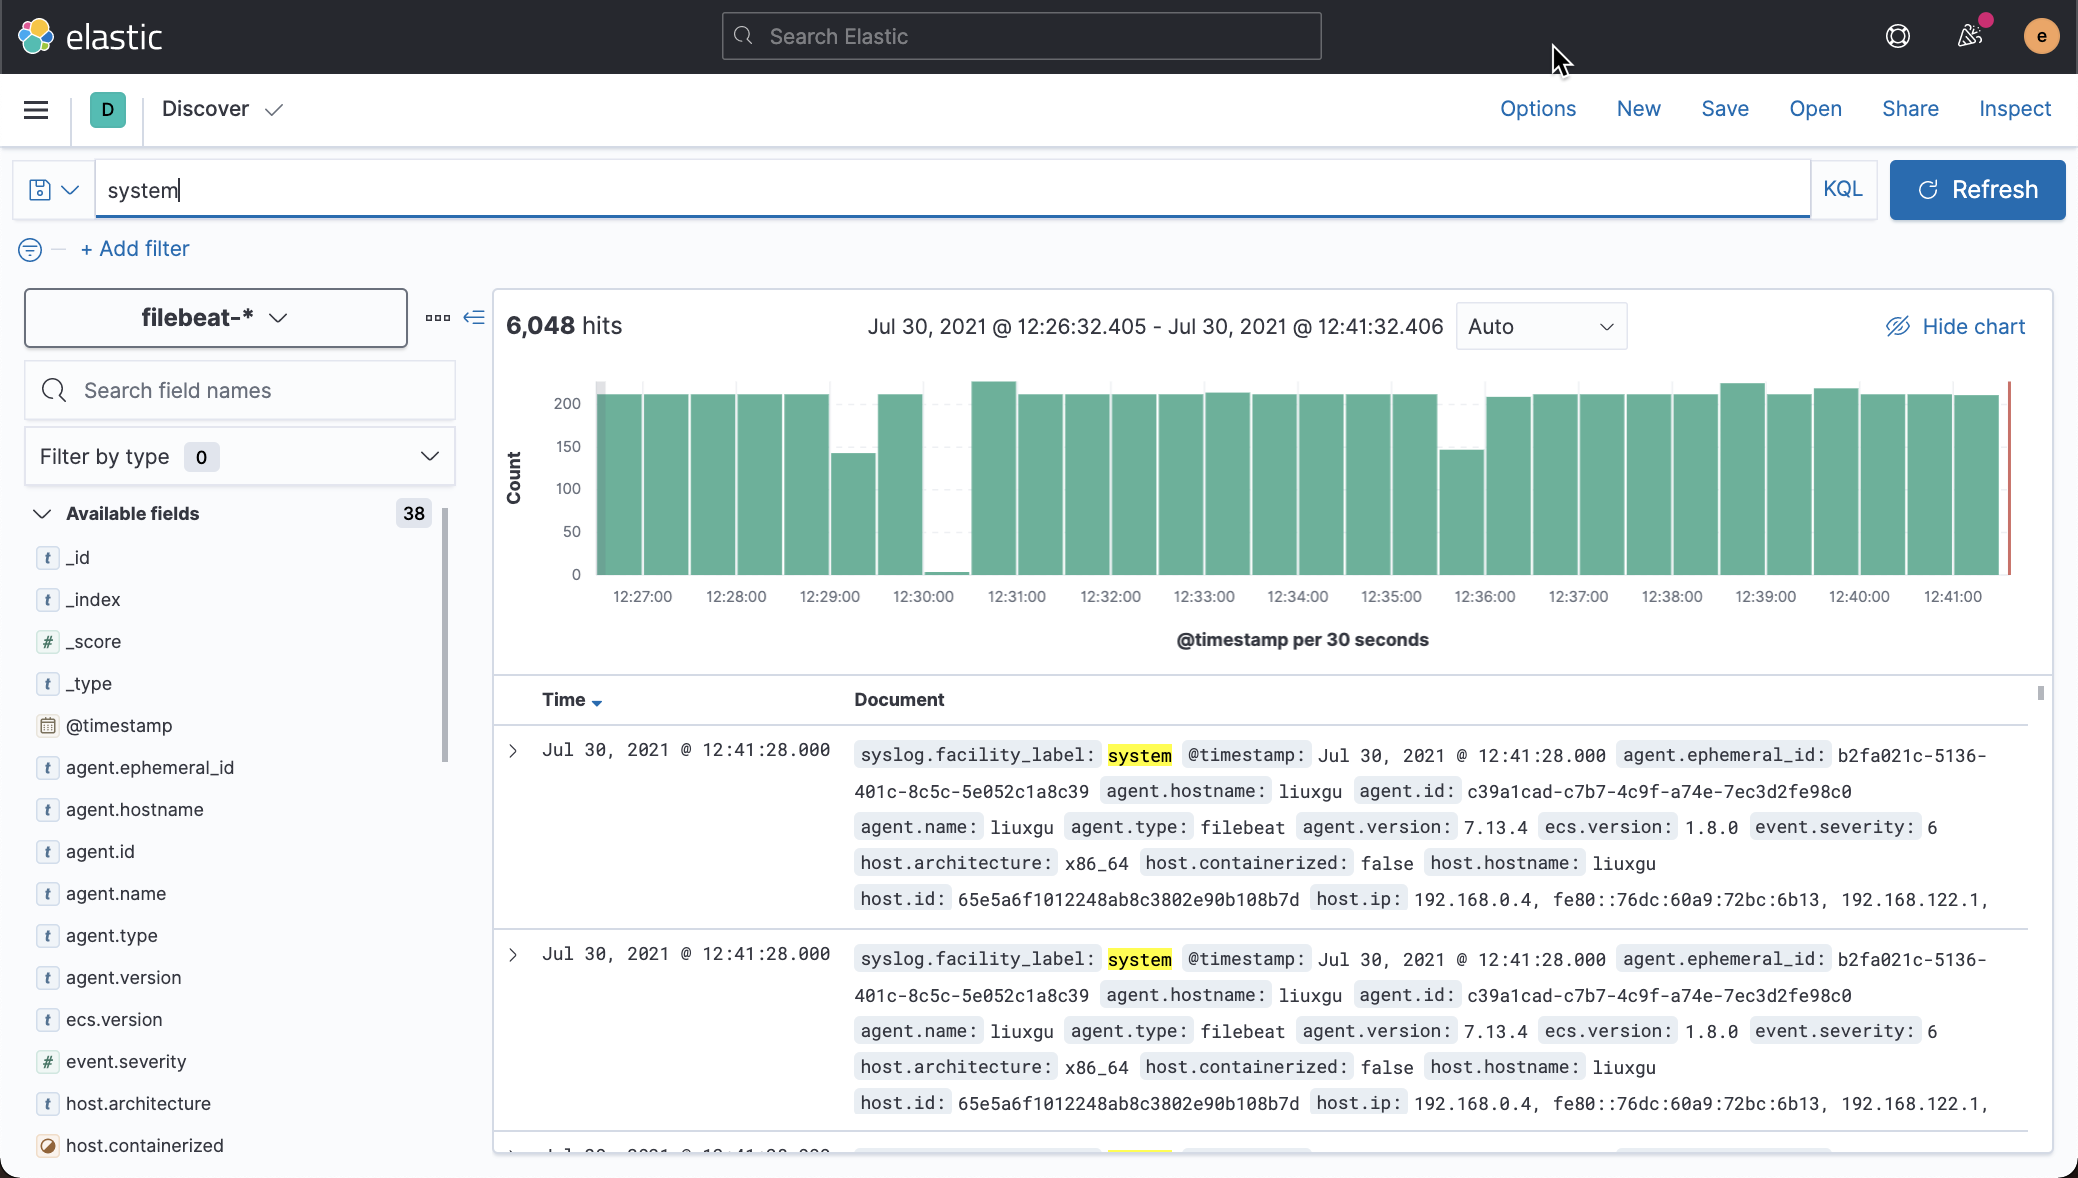
We can see that the system logs have been collected.
Import data using Logstash
We can refer to the previous articles“ Logstash: Configuration Example ”To configure. We create a directory called sysloog Conf file:
/etc/logstash/conf.d/syslog.conf
input {
  tcp {
    port => 50515
    type => syslog
  }
}


filter {
  if [type] == "syslog" {
    grok {
      match => { "message" => "%{SYSLOGTIMESTAMP:syslog_timestamp} %{SYSLOGHOST:syslog_hostname} %{DATA:syslog_program}(?:\[%{POSINT:syslog_pid}\])?: %{GREEDYDATA:syslog_message}" }
      add_field => [ "received_at", "%{@timestamp}" ]
      add_field => [ "received_from", "%{host}" ]
    }
    date {
      match => [ "syslog_timestamp", "MMM  d HH:mm:ss", "MMM dd HH:mm:ss" ]
    }
  }
}

output {
  elasticsearch {
    hosts => ["192.168.0.3:9200"]
    user => elastic
    password => password
  }

  stdout { codec => rubydebug }
}
After configuration, we need to restart the Logstash service.
We modify the port in Rsyslog to 50515, and then restart Rsyslog.
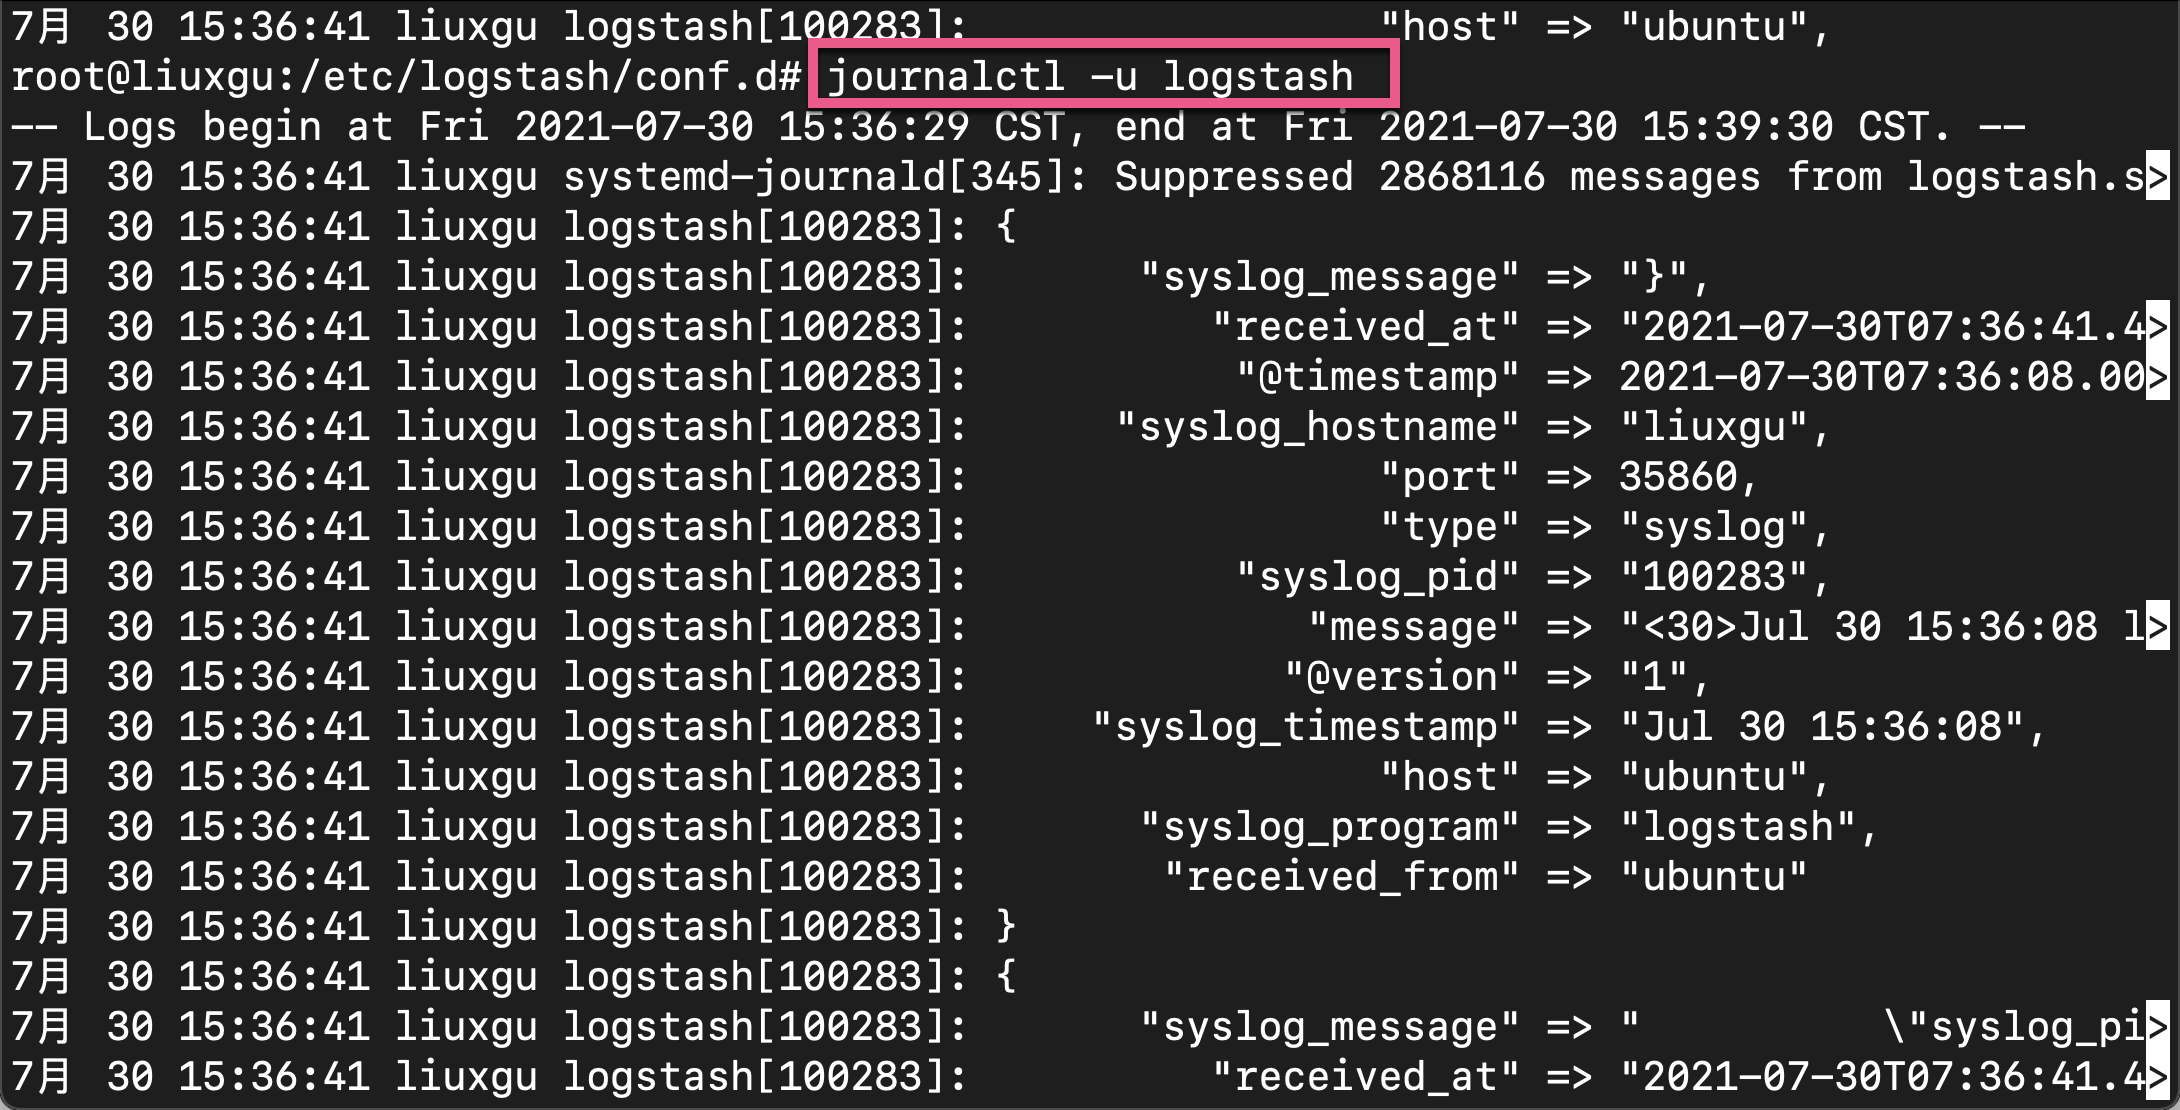
We can see many logs appear on the Logstash screen. You can view Logstash logs through the following commands:
journalctl -u logstash
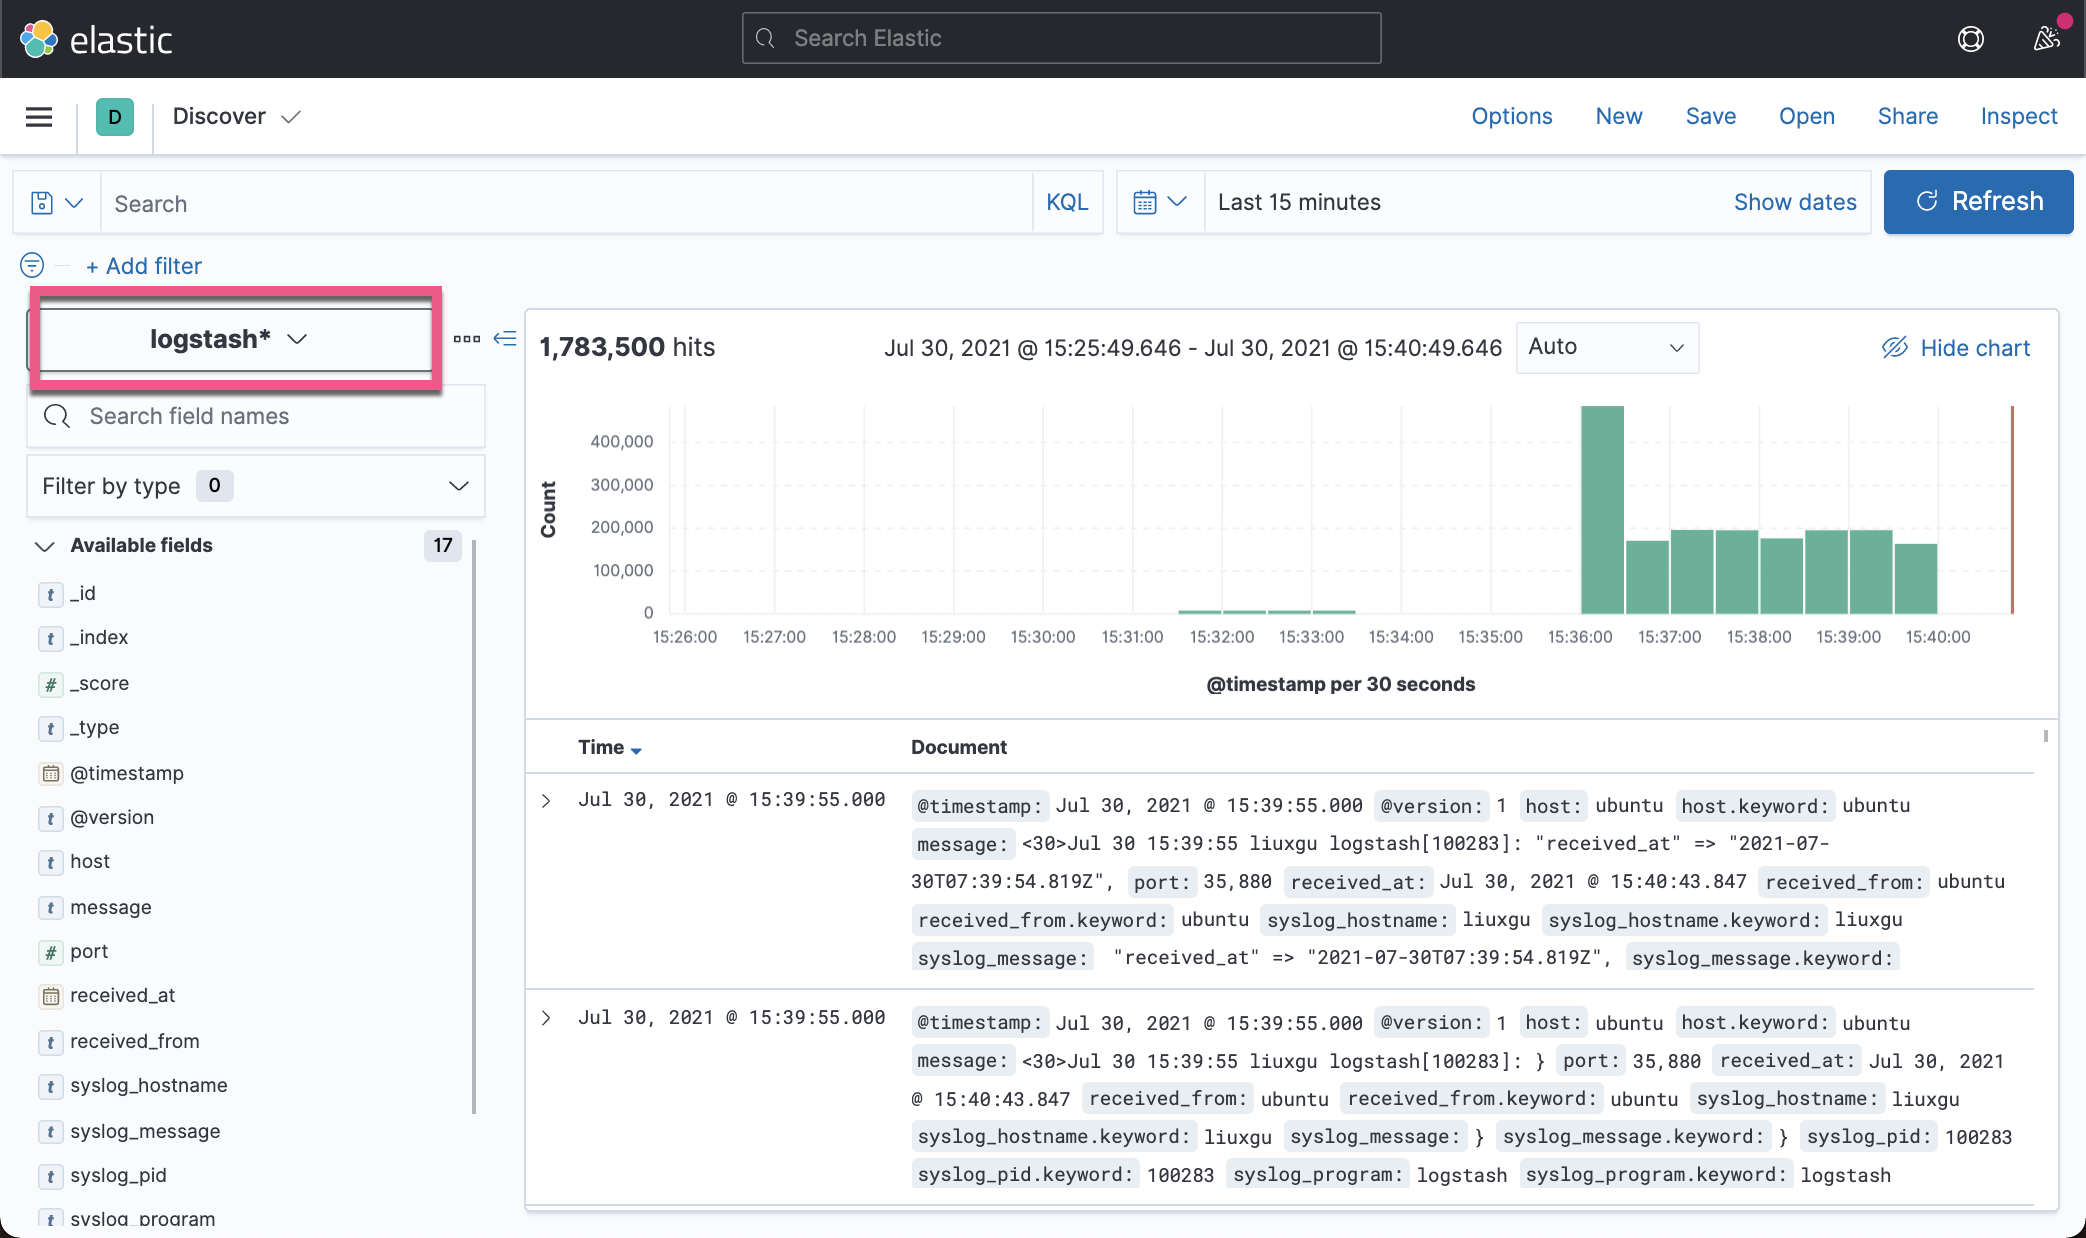
We can also see the imported logs in Kibana:
reference resources:
[1]https://computingforgeeks.com/configure-rsyslog-centralized-log-server-on-ubuntu/
[2]https://kifarunix.com/setup-rsyslog-server-on-ubuntu-20-04/