

In the daily business operation process, managers often need to quickly understand the operation health of the business, identify bottlenecks and problems, and formulate response plans. To get an overview of the business, we can use some statistical tools. Funnel analysis is a common tool. It is very suitable for businesses with multiple links connected in chronological order.
In real life, many businesses are connected in series. For example, e-commerce users may browse recommended items, compare prices, join shopping carts, place orders and evaluate; For another example, customers of training institutions may see advertising, consultation, trial courses, purchase, formal classes and renewal.
For this kind of business, we can count the number of people who touch each link and form a gradually decreasing "funnel", so that we can see the transformation of each link, locate the step in which the transformation is mainly stuck, and then supplement qualitative research for this step to determine the solution.
In this article, we will use Amazon Athena to write such a funnel analysis tool to convert a series of timing data (access logs) into the number of each link, and then convert the number into a decreasing funnel. In addition to showing the final effect, I will also show the whole design process to help readers adjust and design their own SQL statements.

📢 09.09-09.14 Amazon cloud technology China Summit online summit is in full swing! To learn more about the latest technology release and practical innovation of Amazon cloud technology, click the picture to sign up ~
Introduction to Amazon Athena
Amazon Athena is a data Lake query service. It allows users to query semi-structured data (JSON, CSV, Parquet, etc.) on Amazon S3 using SQL statements. In addition, it is a server free service, which means that users do not need to care about the underlying hardware resources and only charge according to the amount of scanned data. If they do not scan, there are no other idle charges.
Amazon Athena is based on presto. Users can use Presto's SQL syntax and some built-in functions to query.
-
Implementation based on Presto
https://docs.aws.amazon.com/athena/latest/ug/presto-functions.html
Introduction to funnel analysis
Next, let's look at funnel analysis.
In this paper, "funnel analysis" refers to counting the number of users who reach each key link of the business process, and analyzing the retention, conversion and jump out rate of each step to find the conversion bottleneck.
The funnel analysis contains the following inputs:
-
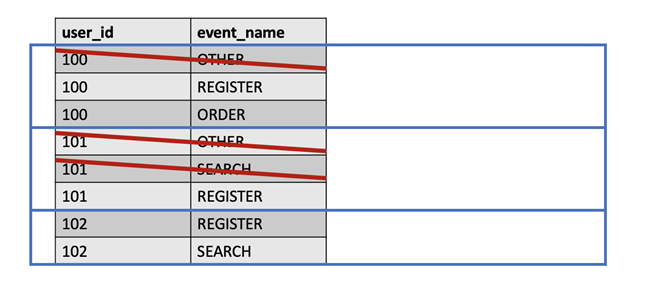
The path of events that analysts care about. For example, we care about "register, browse and place orders". Users must strictly follow this order to perform each link; For example, users can only execute "registration" and take one step, or execute "registration and browsing" and take two steps, but "registration, search and order" can only take one step, because "search" is not in the path we care about, thus interrupting the funnel.
-
The time interval of the funnel. For example, if it is set to 10 days, the links contained in the funnel must be completed within 10 days. If the user registers and browses on the first day, but orders are placed on the 20th day, then this can only be regarded as one step.
Funnel analysis has two outputs:
-
Funnel step count. For example, user A took one step, user B took three steps, user C took two steps, and so on.
-
FUNNEL_SUM. For example, 1000 people went to step 1, 300 people went to step 2, and 50 people went to step 3, etc.
Test data preparation
I prepared the test data in advance. The data structure is as follows:
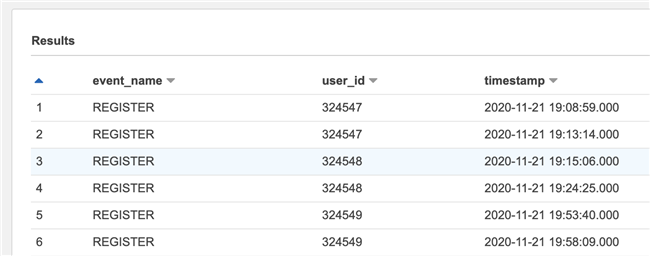
The data fields are as follows.
-
event_name is the event name, both in Chinese and English
-
user_id is the user name
-
Timestamp is a timestamp
The data is in JSON format. The Glue crawler is used to crawl and enter it as a data table. Readers can also create an external table by themselves. If you don't have ready-made data, you can also use generated ATA COM and other simulation data generation tools to generate simple test data.
Funnel statement design process
Next, let's look at how to design funnel analysis statements step by step.
Simple classification statistics
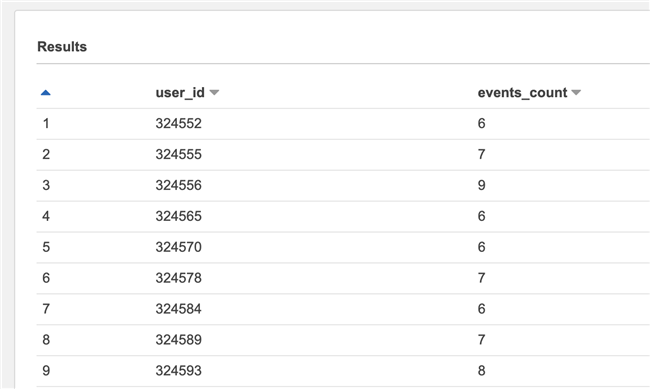
Let's count the steps first. First, calculate the number of events by user. This is a classified statistics operation. Since it is classified statistics, we may intuitively think of using the GROUP BY statement, such as:
SELECT user_id, COUNT(1) AS events_count
FROM events_table
GROUP BY user_id
This statement means to calculate how many events are triggered by each user. After the statement is executed, the result is as follows:
Limit time window
There is a problem here, that is, it will count all triggered events of the user, including events beyond the range of the event window set by us. Therefore, we need to filter again. For example, if the time interval we set is 5 days, events after 2020-11-23 in the following diagram must be filtered out.
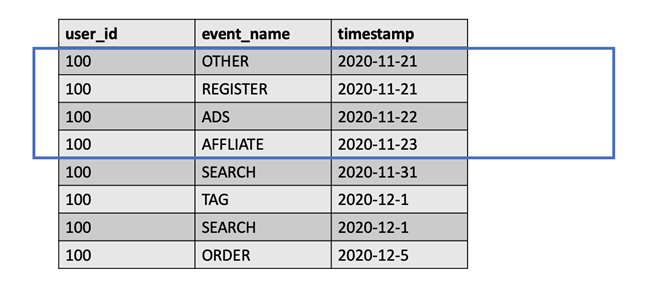
It should be noted that this requirement cannot be solved by simple conditional judgment, because the start time of the window needs to be determined according to the time when the user triggers the first event. For example, if user A triggers the first event on November 21, the window starts from November 21, while user B triggers the first event on December 1, and the window starts from December 1.
To do this, we need to use an intermediate table. This intermediate table only contains the user ID and the end time of the user's window, and then uses this table to connect the original event table, so that a simple conditional judgment can be used to filter out the data beyond the time window.
The middle table statement containing the end of the window is as follows:
SELECT user_id,
  DATE_ADD('second', 3600 * 24 * 5, MIN(timestamp)) AS max_span
FROM events_table
GROUP BY user_id
We first use GROUP BY to group the events of each user, then use the MIN() function to obtain the time of the first event of each user, and then use date_ The add() function adds 5 days to this time (assuming that the window is 5 days) to get the end time of each user's window.
Connect this table with a simple statistical table. The statement is as follows:
WITH max_spans_table AS
(
  SELECT user_id,
    DATE_ADD('second', 3600 * 24 * 5, MIN(timestamp)) AS max_span
  FROM events_table
  GROUP BY user_id
)
SELECT e.user_id, COUNT(1) AS event_count
FROM events_table e
JOIN max_spans_table m ON e.user_id = m.user_id
WHERE e.timestamp <= m.max_span
GROUP BY e.user_id
As you can see, this is a bit like traversing the first table and adding a max to the entry with the same user ID_ Span parameter, and then filter out rows less than or equal to this parameter.
Specify behavior path
But there are still problems. Although we filter out of window data, there is no way to specify event path. The funnel we care about may be "register, browse and place an order", but the user's behavior may be "search, browse and place an order". We also need to specify the behavior path.
It is not easy to judge the order of several data in SQL statements. Because SQL was originally used to manipulate and query collections, it is not order sensitive. However, fortunately, the event name is only a simple string, so we can adopt a clever method to splice all the events of the user in a certain time window into a long string, and then compare it with our expected path.
To splice fields from multiple pieces of data together, we need two functions. The first is ARRAY_AGG() is used to take a field value from multiple pieces of data to form an array. Then ARRAY_JOIN() is used to splice the strings in the array together.
Here, we assume that the path we care about is "register, ask customer service, join the shopping cart and place an order".
The statement at this time is as follows:
WITH max_spans_table AS
(
SELECT user_id,
DATE_ADD('second', 3600 * 24 * 5, MIN(timestamp)) AS max_span
FROM events_table
GROUP BY user_id
)
SELECT e.user_id, ARRAY_JOIN(ARRAY_AGG(e.event_name ORDER BY e.timestamp ASC), ',') AS event_seq, COUNT(1) AS event_count
FROM events_table e
JOIN max_spans_table m ON e.user_id = m.user_id
WHERE e.timestamp <= m.max_span
GROUP BY e.user_id
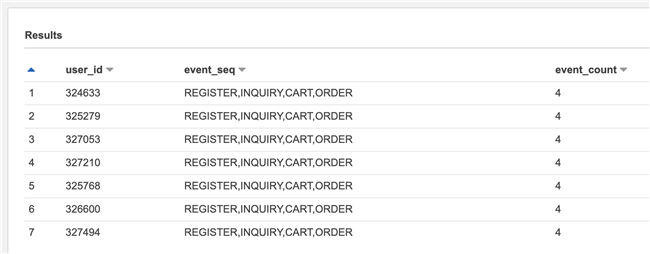
HAVING ARRAY_JOIN(ARRAY_AGG(e.event_name), ',') = 'REGISTER,INQUIRY,CART,ORDER'Note that although we use the alias event when selecting_ Seq, but the action of aliasing the column is executed in the result set after the query is completed, so you still need to repeat array in the HAVING statement_ Join() function. In addition, in array_ In the AGG () function, we also sort with the timestamp field to ensure that the event names are spliced in chronological order.
The query results are as follows:
Calculate the funnel path length of the user
The observation results show that there are only 7 users, while there are thousands of users in our test data set, which is obviously abnormal. The reason is that we can only find users who have completed all the paths by simply comparing the spliced string and the input behavior path.
For example, if the input we set is "A,B,C", then the user who triggered these three events in sequence will splice the "A,B,C" string to make the comparison successful. Users who only trigger A or A and B cannot match. In addition, if event A is not the first event, but in the middle ("D,A,B,C"), or another event ("A,B,C,D") is triggered after the target event path, simple matching cannot be compared.
At this point, we need to do two things:
-
Find the row where the first event (such as "A") in A user's behavior path is located, and filter out the row before it, otherwise the path in the middle or tail cannot be matched (to say the least, even if it can be matched, we cannot correctly calculate the window time)
-
Only the event paths that can start with "A", "A,B" and "A,B,C" are reserved. This is the target path we care about
At this time, we will touch the expressive ceiling of SQL language. It's easy to do these two things in a common programming language, because we can cycle many times, use temporary variables, and filter as needed. To achieve such filtering in SQL, we need a curve to save the country.
To achieve the first point, we need to put forward the events of each user separately and delete other events before the first event of our input behavior path. Take the following figure as an example. If the first step of the event path we are concerned about is "registration", the steps before "registration" should be deleted.
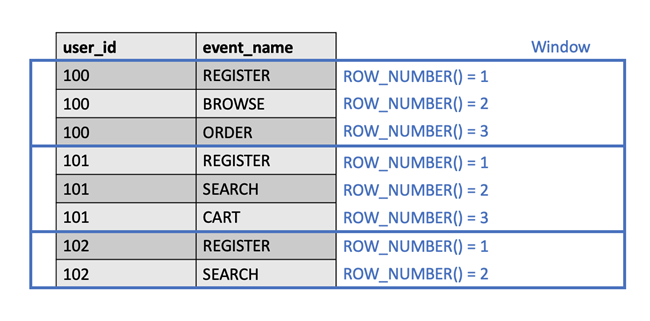
Fortunately, SQL provides the concept of "window function". We can make each user's event into a "window" and use row_ The number () function numbers each row of data in the window. Next, we need to find the line number of the first event and record it. Then, join the original table and filter out the rows whose number under the user is less than the number recorded by us. This is similar to the previous time window filtering.
Some statements of window functions are as follows:
SELECT *,
  ROW_NUMBER() OVER (PARTITION BY id ORDER BY timestamp ASC) AS row_number
FROM events_table
Using the OVER () statement, a "window" is formed. The window is divided by the fields indicated by PARTITION BY, and the data entries in the window can be sorted. This is a bit like the logic of GROUP BY, except that GROUP BY can only be used for statistics, while window functions can only attach line numbers without statistics.
The results are as follows:
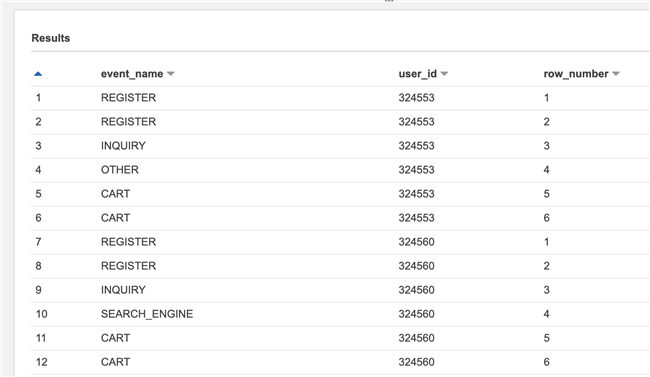
It can be seen that we have numbered each user's own events. In the follow-up, we only need to find the number of the events we are concerned about and filter them in parallel with the original table.
Filtering events has been achieved. To achieve the second point, multiple matching is relatively troublesome.
You may think of generic statements such as LIKE '%%', but it can only match the path that contains all the event steps, not the path that contains only some steps. If STRPOS() is used and the two parameters are reversed, then "A", "A,B", "A,B,C" and "A,B,C,D,E" can be matched, but "A,E,F,G" cannot be matched. In this way, the path starting with "A" is followed by other events.
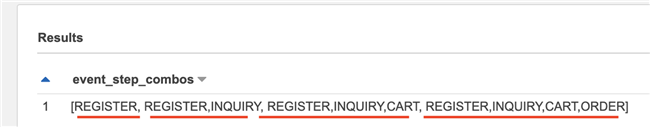
Fortunately, we also have the reduce () function, which can cycle through array data. Just split the behavior path string into an array, and then use the REDUCE() function to recursively attach the latter string to the previous result to obtain an array containing path subsets such as "A", "A,B", "A,B,C", so as to carry out multiple matching.
To do this, we need to get not only the string value in the array, but also the subscript corresponding to the value. If the subscript is 1, it indicates that it is the first element and remains intact. Otherwise, take out the current string, merge it with the string of the previous round, and add it to the output array. This is done with the IF() function.
The REDUCE() function itself does not provide subscript parameters, so we need to obtain the array length with the aid of the CARDINALITY() function, and then use the SEQUENCE() function to generate an array of sequential numbers as the subscript list. Traversing this array achieves the effect similar to the for loop or enumerate() of other languages.
The statements in this part are as follows:
SELECT REDUCE(
    SEQUENCE(1, CARDINALITY(event_steps)), ARRAY [],
    (s, i) ->
      IF(
        i > 1,
        s || (CAST(s[i-1] AS VARCHAR) || ',' || event_steps[i]),
        s || event_steps[i]),
    s -> s) AS event_step_combos
FROM (
  SELECT SPLIT('REGISTER,INQUIRY,CART,ORDER', ',') AS event_steps
)
Here, the CAST() function is used to set the array value as a string, and then the | operator is used to connect the strings.
The following is an example of the output of this round. Because the console output does not clearly indicate the string, I distinguish the output part with a red line. We can see that the output array contains four strings, which meets our requirements.
However, although we have such an array, we still need to match all event paths and record whether the matching is "A", "A,B" or "A,B,C", so that we can make subsequent statistics. To do this, we need to combine several functions.
First, the REDUCE() and SEQUENCE() functions are used to execute the loop operation. Finally, a number is output to represent which string is matched. Finally, IF() is used to determine whether it has been matched. If it has been matched, the original input will be maintained and nothing will be done. If it has not been matched, STRPOS() will be used for matching.
Because once the result is matched, there will be no matching, so we must first match the longest string. This requires us to use the REVERSE() function to reverse the string from long to short.
This leads to another problem, that is, because our input array is reversed, the resulting array subscript is also reversed. We must also reverse its subscript, that is, replace subscripts 1, 2, 3 and 4 with 4, 3, 2 and 1. Through analysis, we can know that the subscript order can be reversed by subtracting the subscript from the array length and adding 1, so we add this part.
Merge the previous codes together, and the codes are as follows:
WITH
-- Split input event path
params AS
(
  SELECT REVERSE(REDUCE(
      SEQUENCE(1, CARDINALITY(event_steps)), ARRAY [],
      (s, i) ->
        IF(
          i > 1,
          s || (CAST(s[i-1] AS VARCHAR) || ',' || event_steps[i]),
          s || event_steps[i]),
      s -> s)) AS event_step_combos
  FROM (
    SELECT SPLIT('REGISTER,INQUIRY,CART,ORDER', ',') AS event_steps
  )
),
-- The events triggered by each user are numbered separately
events_with_row_numbers_table AS
(
  SELECT *,
    ROW_NUMBER() OVER (PARTITION BY user_id ORDER BY timestamp ASC) AS row_number
  FROM events_table
),
-- Find the first event in the funnel triggered by the user and record the line number
events_starter_event_with_row_number AS (
  SELECT user_id, MAX(row_number) AS starter_event_row_number
  FROM events_with_row_numbers_table
  WHERE event_name = 'REGISTER'
  GROUP BY user_id
),
-- Filter out events before the first event in the funnel
events_trimmed_table AS (
  SELECT e.user_id, e.event_name, e.timestamp
  FROM events_with_row_numbers_table e
  JOIN events_starter_event_with_row_number er ON e.user_id = er.user_id
  WHERE e.row_number >= er.starter_event_row_number
),
-- Find end of time window
max_spans_table AS
(
  SELECT user_id,
    DATE_ADD('second', 3600 * 24 * 5, MIN(timestamp)) AS max_span
  FROM events_trimmed_table
  GROUP BY user_id
),
-- Combine the user's events into a string
events_seq_table AS
(
  SELECT e.user_id,
    ARRAY_JOIN(ARRAY_DISTINCT(ARRAY_AGG(e.event_name ORDER BY e.timestamp ASC)), ',') AS event_seq
  FROM events_trimmed_table e
  JOIN max_spans_table m ON e.user_id = m.user_id
  WHERE e.timestamp <= m.max_span
  GROUP BY e.user_id
)
-- Find out where the user stopped
SELECT e.user_id, e.event_seq, REDUCE(
  SEQUENCE(1, CARDINALITY(p.event_step_combos)),
  0,
  (s, i) -> IF(
    s > 0,
    s,
    IF(
      STRPOS(e.event_seq, p.event_step_combos[i]) = 1,
      CARDINALITY(p.event_step_combos)-i+1,
      0
    )
  ),
  s -> s
) AS funnel_step
FROM events_seq_table e
CROSS JOIN params p
It can be seen that the query statement has become very long because of the emergence of intermediate tables and the increase of functions. I added notes to help readers see the purpose of each intermediate table.
The results are as follows:
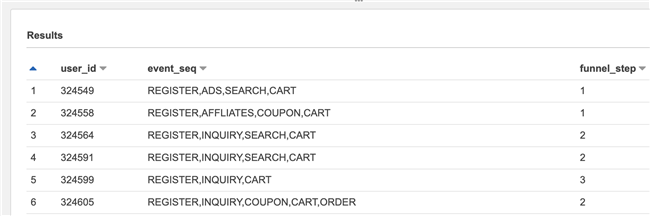
It can be seen that it can match several steps in the path, tunnel_ Step is a few. In this way, we get the event path length traveled by each user.
Funnel population statistics
Next, we count the number of people in each step.
We first calculate the number of users in each step, which is a simple statistic. This part of the code is as follows:
SELECT COUNT(1) AS funnel_step_count
FROM events_funnel_step_table
GROUP BY funnel_step
But the result of this statement is the individual number of people in each step, but what we need is not an individual number of people, but a funnel, so we hope to present interlocking statistics in the end. For example, 1000 people registered, 200 of them browsed, and 15 of them placed orders. This means that we need to add up the steps.
At this time, we need to use the window function. There is a special version of SUM() function in the window function. This version of SUM() function will change the original "sum" into "accumulation between windows", which meets our needs. At this time, we omit the PARTITION BY statement, which means that each record itself is a window, and sum () has become the meaning of "accumulate by record".
This part of the code is as follows:
SELECT
  SUM(funnel_step_count)
    OVER (ORDER BY funnel_step ASC)
    AS funnel_step_acc_sum
FROM events_funnel_step_count_table
We will find that this is the opposite of what we think. Because there are fewer and fewer funnels and more and more accumulation, we need to use a total number to gradually subtract the accumulated value.
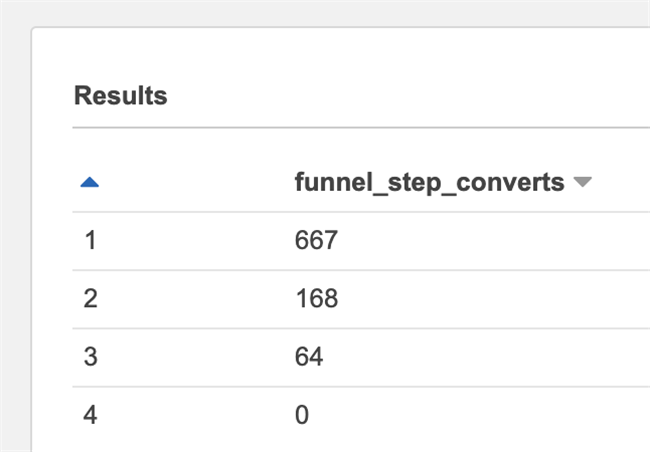
This part of the code is as follows:
SELECT (funnel_total_sum-funnel_step_acc_count) AS funnel_step_converts
FROM events_funnel_step_acc_count_table
CROSS JOIN (
  SELECT SUM(funnel_step_count) AS funnel_total_sum
  FROM events_funnel_step_count_table
)
Looking at the results again, we will find that the funnel at this time will eventually become 0. This is because our accumulation starts from 0 and eventually decreases to 0, and we actually want to reduce to the penultimate step and stop. In other words, we need to use the value of the line to subtract the cumulative value of the previous line.
For SQL, this means that a table joins itself, but staggers one row. It is expressed as follows:
SELECT e.funnel_step, (funnel_total_sum-e2.funnel_step_acc_count) AS funnel_step_converts
FROM events_funnel_step_acc_count_table e
LEFT JOIN events_funnel_step_acc_count_table e2 ON e.funnel_step = e2.funnel_step+1
CROSS JOIN (
  SELECT SUM(funnel_step_count) AS funnel_total_sum
  FROM events_funnel_step_count_table
)
The results are as follows.
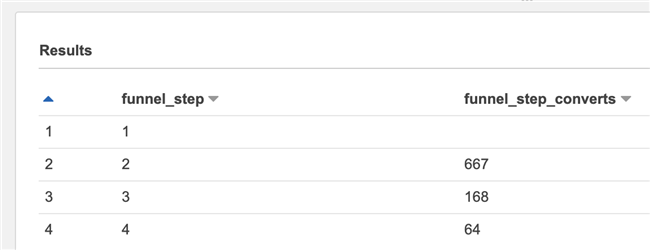
The observation results will find another problem, that is, the value of line 1 is empty. This is because when the left table is the first row, the previous row of the right table does not exist, so the result of the LEFT JOIN is NULL, and the result of the mathematical operation for NULL can only be NULL.
To solve this problem, we use the COALESCE() function. This function can help us set the default value. It returns the first non NULL value of its parameters. We set the default value to 0 so that we can calculate it normally.
Add the following statement:
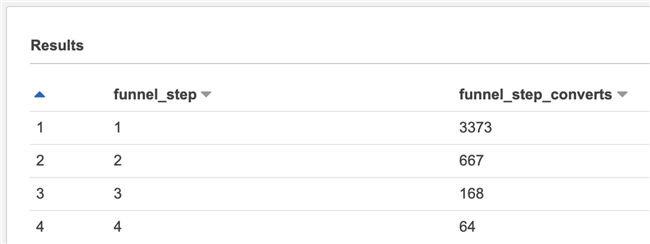
SELECT e.funnel_step, (funnel_total_sum-COALESCE(e2.funnel_step_acc_count, 0)) AS funnel_step_converts
FROM events_funnel_step_acc_count_table e
LEFT JOIN events_funnel_step_acc_count_table e2 ON e.funnel_step = e2.funnel_step+1
CROSS JOIN (
  SELECT SUM(funnel_step_count) AS funnel_total_sum
  FROM events_funnel_step_count_table
)
ORDER BY funnel_step ASC
The effects are as follows:
Parameter extraction
Now our goal has been achieved. The last problem left is that we need to manually insert our parameters multiple times in different statements. The best thing is that we can write the parameters to the first statement at one time, which is more convenient to use.
To do this, we use VALUES to create a temporary table with only one row for storing parameters, and then use AS to name the fields. When using, you only need to SELECT the required fields from this temporary table.
So far, we have written the funnel analysis statistics function with Amazon Athena's SQL. Because the underlying layer of Amazon Athena is based on Presto, this statement can also run on a compatible version of SQL Engine.
The final complete SQL statement is as follows:
WITH
-- Original parameters
input AS
(
  SELECT time_window, SPLIT(event_chain, ',') AS event_steps
  FROM (VALUES ('REGISTER,INQUIRY,CART,ORDER', 3600 * 24 * 5))
  AS input (event_chain, time_window)
),
-- Split input event path
params AS
(
  SELECT time_window, event_steps, REVERSE(
    REDUCE(
      SEQUENCE(1, CARDINALITY(event_steps)), ARRAY [],
      (s, i) ->
        IF(
          i > 1,
          s || (CAST(s[i-1] AS VARCHAR) || ',' || event_steps[i]),
          s || event_steps[i]),
      s -> s
    )
  ) AS event_step_combos
  FROM input
),
-- The events triggered by each user are numbered separately
events_with_row_numbers_table AS
(
  SELECT *,
    ROW_NUMBER() OVER (PARTITION BY user_id ORDER BY timestamp ASC) AS row_number
  FROM events_table
),
-- Find the first event in the funnel triggered by the user and record the line number
events_starter_event_with_row_number AS (
  SELECT user_id, MAX(row_number) AS starter_event_row_number
  FROM events_with_row_numbers_table
  WHERE event_name = (SELECT event_steps[1] FROM params)
  GROUP BY user_id
),
-- Filter out events before the first event in the funnel
events_trimmed_table AS (
  SELECT e.user_id, e.event_name, e.timestamp
  FROM events_with_row_numbers_table e
  JOIN events_starter_event_with_row_number er ON e.user_id = er.user_id
  WHERE e.row_number >= er.starter_event_row_number
),
-- Find end of time window
max_spans_table AS
(
  SELECT user_id,
    DATE_ADD('second', (SELECT time_window FROM params), MIN(timestamp)) AS max_span
  FROM events_trimmed_table
  GROUP BY user_id
),
-- Combine the user's events into a string
events_seq_table AS
(
  SELECT e.user_id,
    ARRAY_JOIN(ARRAY_DISTINCT(ARRAY_AGG(e.event_name ORDER BY e.timestamp ASC)), ',') AS event_seq
  FROM events_trimmed_table e
  JOIN max_spans_table m ON e.user_id = m.user_id
  WHERE e.timestamp <= m.max_span
  GROUP BY e.user_id
),
-- Calculate the event path length of each user
events_funnel_step_table AS
(
  SELECT e.user_id, e.event_seq, REDUCE(
    SEQUENCE(1, CARDINALITY(p.event_step_combos)),
    0,
    (s, i) -> IF(
      s > 0,
      s,
      IF(
        STRPOS(e.event_seq, p.event_step_combos[i]) = 1,
        CARDINALITY(p.event_step_combos)-i+1,
        0
      )
    ),
    s -> s
  ) AS funnel_step
  FROM events_seq_table e
  CROSS JOIN params p
),
-- Calculate the number of people who have completed different event path lengths
events_funnel_step_count_table AS
(
  SELECT funnel_step, COUNT(1) AS funnel_step_count
  FROM events_funnel_step_table
  GROUP BY funnel_step
),
-- The number of people per step on the event path is accumulated sequentially
events_funnel_step_acc_count_table AS
(
  SELECT funnel_step, SUM(funnel_step_count) OVER (ORDER BY funnel_step ASC) AS funnel_step_acc_count
  FROM events_funnel_step_count_table
),
-- Add a common alias to the user event path length statistics
funnel_count AS (
  SELECT * FROM events_funnel_step_count_table
),
-- Turn the accumulation into a wrong line and subtract to obtain the step transformation
funnel_sum AS (
  SELECT e.funnel_step, (funnel_total_sum-COALESCE(e2.funnel_step_acc_count, 0)) AS funnel_step_converts
  FROM events_funnel_step_acc_count_table e
  LEFT JOIN events_funnel_step_acc_count_table e2 ON e.funnel_step = e2.funnel_step+1
  CROSS JOIN (
    SELECT MAX(funnel_step_acc_count) AS funnel_total_sum
    FROM events_funnel_step_acc_count_table
  )
  ORDER BY funnel_step ASC
)
SELECT *
FROM funnel_sum
Each intermediate table can be selected separately for debugging and optimization. The last funnel_count and fund_ Sum table can be used for funnel analysis
More thinking
Although the purpose is achieved by using SQL, there is still room for improvement in this scheme. For example:
-
When an event is repeated, such as "A,A,B,B,C,C", how should it be handled and judged?
-
What should be done when the funnel repeats, such as "A,B,C,A,B,C"?
-
If other steps, such as "A,B,X,C", are allowed to be inserted in the middle, what should be done?
-
How to handle and prompt if the parameter is entered incorrectly?
There are no standard answers to these questions. Some problems may be solved in SQL, some problems may be left to the early ETL process, and some may need special application logic to judge. Readers can solve the problem according to the actual situation.
In addition, funnel analysis usually needs to scan the data multiple times to ensure that the data occurs consistently and in the same time interval, which will directly affect the amount of scanned data and the execution efficiency of statements. Readers can also modify, adjust and optimize the original data and sentence itself according to their own needs to improve the overall execution efficiency.
Finally, it is worth mentioning that from the results, we can see that although we have written such a function, its readability is not strong. For example, the nesting of IF() functions and the way of REDUCE() + SEQUENCE() + CARDINALITY() to represent simple for loops are dazzling. The intention of using single row table and CROSS JOIN to pass parameters is not very clear.
Admittedly, for daily and solidified analysis tasks, we can often convert data into more convenient statistical methods through ETL. This can not only better read and maintain, but also improve the efficiency of analysis.
However, the author believes that SQL, as a relatively simple language, can still greatly improve efficiency during the business combing and design period by its functions of rapid trial and error and exploration. In the era of data lake, the structure of data changes rapidly and there is more space to explore. Mastering SQL is more important.
summary
This paper introduces how to use Amazon Athena for funnel analysis, and focuses on the complete thinking process and the SQL syntax and functions used in the middle. I hope it can help readers explore the data lake more efficiently.
Author of this article

Dai Zhang
Amazon cloud technology solution architect
More than ten years of experience in enterprise software R & D, design and consulting, focusing on the organic combination of enterprise business and Amazon cloud technology services. Translated into "the way of software", "lean entrepreneurship practice", "lean design", "Internet thinking enterprise", and written books such as "white book of experience design".
