Official website address:
G6 is a graph visualization engine
1, Use NPM package to import in the project
Step 1: use the command line to execute the following commands in the project directory:
npm install --save @antv/g6
Step 2: import in the vue file of G6 to be used:
import G6 from '@antv/g6';
2, Draw case
Step 1 create container
You need to create a container in HTML to hold the graph drawn by G6, usually a div tag. When drawing, G6 will add a canvas label under the container, and then draw the figure in it.
// Mount node
<template>
  <div id="mountNode"></div>
</template>
Step 2 data preparation
The data source introduced into G6 is an object in JSON format. The object needs to have nodes and edges fields, which are respectively represented by arrays:
// options/index.ts
const data = {
    // Node set
    nodes: [
        {
            id: 'node1', // Unique identification of the node
            x: 100, // Node abscissa
            y: 200, // Node ordinate
            label: 'starting point', // Node text
            size: 50, // Node size
            type: 'circle', //Specify the node type, built-in node type name or custom node name. The default is' circle '
            // Specifies the position of the connection point of the edge connection node (relative to the node), which can be empty.
            // For example: [0, 0] represents the anchor point in the upper left corner of the node, [1, 1] represents the anchor point in the lower right corner of the node
            anchorPoints: [],
            //Style properties for nodes
            style: {
                fill: '#00FFFF ', / / node fill color
                stroke: '#FFFF00 ', / / stroke color of node
                lineWidth: 5,       // Stroke Width
                // ...  Other properties
            },
            //	Text configuration item
            labelCfg: {
                position: 'bottom', // The position of the text relative to the node
                offset: 10, // Offset of text
                style: {    // Style properties for labels.
                  fill: 'red', // text color
                },
              },
        },
        {
            id: 'node2',
            x: 300,
            y: 200,
            label: 'Target point',
        },
    ],
    // Edge set
    edges: [
        // Represents an edge connected from node1 node to node2 node
        {
            source: 'node1', // Starting point id
            target: 'node2', // Target point id
            label: 'I'm wired', // Edge text
            style: {
                stroke: '#000000',
                lineWidth: 5,
                // ...  Other style properties
              },
        },
    ],
};

export default data
Step 3 Diagram instantiation
When instantiating a graph, at least set the container, width and height for the graph:
<script>
  const graph = new G6.Graph({
    container: 'mountNode', // Specify mount container
    width: 800, // Width of graph
    height: 500, // Height of graph
  });
</script>
Step 4 rendering of Graphs
Data loading and graph rendering are two steps, which can be carried out separately.
<script>
  graph.data(data); // Load data
  graph.render(); // Render
</script>
Step 5 draw results
Call graph After the render () method, the G6 engine will draw the graph according to the loaded data. The results are as follows:

Complete vue file
<template>
  <div id="mountNode"></div>
</template>

<script setup lang="ts">
import { defineComponent, onMounted } from 'vue'
import G6, { GraphData, TreeGraphData } from "@antv/g6";

import data from './options/index'

onMounted(() => {
  g6(data)
})

const g6 = (data: GraphData | TreeGraphData | undefined) => {
  // For graph instantiation, at least the mounting container, width and height need to be set for the graph
  const graph = new G6.Graph({
    container: 'mountNode', // Specify mount container
    width: 800, // Width of graph
    height: 500, // Height of graph
    // Default node set
    defaultNode: {
      shape: "circle",
      size: [100],
      color: "#5B8FF9",
      style: {
        fill: "#9EC9FF",
        lineWidth: 3
      },
      labelCfg: {
        style: {
          fill: "#fff",
          fontSize: 20
        }
      }
    },
    // Default edge set
    defaultEdge: {
      style: {
        stroke: "#e2e2e2"
      }
    }
  });
  // Data loading and rendering of Graphs
  graph.data(data);
  graph.render();
}


</script>

<style lang="scss" scoped>
</style>
3, Real data loading
In the above, we used the data with only two nodes and one edge, and directly put the data definition in the code. The data of the real scene is usually loaded by the request of the remote interface. For convenience, we have prepared a JSON data file for readers at the following address:
https://gw.alipayobjects.com/os/basement_prod/6cae02ab-4c29-44b2-b1fd-4005688febcb.json
Load remote data
Load the remote data source asynchronously through the fetch function and transfer it to the graph instance of G6:
The fetch function allows us to initiate network requests and load data, and its asynchronous process can be more reasonably controlled through async/await.
// options/index.ts
const response = await fetch(
    'https://gw.alipayobjects.com/os/basement_prod/6cae02ab-4c29-44b2-b1fd-4005688febcb.json',
);
const data = await response.json();

export { data }
After running, we get the following results:
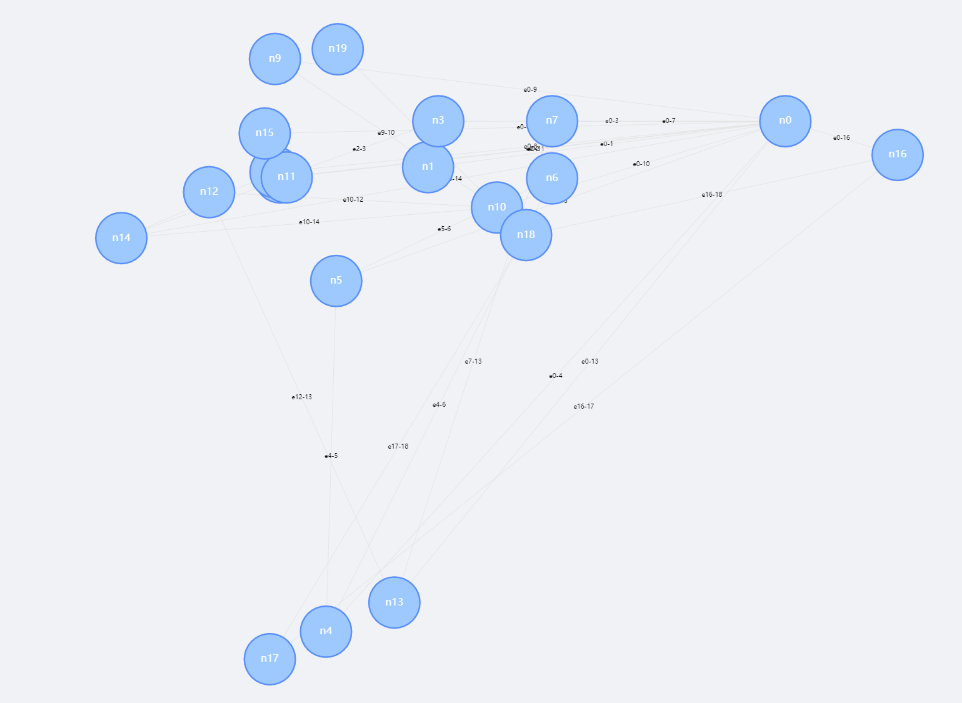
This case comes from the official website and is only implemented in vue3 with slight modification