catalogue
1. Add a legend on the current coordinate area
2. Add a legend on a specific coordinate area
3. Specify the legend label during the execution of the drawing command
4. Legend position and number of columns
5. Display shared legend in block diagram layout
6. Include some graphic objects in the legend
9. Modify the legend appearance
The legend function adds a legend to the coordinate area.
grammar
legend
legend(label1,...,labelN)
legend(labels)
legend(subset,___)
legend(target,___)
legend(___,'Location',lcn)
legend(___,'Orientation',ornt)
legend(___,Name,Value)
legend(bkgd)
lgd = legend(___)
legend(vsbl)
legend('off')
explain
Legend} creates a legend with descriptive labels for each plotted data sequence. For labels, the legend uses the text in the {DisplayName} property of the data sequence. If the 'DisplayName' property is empty, the legend uses a label in the form of 'dataN'. When a data sequence is added or deleted on the coordinate area, the illustration is automatically updated. This command creates a legend for the current coordinate area or drawing returned by gca{. If the current coordinate area is empty, the legend is empty. If the coordinate area does not exist, this command creates the coordinate area.
legend(label1,...labelN) sets the legend label. Specify the label as a character vector or a list of strings, such as' legend('Jan','Feb','Mar ').
legend(labels) uses character vector cell array, string array or character matrix to set labels, such as "Legend ({Jan ',' Feb ',' Mar '}).
legend(subset,___) Include only the items of the data sequence listed in {subset} in the legend. Subset is specified as a graph object vector. You can specify} subset before specifying the label or without specifying other input parameters.
legend(target,___) Use the coordinate area or graph specified by target instead of the current coordinate area or graph. Specify target as the first input parameter.
Legend ('location ', LCN) sets the legend position. For example, 'Location','northeast' will place a legend in the upper right corner of the coordinate area. Please specify the location after other input parameters.
Legend (__,'orientation ', ornt) (where' ornt 'is' horizontal') displays legend items side by side. The default value of ornt is' vertical ', which means that legend items are stacked vertically.
Legend (_, name, value) sets legend properties using one or more name value pair group parameters.
legend(bkgd) (where bkgd is' boxoff ') deletes the legend background and outline. The default value of bkgd , is' boxon ', which displays the legend background and outline.
lgd = legend(___) Returns the {legend} object. You can use {LGD} to query and set legend properties after creating a legend. For a list of attributes, refer to the legend attribute.
legend(vsb1) controls the visibility of the legend, where vsbl is' hide ',' show ', or' toggle '.
legend('off ') deletes the legend.
example
1. Add a legend on the current coordinate area
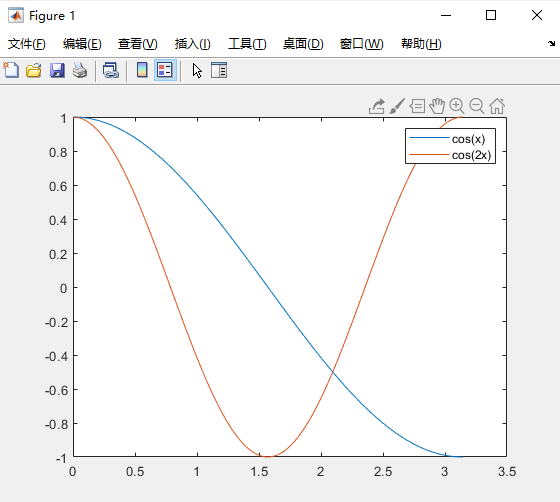
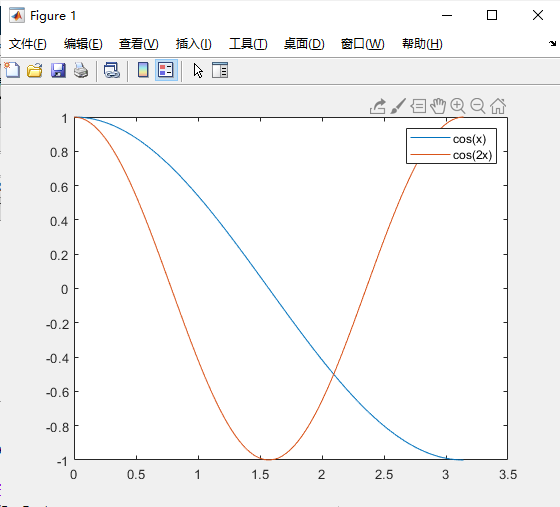
Draw two lines and add a legend to the current coordinate area. Specify the legend label as the input parameter to the legend function.
x = linspace(0,pi);
y1 = cos(x);
plot(x,y1)

hold on
y2 = cos(2*x);
plot(x,y2)

legend('cos(x)','cos(2x)')
As shown in the figure:
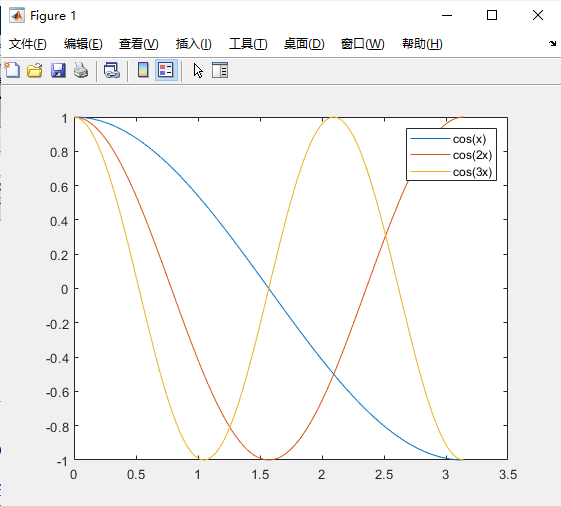
If you add or delete a data sequence in the coordinate area, the illustration updates accordingly. When creating a data sequence, you can control the label of the new data sequence by setting the DisplayName property to a name value pair group. If no label is specified, the legend uses a label in the form of 'dataN'.
Note: if you do not want to automatically update the legend when adding or deleting data sequences in the coordinate area, set the 'AutoUpdate' property of the legend to 'off'.
x = linspace(0,pi);
y1 = cos(x);
plot(x,y1)

hold on
y2 = cos(2*x);
plot(x,y2)

legend('cos(x)','cos(2x)')


y3 = cos(3*x);
plot(x,y3,'DisplayName','cos(3x)')
hold off
As shown in the figure:
Delete the legend. As shown in the figure:
legend('off')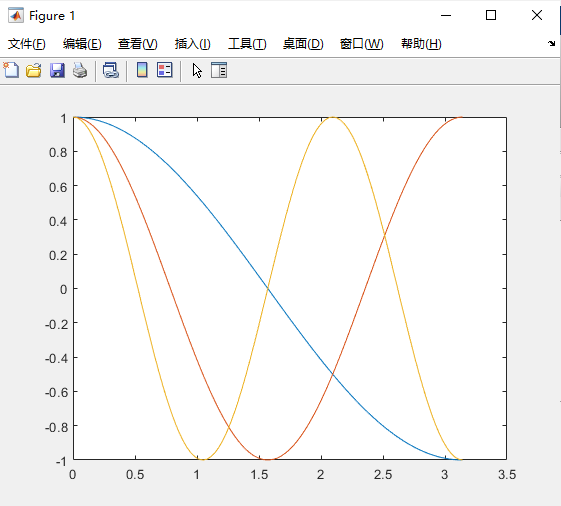
2. Add a legend on a specific coordinate area
Starting with R2019b, tiledlayout and nexttile functions can be used to display block diagrams. Call the tiledlayout function to create a 2 × 1 block diagram layout. Call the nexttile function to create the coordinate area objects ax1 and ax2. Random data is plotted in each coordinate area. Add a legend in the upper plot by specifying ax1 as the first input parameter to the} legend.
tiledlayout(2,1)
y1 = rand(3);
ax1 = nexttile;
plot(y1)

y2 = rand(5);
ax2 = nexttile;
plot(y2)

legend(ax1,{'Line 1','Line 2','Line 3'})
3. Specify the legend label during the execution of the drawing command
Draw two lines. Specify the legend label during the execution of the drawing command by setting the display name property to the desired text. Then, add a legend.
x = linspace(0,pi);
y1 = cos(x);
plot(x,y1,'DisplayName','cos(x)')

hold on
y2 = cos(2*x);
plot(x,y2,'DisplayName','cos(2x)')
hold off

legend
As shown in the figure:
4. Legend position and number of columns
Draw four lines. Create a legend in the northwest corner of the coordinate area. Use the NumColumns property to specify the number of columns in the legend.
x = linspace(0,pi);
y1 = cos(x);
plot(x,y1)

hold on
y2 = cos(2*x);
plot(x,y2)

y3 = cos(3*x);
plot(x,y3)

y4 = cos(4*x);
plot(x,y4)
hold off

legend({'cos(x)','cos(2x)','cos(3x)','cos(4x)'},'Location','northwest','NumColumns',2)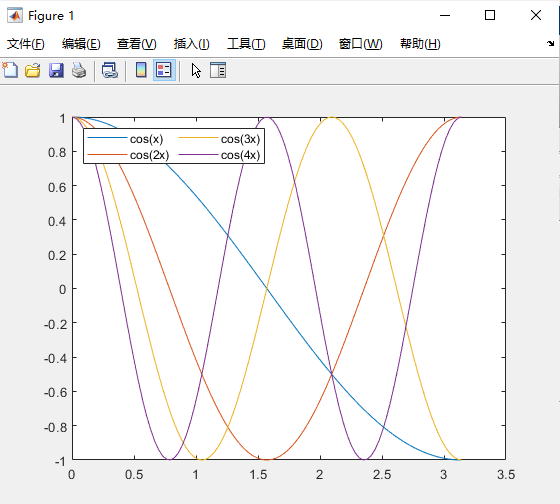
By default, legend items are arranged column by column from top to bottom. To arrange legend items row by row from left to right, set the Orientation property to 'horizontal'.
5. Display shared legend in block diagram layout
When you want to share a legend between two or more diagrams, you can display the legend in a separate block of the layout.
Create three drawings in a block diagram layout.
tiledlayout(2,2);
nexttile
plot(rand(5))
nexttile
plot(rand(5))
nexttile
plot(rand(5))
Add a shared legend and move it to the fourth block.
tiledlayout(2,2);
nexttile
plot(rand(5))
nexttile
plot(rand(5))
nexttile
plot(rand(5))

lgd = legend;
lgd.Layout.Tile = 4;
6. Include some graphic objects in the legend
If you do not want to include all drawing objects drawn in the legend, you can specify which drawing objects to include.
Draw three lines and return the created Line object. Create a legend that contains only two of these lines. Specify the first input parameter as the vector of the Line object to include.
x = linspace(0,pi);
y1 = cos(x);
p1 = plot(x,y1);

hold on
y2 = cos(2*x);
p2 = plot(x,y2);

y3 = cos(3*x);
p3 = plot(x,y3);
hold off

legend([p1 p3],{'First','Third'})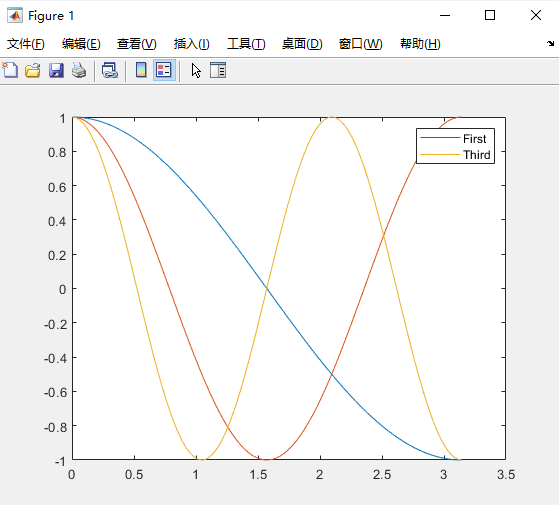
7. Add a title to the legend
Draw two lines and create a legend. Then add a title to the legend.
x = linspace(0,pi);
y1 = cos(x);
plot(x,y1)

hold on
y2 = cos(2*x);
plot(x,y2)
hold off

lgd = legend('cos(x)','cos(2x)');
title(lgd,'My Legend Title')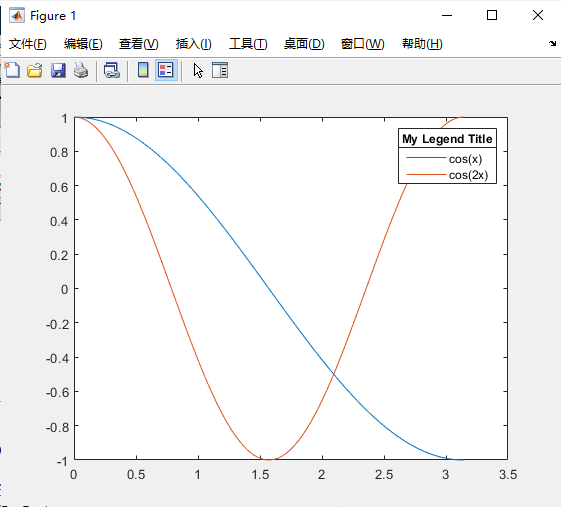
8. Delete legend background
Draw two lines and create a legend in the lower left corner of the coordinate area. Then, delete the background and outline of the legend.
x = linspace(0,pi);
y1 = cos(x);
plot(x,y1)

hold on
y2 = cos(2*x);
plot(x,y2)
hold off

legend({'cos(x)','cos(2x)'},'Location','southwest')
legend('boxoff')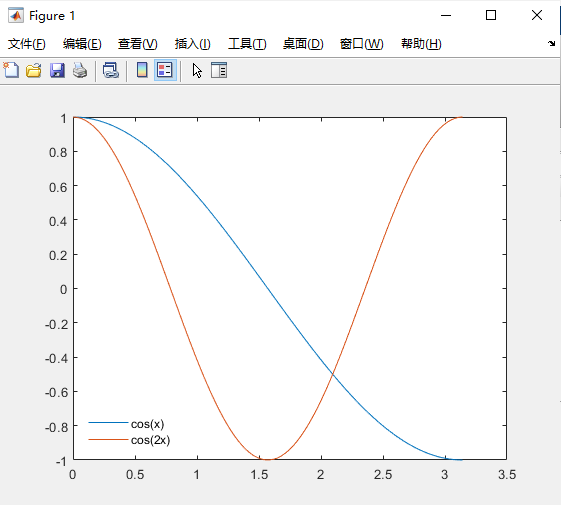
9. Modify the legend appearance
Modify the legend appearance by setting the legend property. When you create a legend, you can set properties using a name value pair group in the legend command. You can also use the legend object to set properties after creating the legend.
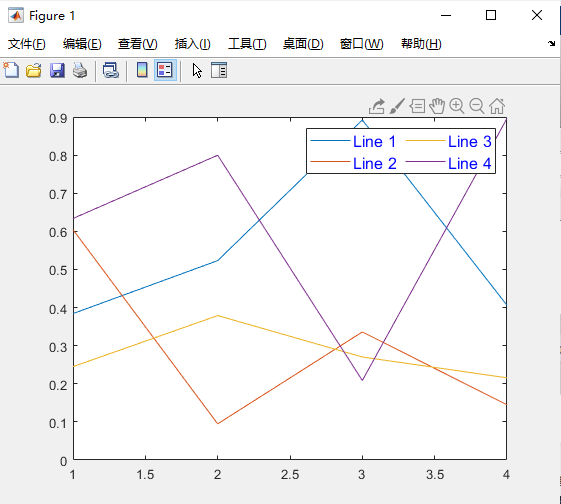
Draw four rows of random data. Create a Legend and assign the Legend object to the variable lgd. Set the "FontSize" and "TextColor" properties on the group with name value.
rdm = rand(4);
plot(rdm)

lgd = legend({'Line 1','Line 2','Line 3','Line 4'},'FontSize',12,'TextColor','blue')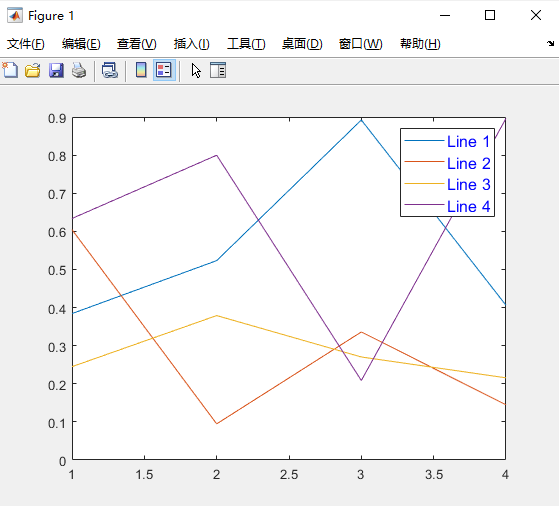
lgd =
  Legend (Line 1, Line 2, Line 3, Line 4) with properties:

         String: {'Line 1'  'Line 2'  'Line 3'  'Line 4'}
       Location: 'northeast'
    Orientation: 'vertical'
       FontSize: 12
       Position: [0.7088 0.7034 0.1778 0.1957]
          Units: 'normalized'

  Show all properties
After creating the legend, modify the legend by referencing lgd. Set the NumColumns property using the object dot property name representation.
lgd.NumColumns = 2;