
Preface
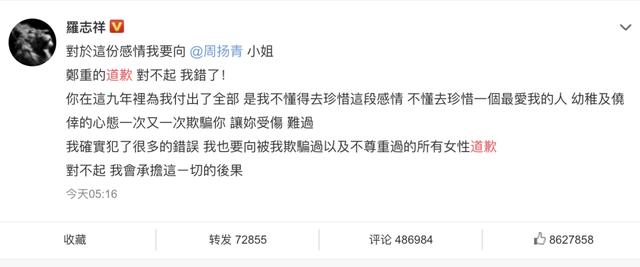
Recently, the entertainment industry can be said to be bustling. Before, there was a bully president who loved Xiao San, the palace was torn and forced to be a red girl in the net, and after that, there was a sunny boy named Show Luo, who was robbed of his reputation by Zhou Yangqing. It's hard for ordinary people to understand the love story of Guiquan. As Jia Xuming and Zhang Kang said in this cross talk, the love in entertainment circle is always on and off, which makes it a conversation resource for ordinary people. People outside the city want to go in, and people in the city can really play.

Various versions of wash white, rumors flying everywhere, eat melon netizens are how to look at it?
Speaking with data is the meaning of data workers. The whole process of data analysis is divided into three steps:
- Data acquisition
- Data preprocessing
- Data visualization and data analysis
The following are the specific steps and code implementation:
Data acquisition
Data acquisition address:
'http://ent.163.com/20/0423/09/FASTLQ7I00038FO9.html'
Before crawling the comment data, we need to press F12 to analyze the comment data web page. It can be found that there are 172 pages in total. The offset starts from 0, and each additional page offset increases by 30, which can be obtained by get method.
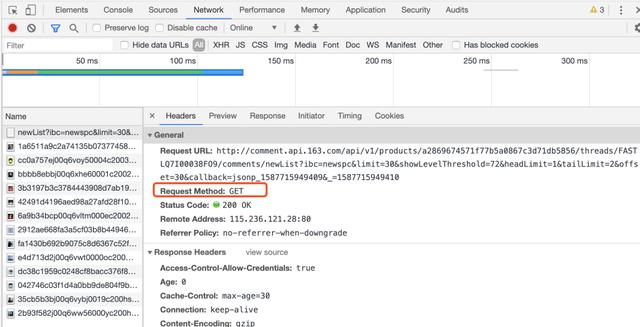
Core code:
headers = {'user-agent': 'Mozilla/5.0 (Windows NT 10.0; WOW64) AppleWebKit/537.36 (KHTML, like Gecko) Chrome/80.0.3987.106 Safari/537.36'}
# Comment address
url="http://comment.api.163.com/api/v1/products/a2869674571f77b5a0867c3d71db5856/threads/FASTLQ7I00038FO9/comments/newList?ibc=newspc&limit=30&showLevelThreshold=72&headLimit=1&tailLimit=2&offset={}"
# Cyclic crawling
df = pd.DataFrame(None)
i = 0
while True:
    ret = requests.get(url.format(str(i*30)), headers=headers)
    text = ret.text
    result = json.loads(text)
    t = result['comments'].values()
    s = json_normalize(t)
    i += 1
    if len(s) == 0:
        print("End of crawling")
        break
    else:
        df = df.append(s)
        print("The first{}Page crawl completed".format(i))

df.to_csv('data.csv')
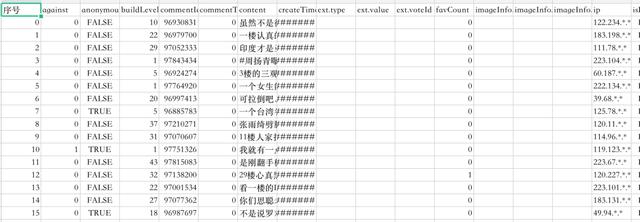
Data display
Data preprocessing
Data preprocessing is a very important part before data visualization. Including data reading, comment de duplication, data format conversion, etc
import pandas as pd
#data fetch
df = pd.read_csv('data.csv')
# Comment de duplication
df=df.drop_duplicates('commentId').reset_index(drop=True)
#format conversion
df['new_time'] = df.apply(lambda x : x['createTime'].split(':',1)[0],axis=1)
Data analysis and visualization
1. Event concern index
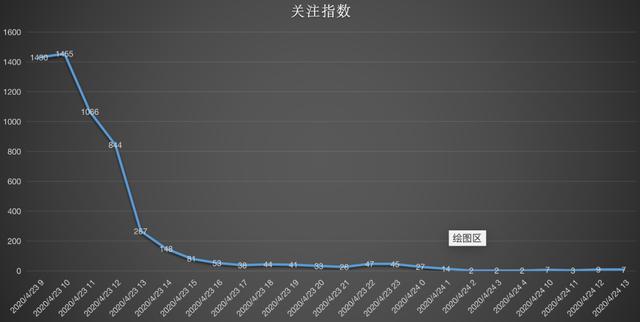
The push time from Zhou Yangqing's microblog, headlines and other platforms is 9:00 on April 23, which is accurate enough to show that there has been a period of preparation for the divorce declaration, which is not impulsive. From the point of view of the content sent, the statement started with a bit of teasing, the knife saw blood behind it, and the writing was also polished a lot. After the incident, according to the attention index, the review index reached a peak at 10 points on the 23rd, and then the review gradually decreased.
2. Analysis of netizens' comments
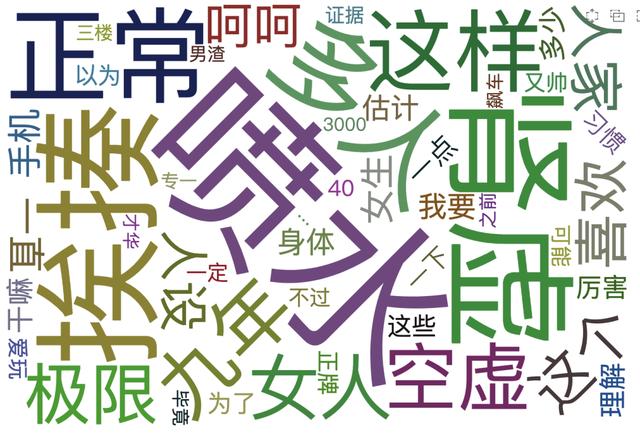
From the cloud map of Ci, we can see that many people fought against injustice for Zhou Yangqing, followed him for nine years, and finally made such an end. Across the screen, you can feel the public's anger at Luo Zhixiang's character, and of course, you can also watch the sound of melon eaters. Artists are public figures. Every word and deed will have a profound impact on the society, especially the youth groups. Character is not only the character under the camera, but also the character in life. "Starting from beauty, falling into talent and being loyal to human character" is the public's praise for Hu Ge, and also the expectation of the common people for literary and art workers. This is where Luo Zhixiang wants to correct.
Core code
import jieba.analyse
import os
from pyecharts.charts import WordCloud
from pyecharts.globals import SymbolType, ThemeType
from pyecharts.charts import Page
from pyecharts import options as opts
def get_comment_word(df):
    # Collective storage-Duplicate removal
    stop_words = set()
    print(stop_words)

    # Load stop words
    cwd = os.getcwd()
    stop_words_path = cwd + '/stop_words.txt'
    print(stop_words_path)

    with open(stop_words_path, 'r', encoding="ISO-8859-1") as sw:
        for line in sw.readlines():
            stop_words.add(line.strip())
    print(stop_words)

    # Merge comment information
    df_comment_all = df['content'].str.cat()

    # Use TF-IDF Algorithm extraction keywords
    word_num = jieba.analyse.extract_tags(df_comment_all, topK=300, withWeight=True, allowPOS=())
    print(word_num)
    # One step filtering
    word_num_selected = []

    # Filter out stop words
    for i in word_num:
        if i[0] not in stop_words:
            word_num_selected.append(i)
        else:
            pass

    return word_num_selected
3. Where do the message loving melon eaters come from
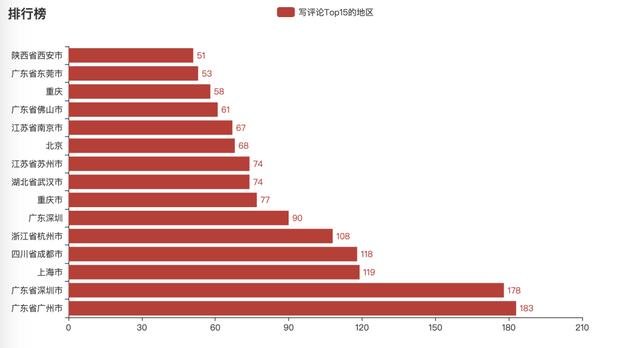
From the above chart, we can see that the netizens of Guangzhou, Shenzhen and Shanghai rank in the top three in terms of message. The people who like to comment are basically in the first tier cities and quasi first tier cities. On the one hand, due to the large population, on the other hand, the information flow in these cities is relatively fast.
Core code
from snapshot_selenium import snapshot as driver
from pyecharts import options as opts
from pyecharts.charts import Bar
from pyecharts.render import make_snapshot
df = df.groupby(['user.location']).agg({'Serial number':'count'}).reset_index()
df.rename(columns={'place':'user.location'}, inplace=True)
df = df[~df['user.location'].isin(['Shanghai','China','From Mars','Mars'])]
df = df.sort_values(['Serial number'],axis = 0,ascending = False)
df_gb_top = df[:15]

def bar_chart() -> Bar:
    c = (
        Bar()
        .add_xaxis(list(df_gb_top['user.location']))
        .add_yaxis("Write a comment Top15 Regions of", list(df_gb_top['Serial number']))
        .reversal_axis()
        .set_series_opts(label_opts=opts.LabelOpts(position="right"))
        .set_global_opts(title_opts=opts.TitleOpts(title="Ranking List"))
    )
    return c
If you want to learn Python or are learning python, there are many Python tutorials, but are they up to date? Maybe you have learned something that someone else probably learned two years ago. Share a wave of the latest Python tutorials in 2020 in this editor. Access to the way, private letter small "information", you can get free Oh!