hyptop command
This command belongs to zlinux tools. Redhat 6 for z comes with this command.
As long as there is a linux Lpar on the mainframe, you can use this command to see the CPU usage of all lpars.
hyptop
The following command can be used to output the real-time CPU usage of each LPAR of the large machine with 1 second interval:
[root@FCBDC01 ~]# hyptop -b -d 1 -n 1
10:57:56 CPU-T: IFL(8) CP(0) UN(0) ?=help
system #cpu    cpu  mgm     Cpu+   Mgm+     online
(str)   (#)    (%)  (%)     (hm)   (hm)      (dhm)
RFIDB     8 208.46 0.25  2500:22  13:21  132:23:11
RD        8 201.85 0.76 15855:51  60:46  291:20:23
WEBINT    8   3.22 0.29 48831:34 654:16 2115:15:18
TSM       8   0.76 0.03  3292:03 250:51  737:17:27
JTFXB     8   0.37 0.01    45:42   0:34  151:12:14
JTFXP     0   0.00 0.00     0:00   0:00    0:00:00
RFIDP     0   0.00 0.00     0:00   0:00    0:00:00
         40 414.64 1.34 70525:34 979:50 2115:15:18
The first column is the Lpar name, the second column is the number of CPU cores owned by each partition, and the third column is the CPU utilization.
zabbix monitoring large LPAR CPU utilization
- Use the hyptop command to collect CPU utilization data in LPAR Linux;
- Use grep and awk to filter out the CPU utilization of each partition;
- Add monitoring items to the zabbix client configuration file zabbix [agentd. Conf;
- zabbix web management terminal adds monitoring items.
1. Collect CPU utilization of each partition;
Set timing task, collect CPU data every 1 minute and write it to temporary text
crontab -e

* * * * * * /usr/sbin/hyptop -b -d 1 -n 1 > /tmp/hyptop.txt     #1Once per minute
2. Filter CPU utilization of each partition
Set script to filter CPU usage of each LPAR
[root@FCBDC01 sbin]# cat lpar_cpu.sh
#!/bin/bash
cat /tmp/hyptop.txt |grep $1|awk {'printf "%.2f\n", $3/8'}
The execution effect is as follows: (RD parameter is the partition name)
[root@FCBDC01 sbin]# sh lpar_cpu.sh RD
25.72
3. Add monitoring items to the zabbix client configuration file;
vi /opt/zabbix_agent/etc/zabbix_agentd.conf


UserParameter=custom.lpar.cpu.rd[*],sh /opt/zabbix_agent/sbin/lpar_cpu.sh RD
UserParameter=custom.lpar.cpu.fcbdc01[*],sh /opt/zabbix_agent/sbin/lpar_cpu.sh RFIDB
UserParameter=custom.lpar.cpu.fcbdc04[*],sh /opt/zabbix_agent/sbin/lpar_cpu.sh JTFXB
UserParameter=custom.lpar.cpu.tsm[*],sh /opt/zabbix_agent/sbin/lpar_cpu.sh TSM
UserParameter=custom.lpar.cpu.webint[*],sh /opt/zabbix_agent/sbin/lpar_cpu.sh WEBINT
UserParameter=custom.lpar.cpu.rfidp[*],sh /opt/zabbix_agent/sbin/lpar_cpu.sh RFIDP
UserParameter=custom.lpar.cpu.jtfxp[*],sh /opt/zabbix_agent/sbin/lpar_cpu.sh JTFXP
Restart zabbix client service
serivce zabbix_agentd restart
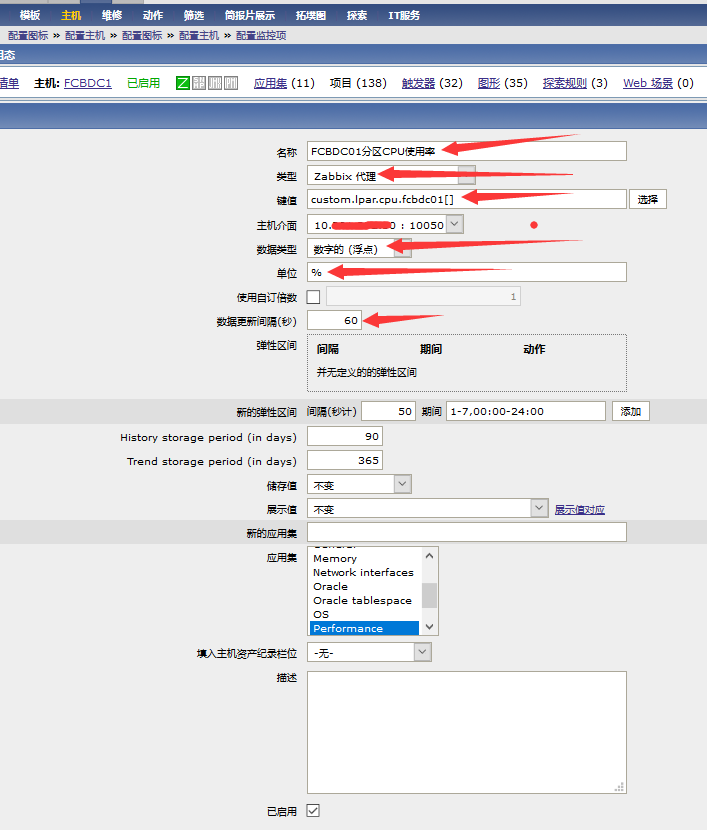
4. zabbix website management adds monitoring items
New monitor item
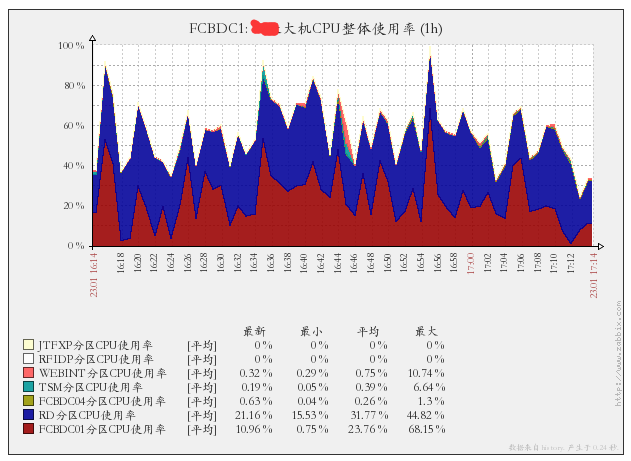
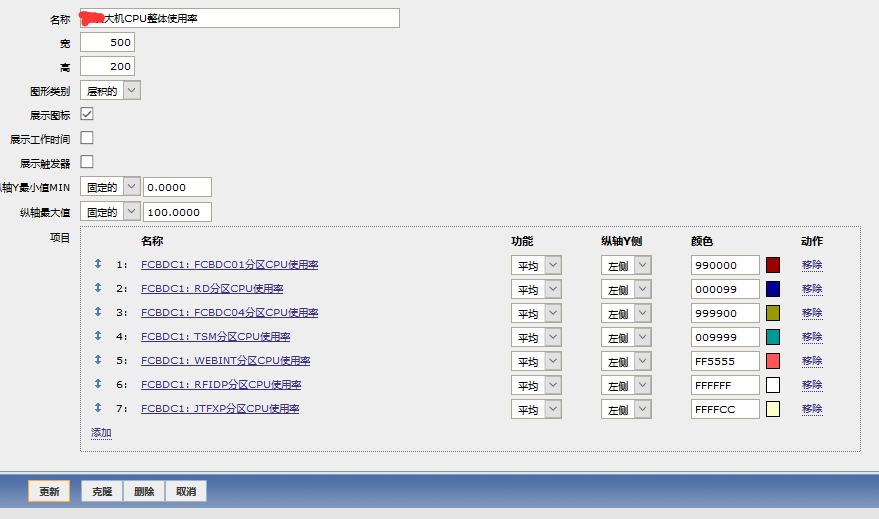
New monitoring graph
Design sketch