Previously, the company asked to outsource a zrender.js for temperature list, but the code was relatively complex and maintenance was relatively low, and the technology was not good. Recently, I took a look at the official website of zrender and slowly explored and read the previous code. It felt that it was not difficult in practice, so I drew a new one from scratch, including polylines, dots, shadow areas, and verticality. Dotted line, mouse hover event and many other contents
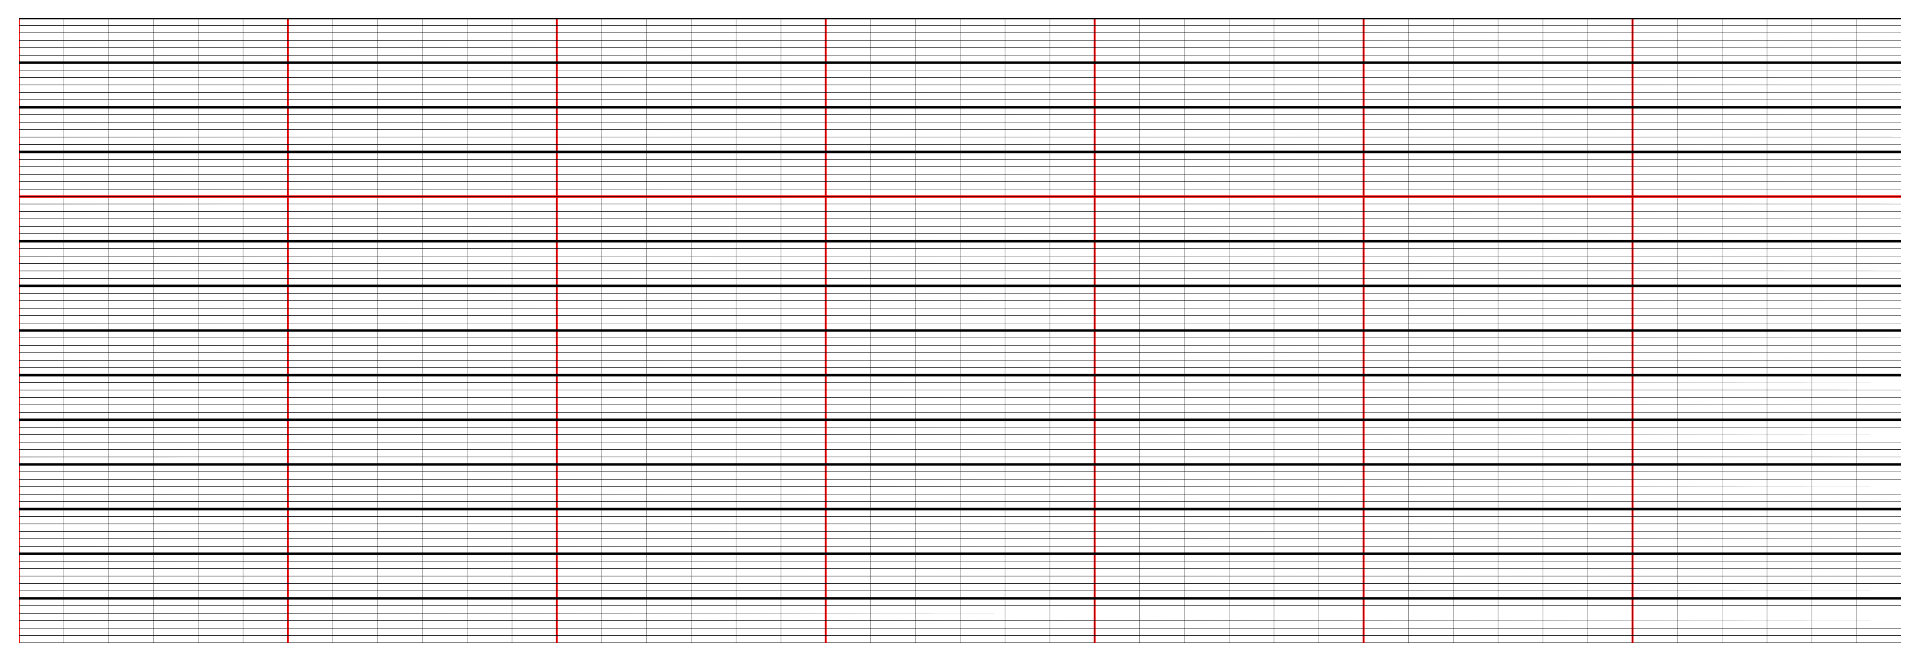
Today, let's talk about how to draw a grid. The effect is as follows
First, write the basic code of the style.
<template>
 <div>
   <div id="main">
   </div>
 </div>
</template>
css
<style scoped>
  #main{
    height: 500px;
    padding: 15px;
    position: relative;
  }
  html,body{
    height: 100%;
    width: 100%;
    margin: 0;
    padding: 0;
  }
  canvas{
    width: 100%;
    height: 700px;
  }
</style>
js
<script>
    import zrender from 'zrender'

    export default {
  name: 'HelloWorld',
  data () {
    return {
      //How many? y Axis coordinate
      xLineLen:{
        //The number of days is 7 days.
        day:7,
        //How many segments a day
        time:6
      },
      canavsWidth:0, //Breadth of drawing board
      canavsHeight:0, //Sketchpad height
      zr:"", //Sketchpad attribute
      yLineLen:{
        XRegion:14, //X Axis coordinates are divided into several large blocks
        XShare:6, //How many pieces per piece
        XLineArr:[4], //The horizontal lines that need special treatment shall be counted up and down.
      }
    }
  },
  methods:{
    init(){
      this.zr = zrender.init(document.getElementById("main"))this.canavsWidth = this.zr.getWidth()
      this.canavsHeight = this.zr.getHeight()

    }
  },
  mounted(){
    this.init()
  }
}
</script>
this.canavsWidth is to get the width of the board. Similarly, the following is to get the height of the board.
First of all, you need to know how many grids are needed for X and Y axes to draw a mesh.
First of all, we need to show the data for one week, all of which will have seven large grids, and then we need to divide them into four hours a day. First, we need to build a grid of global variables.
Here we define the number of x-axis, and then the y-axis.
 yLineLen:{
        XRegion:14, //X Axis coordinates are divided into several large blocks
        XShare:6, //How many pieces per piece
        XLineArr:[4], //The horizontal lines that need special treatment shall be counted up and down.
      }
Xlinear is the long red line in the lattice.
After the data is created, we add two methods to init, which are to create the coordinates of X and Y axes.
 this.yLine() //generate Y Axis coordinate
 this.xLine() //generate X Axis coordinate
Add the above two methods in methods after adding
Let's talk about yLine first.
 //Abscissa
      let Xline = new zrender.Line({
        shape:{
          x1:0,
          y1:this.canavsHeight,
          x2:this.canavsWidth,
          y2:this.canavsHeight
        }
      })
      this.zr.add(Xline)
Here is to add the abscissa at the bottom of the coordinate axis. Of course, this should not be written here. In order to show the x,y initial coordinate axis, it does not affect our other methods.
x1,y1 is the start coordinate point x2,y2 is the end coordinate point from left to right
this.zr.add is to add 2 points and connect them.
const yWidth = this.canavsWidth/this.xLineLen.day
      //Cycle through vertical grid
      for (let i = 0; i < this.xLineLen.day; i++) {
         //Ordinate
        let Yline = new zrender.Line({
          shape:{
            x1:yWidth*i,
            y1:0,
            x2:yWidth*i,
            y2:this.canavsHeight
          },
          style:{
            opacity:1,
            lineWidth:1.5,
            stroke:"#ff0000"
          }
        })
        this.zr.add(Yline)
      }
The yWidth here represents the width of a large grid. Divide the width of the canvas by the number of days we defined earlier, which is the width of each large grid.
Then we cycle through the days we define.
opacity stands for transparency
lineWidth represents the width of the line segment
stroke represents the color of the segment fill
There should be 7 red vertical lines in the interface after this step.
      let yLinAll = this.xLineLen.day*this.xLineLen.time
      for (let i = 0; i < yLinAll; i++) {

         let Yline = new zrender.Line({
          shape:{
            x1:yWidth/this.xLineLen.time*i,
            y1:0,
            x2:yWidth/this.xLineLen.time*i,
            y2:this.canavsHeight
          },
          style:{
            opacity:1,
            lineWidth:0.3,
            stroke:"#000"
          }
        })
        this.zr.add(Yline)
      }
yLinAll is how many days are there in total? Let's figure out the total number of days first and then cycle the total number of days so that we can draw the small grid in each big grid.
The parameters in style refer to the previous one and you can also view the official website.
This step completes the y-axis coordinate, even if it is finished, then we draw the x-axis and write it in the xLine method.
let xHeight = this.canavsHeight/this.yLineLen.XRegion
let XShareAll = this.yLineLen.XRegion*this.yLineLen.XShare
xHeight stands for the height of a large grid
How many squares does XShareAll represent
for (let i = 0; i < this.yLineLen.XRegion; i++) {
        let color = "#000"
        this.yLineLen.XLineArr.forEach(el => {
          if (el == i) {
            color = "#ff0000"
          }
        });
        //Bold abscissa
        let Xline = new zrender.Line({
          shape:{
            x1:0,
            y1:xHeight*i,
            x2:this.canavsWidth,
            y2:xHeight*i
          },
          style:{
            opacity:1,
            lineWidth:2,
            stroke:color
          }
        })
        this.zr.add(Xline)
Let's cycle the big grid first.
       for (let a = 0; a < XShareAll; a++) {
          //Abscissa
          let Xline = new zrender.Line({
            shape:{
              x1:0,
              y1:xHeight/this.yLineLen.XShare*a,
              x2:this.canavsWidth,
              y2:xHeight/this.yLineLen.XShare*a
            },
            style:{
              opacity:1,
              lineWidth:0.1,
              stroke:"#000"
            }
          })
          this.zr.add(Xline)
        }
Before we cycle out all the small squares and put them in the upper and lower squares, we cycle the left and right squares.
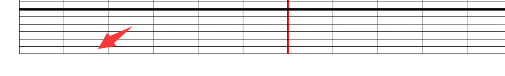
Now that we've finished this step, we should have drawn the time grid of the temperature list. Today, I'll write about this. Next time, I'll write the line chart and the drawing method of the dot line chart. The broken line and the vertical dotted line.
Don't spray me if you don't write well for the first time