Label: Excel chart, VBA
Excel does quite well in scaling chart axes, but sometimes you want it to do better. The XY scatter chart shown in Figure 1 below shows a situation where the X and Y values of all points are between 0 and 7, but because the chart itself is rectangular, the spacing of grid lines along the X and Y axes is different. Wouldn't it be better to have the same spacing along the two axes and provide square grid lines?
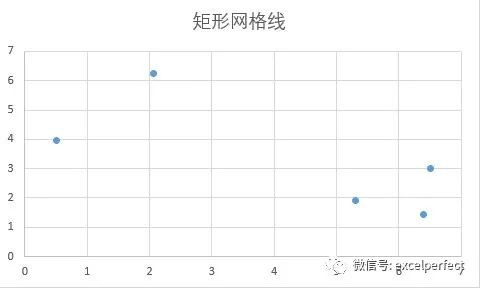
Figure 1
There are several ways to do this, not including the cumbersome manual method of clicking and dragging with the mouse, nor the series of values trying to maximize the axis. VBA is used here to handle this task.
Set the square gridlines by changing the axis scale
The first method is to measure the drawing area size of the chart, lock the axis scale parameter, and use the scale to determine the distance between the grid lines in the horizontal and vertical directions. Then, the maximum value of axes with larger spacing increases, so their grid line spacing decreases to match the spacing on axes with smaller spacing.
The following function accepts the chart you want to process and implements a square grid line.
Function SquareGridChangingScale(myChart As Chart)
    With myChart
        'Get drawing area size
        With .PlotArea
            Dim plotInHt As Double
            Dim plotInWd As Double
            plotInHt = .InsideHeight
            plotInWd = .InsideWidth
        End With
        'Gets the axis scale parameter and locks the scale
        With .Axes(xlValue)
            Dim Ymax As Double
            Dim Ymin As Double
            Dim Ymaj As Double
            Ymax = .MaximumScale
            Ymin = .MinimumScale
            Ymaj = .MajorUnit
            .MaximumScaleIsAuto = False
            .MinimumScaleIsAuto = False
            .MajorUnitIsAuto = False
        End With
        With .Axes(xlCategory)
            Dim Xmax As Double
            Dim Xmin As Double
            Dim Xmaj As Double
            Xmax = .MaximumScale
            Xmin = .MinimumScale
            Xmaj = .MajorUnit
            .MaximumScaleIsAuto = False
            .MinimumScaleIsAuto = False
            .MajorUnitIsAuto = False
        End With
        'Scale spacing(distance)
        Dim Ytic As Double
        Dim Xtic As Double
        Ytic = plotInHt * Ymaj / (Ymax - Ymin)
        Xtic = plotInWd * Xmaj / (Xmax - Xmin)
        'Keep the drawing size unchanged and adjust the maximum scale
        If Xtic > Ytic Then
            .Axes(xlCategory).MaximumScale =plotInWd * Xmaj / Ytic + Xmin
        Else
            .Axes(xlValue).MaximumScale =plotInHt * Ymaj / Xtic + Ymin
        End If
    End With
End Function
Use the following code to call the above function procedure:
SquareGridChangingScale ActiveChart
The chart effect is shown in Figure 2 below, and the grid line is square.

Figure 2
There is a strange blank edge in the chart, but you can make it look less strange by formatting the drawing area border to match the axis.
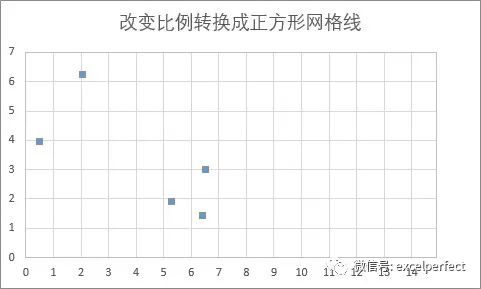
Figure 3
Try another chart. Similar to the first one, but the X value is twice the previous one, which leads to different proportions, as shown in Figure 4 below.
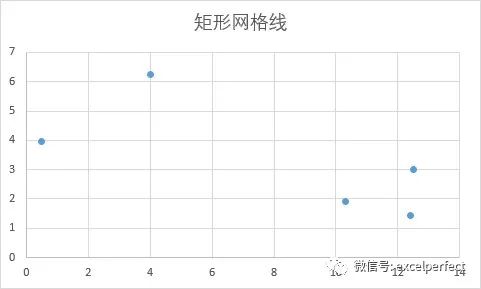
Figure 4
The chart after calling the SquareGridChangingScale procedure is shown in Figure 5 below. Similarly, the grid lines are square and the right edge appears blank. But I see another problem: the scale spacing of X axis is 2 units, while the scale spacing of Y axis is 1 unit.
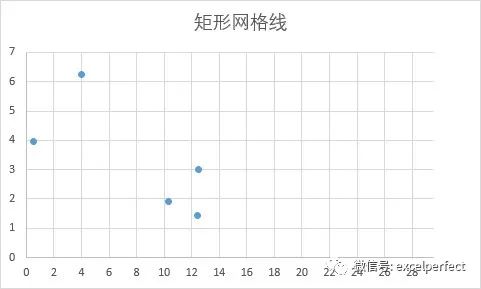
Figure 5
Force primary units to be equally spaced
Modify the previous procedure by adding the optional parameter EqualMajorUnit. If this parameter is set to True, the code will apply the same spacing to both axes before adjusting the axis maximum value; If this parameter is set to False or omitted, the code ignores the scale spacing.
Function SquareGridChangingScale2(myChart As Chart, Optional EqualMajorUnit As Boolean =False)
    With myChart
        'Get drawing area size
        With .PlotArea
            Dim plotInHt As Double
            Dim plotInWd As Double
            plotInHt = .InsideHeight
            plotInWd = .InsideWidth
        End With
        'Gets the axis scale parameter and locks the scale
        With .Axes(xlValue)
            Dim Ymax As Double
            Dim Ymin As Double
            Dim Ymaj As Double
            Ymax = .MaximumScale
            Ymin = .MinimumScale
            Ymaj = .MajorUnit
            .MaximumScaleIsAuto = False
            .MinimumScaleIsAuto = False
            .MajorUnitIsAuto = False
        End With
        With .Axes(xlCategory)
            Dim Xmax As Double
            Dim Xmin As Double
            Dim Xmaj As Double
            Xmax = .MaximumScale
            Xmin = .MinimumScale
            Xmaj = .MajorUnit
            .MaximumScaleIsAuto = False
            .MinimumScaleIsAuto = False
            .MajorUnitIsAuto = False
        End With
        If EqualMajorUnit Then
            'Set the scale spacing to the same value
            Xmaj = WorksheetFunction.Min(Xmaj,Ymaj)
            Ymaj = Xmaj
            .Axes(xlCategory).MajorUnit = Xmaj
            .Axes(xlValue).MajorUnit = Ymaj
        End If
        'Scale spacing(distance)
        Dim Ytic As Double
        Dim Xtic As Double
        Ytic = plotInHt * Ymaj / (Ymax - Ymin)
        Xtic = plotInWd * Xmaj / (Xmax - Xmin)
        'Keep the drawing size unchanged and adjust the maximum scale
        If Xtic > Ytic Then
            .Axes(xlCategory).MaximumScale =plotInWd * Xmaj / Ytic + Xmin
        Else
            .Axes(xlValue).MaximumScale =plotInHt * Ymaj / Xtic + Ymin
        End If
    End With
End Function
The effect of calling the above functions and slightly adjusting the format is shown in Figure 6 below.
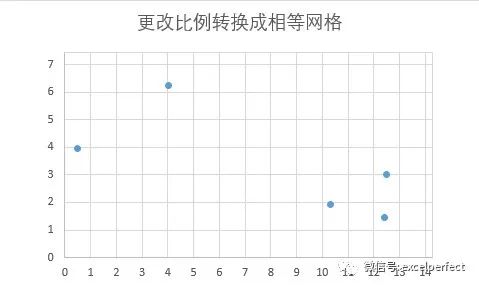
Figure 6
Set the square gridlines by changing the size of the drawing area
By keeping the drawing area fixed and adjusting the axis scale, the above square grid line is realized. But what happens if you shrink the drawing area to the number of grid lines you need to square? Get a blank area along the edge of the chart without hanging some grid lines in the space, and then place the drawing area in the center of the chart.
Function SquareGridChangingPlotSize(myChart As Chart, Optional EqualMajorUnit As Boolean= False)
    With myChart
        'Get drawing area size
        With .PlotArea
            Dim plotInHt As Double
            Dim plotInWd As Double
            plotInHt = .InsideHeight
            plotInWd = .InsideWidth
        End With
        'Gets the axis scale parameter and locks the scale
        With .Axes(xlValue)
            Dim Ymax As Double
            Dim Ymin As Double
            Dim Ymaj As Double
            Ymax = .MaximumScale
            Ymin = .MinimumScale
            Ymaj = .MajorUnit
            .MaximumScaleIsAuto = False
            .MinimumScaleIsAuto = False
            .MajorUnitIsAuto = False
        End With
        With .Axes(xlCategory)
            Dim Xmax As Double
            Dim Xmin As Double
            Dim Xmaj As Double
            Xmax = .MaximumScale
            Xmin = .MinimumScale
            Xmaj = .MajorUnit
            .MaximumScaleIsAuto = False
            .MinimumScaleIsAuto = False
            .MajorUnitIsAuto = False
        End With
        If EqualMajorUnit Then
            'Set the scale spacing to the same value
            Xmaj = WorksheetFunction.Min(Xmaj,Ymaj)
            Ymaj = Xmaj
            .Axes(xlCategory).MajorUnit = Xmaj
            .Axes(xlValue).MajorUnit = Ymaj
        End If
        'Scale spacing(distance)
        Dim Ytic As Double
        Dim Xtic As Double
        Ytic = plotInHt * Ymaj / (Ymax - Ymin)
        Xtic = plotInWd * Xmaj / (Xmax - Xmin)
        'Resize drawing area,Center in space
        If Xtic < Ytic Then
            .PlotArea.InsideHeight =.PlotArea.InsideHeight * Xtic / Ytic
            .PlotArea.Top = .PlotArea.Top + _
                (.ChartArea.Height -.PlotArea.Height - .PlotArea.Top) / 2
        Else
            .PlotArea.InsideWidth =.PlotArea.InsideWidth * Ytic / Xtic
            .PlotArea.Left = .PlotArea.Left + _
                (.ChartArea.Width -.PlotArea.Width - .PlotArea.Left) / 2
        End If
    End With
End Function
When you call this code, you get a square grid line, no extended grid line extension, and no large blank area. The drawing area is well centered.
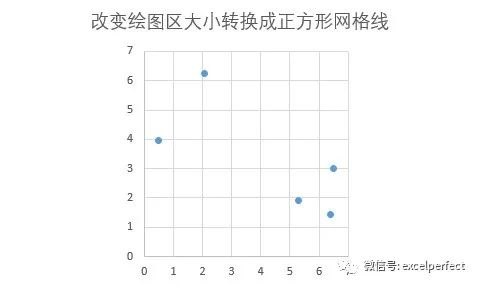
Figure 7
For charts of other data, the effect is shown in Figure 8 below.
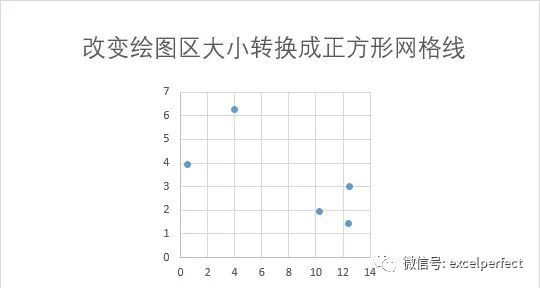
Figure 8
Using EqualMajorUnit=True, the square grid has different scale spacing on the X and Y axes. Try again, as shown in Figure 9 below.
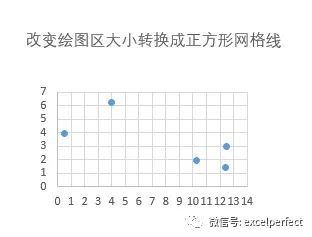
Figure 9
Adjust to a square grid by changing the chart size
When the second function resizes the drawing area, some blanks appear in the result chart. In some cases, this gap can be large. What happens if you shrink the entire chart, not just the drawing area, and absorb excess white space?
Function SquareGridChangingChartSize(myChart As Chart, Optional EqualMajorUnit AsBoolean = False)
    With myChart
        'Get drawing area size
        With .PlotArea
            Dim plotInHt As Double
            Dim plotInWd As Double
            plotInHt = .InsideHeight
            plotInWd = .InsideWidth
        End With
        'Gets the axis scale parameter and locks the scale
        With .Axes(xlValue)
            Dim Ymax As Double
            Dim Ymin As Double
            Dim Ymaj As Double
            Ymax = .MaximumScale
            Ymin = .MinimumScale
            Ymaj = .MajorUnit
            .MaximumScaleIsAuto = False
            .MinimumScaleIsAuto = False
            .MajorUnitIsAuto = False
        End With
        With .Axes(xlCategory)
            Dim Xmax As Double
            Dim Xmin As Double
            Dim Xmaj As Double
            Xmax = .MaximumScale
            Xmin = .MinimumScale
            Xmaj = .MajorUnit
            .MaximumScaleIsAuto = False
            .MinimumScaleIsAuto = False
            .MajorUnitIsAuto = False
        End With
        If EqualMajorUnit Then
            'Set the scale spacing to the same value
            Xmaj = WorksheetFunction.Min(Xmaj,Ymaj)
            Ymaj = Xmaj
            .Axes(xlCategory).MajorUnit = Xmaj
            .Axes(xlValue).MajorUnit = Ymaj
        End If
        'Scale spacing(distance)
        Dim Ytic As Double
        Dim Xtic As Double
        Ytic = plotInHt * Ymaj / (Ymax - Ymin)
        Xtic = plotInWd * Xmaj / (Xmax - Xmin)
        'Resize chart,Center in space
        If Xtic < Ytic Then
            .Parent.Height = .Parent.Height -.PlotArea.InsideHeight * (1 - Xtic / Ytic)
        Else
            .Parent.Width = .Parent.Width -.PlotArea.InsideWidth * (1 - Ytic / Xtic)
        End If
    End With
End Function
There are some considerations when applying this method: when resizing the chart, the chart title may determine that it needs to wrap, which will change the size of the drawing area and make the grid lines not square. The following are the chart results of the two data sets. There is no need to fix the scale spacing mismatch of the second data set.
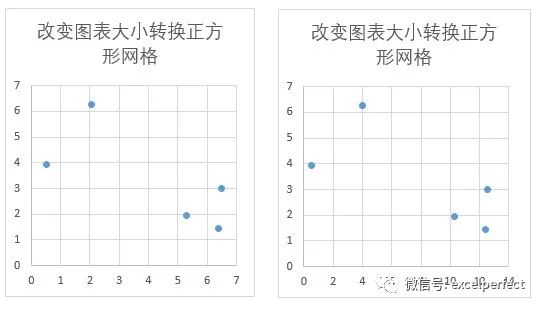
Figure 10
Figure 11 below shows the chart effect of the second dataset when EqualMajorUnit is set to True.
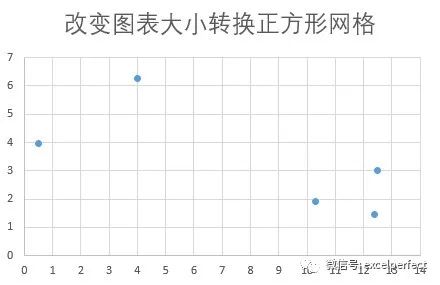
Figure 11
The way to improve this function is to set the parameter ShrinkChart to tell the function whether to adjust the drawing area (if False) or the chart size (if True).
Function SquareGridChangingChartSize(myChart As Chart, _
    ShrinkChart As Boolean, _
    Optional EqualMajorUnit As Boolean = False)
    With myChart
        'Get drawing area size
        With .PlotArea
            Dim plotInHt As Double
            Dim plotInWd As Double
            plotInHt = .InsideHeight
            plotInWd = .InsideWidth
        End With
        'Gets the axis scale parameter and locks the scale
        With .Axes(xlValue)
            Dim Ymax As Double
            Dim Ymin As Double
            Dim Ymaj As Double
            Ymax = .MaximumScale
            Ymin = .MinimumScale
            Ymaj = .MajorUnit
            .MaximumScaleIsAuto = False
            .MinimumScaleIsAuto = False
            .MajorUnitIsAuto = False
        End With
        With .Axes(xlCategory)
            Dim Xmax As Double
            Dim Xmin As Double
            Dim Xmaj As Double
            Xmax = .MaximumScale
            Xmin = .MinimumScale
            Xmaj = .MajorUnit
            .MaximumScaleIsAuto = False
            .MinimumScaleIsAuto = False
            .MajorUnitIsAuto = False
        End With
        If EqualMajorUnit Then
            'Set the scale spacing to the same value
            Xmaj = WorksheetFunction.Min(Xmaj,Ymaj)
            Ymaj = Xmaj
            .Axes(xlCategory).MajorUnit = Xmaj
            .Axes(xlValue).MajorUnit = Ymaj
        End If
        'Scale spacing(distance)
        Dim Ytic As Double
        Dim Xtic As Double
        Ytic = plotInHt * Ymaj / (Ymax - Ymin)
        Xtic = plotInWd * Xmaj / (Xmax - Xmin)
        If ShrinkChart Then
            'Resize chart
            If Xtic < Ytic Then
                .Parent.Height = .Parent.Height- .PlotArea.InsideHeight * (1 - Xtic / Ytic)
            Else
                .Parent.Width = .Parent.Width -.PlotArea.InsideWidth * (1 - Ytic / Xtic)
            End If
        Else
            'Resize drawing area,Center in space
            If Xtic < Ytic Then
              .PlotArea.InsideHeight =.PlotArea.InsideHeight * Xtic / Ytic
              .PlotArea.Top = .PlotArea.Top + _
                (.ChartArea.Height -.PlotArea.Height - .PlotArea.Top) / 2
            Else
              .PlotArea.InsideWidth =.PlotArea.InsideWidth * Ytic / Xtic
              .PlotArea.Left = .PlotArea.Left +_
                (.ChartArea.Width -.PlotArea.Width - .PlotArea.Left) / 2
            End If
        End If
    End With
End Function
Here's how to call the function from a procedure that determines which charts are selected and applies the function to each chart.
Sub SquareXYGridOfSelectedCharts()
    If Not ActiveChart Is Nothing Then
        squareXYChartGrid ActiveChart, True,True
    ElseIf TypeName(Selection) ="DrawingObjects" Then
        Dim shp As Shape
        For Each shp In Selection.ShapeRange
            If shp.HasChart Then
                squareXYChartGrid shp.Chart,True, True
            End If
        Next
    Else
        MsgBox "Select one or more charts,Try again.",vbExclamation, "No chart selected"
    End If
End Sub
Note: This article is compiled from peltiertech COM, a website focusing on Excel charts.
People are welcome to learn more and more perfect content in this article.