vnstat traffic statistics (version 2.8)
vnStat is a console based Linux and BSD network traffic monitor that maintains network traffic logs for selected interfaces. It uses the network interface statistics provided by the kernel as the information source. This means that vnStat will not actually sniff any traffic, and can ensure a small use of system resources regardless of the network traffic rate.
This program is open source / GPL and can be installed as root or a single user.
Official website: http://humdi.net/vnstat/
github: https://github.com/vergoh/vnstat
Image output demonstration: https://humdi.net/vnstat/cgidemo/
characteristic
- Fast and simple installation and operation
- The collected statistics still exist after the system is restarted
- Multiple interfaces can be monitored at the same time
- Several output options
- Summary, 5 minutes, every hour, every day, every month, every year, the most important day
- Optional png image output (using libgd)
- Data retention time is completely dynamically configured by users
- The month can be configured to follow the billing cycle
- Lightweight, minimal resource use
- CPU utilization is equally low regardless of traffic
- It can be used without root permission
- Online color configuration editor
Install and configure vnstat
precondition
- make
- C compiler
- user with access to kernel interface statistics
- usually available by default but can be restricted for example by grsecurity and similar security enhancement suites or settings
- sqlite3 (library and development files)
- libgd (optional, image output)
- check (optional, test suite)
- pkg-config (optional, for check detection)
- autotools (optional, for recreating configure and makefiles)
install
wget https://github.com/vergoh/vnstat/releases/download/v2.8/vnstat-2.8.tar.gz

tar zxf vnstat-2.8.tar.gz

cd vnstat-2.8

./configure --prefix=/usr --sysconfdir=/etc && make && make install

mkdir /var/lib/vnstat

chmod -R 777 /var/lib/vnstat/
Configure system startup
cp -v examples/systemd/vnstat.service /etc/systemd/system/
systemctl enable vnstat
systemctl start vnstat
systemctl restart vnstat
Note: if it is an older version, use the following command
cp -v examples/systemd/simple/vnstat.service /etc/systemd/system/
systemctl enable vnstat
systemctl start vnstat
Other systems
- Debian
cp -v examples/init.d/debian/vnstat /etc/init.d/
update-rc.d vnstat defaults
service vnstat start
- Red Hat / CentOS
cp -v examples/init.d/redhat/vnstat /etc/init.d/
chkconfig vnstat on
service vnstat start
-
upstart
cp -v examples/upstart/vnstat.conf /etc/init/
initctl start vnstat
During the first startup, the daemon (vnstatd) should list and add all available monitoring interfaces. Depending on the configuration, the vnstat command may take several minutes to start displaying the results because the entries in the database are not constantly updated.
You can stop monitoring unnecessary interfaces in the following ways:
vnstat --remove -i eth0
Add if necessary
vnstat --add -i eth0
vnstat usage
Detailed explanation of vnstat command parameters
Here are the parameters of the latest version 2.8
[root@linux vnstat]# vnstat --help
vnStat 2.8 by Teemu Toivola <tst at iki dot fi>

      -5,  --fiveminutes [limit]   show 5 minutes
      -h,  --hours [limit]         show hours
      -hg, --hoursgraph            show hours graph
      -d,  --days [limit]          show days
      -m,  --months [limit]        show months
      -y,  --years [limit]         show years
      -t,  --top [limit]           show top days

      -b, --begin <date>           set list begin date
      -e, --end <date>             set list end date

      --oneline [mode]             show simple parsable format
      --json [mode] [limit]        show database in json format
      --xml [mode] [limit]         show database in xml format

      -tr, --traffic [time]        calculate traffic
      -l,  --live [mode]           show transfer rate in real time
      -i,  --iface <interface>     select interface

Use "--longhelp" or "man vnstat" for complete list of options.
vnstat
View the traffic statistics of all interfaces
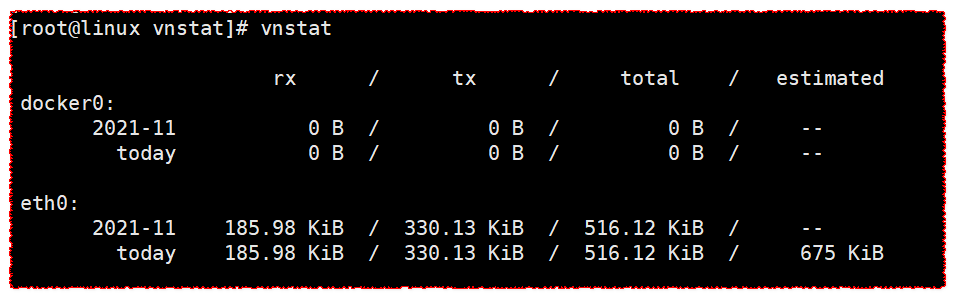
[root@linux vnstat]# vnstat

                      rx      /      tx      /     total    /   estimated
 docker0:
       2021-11           0 B  /         0 B  /         0 B  /     --
         today           0 B  /         0 B  /         0 B  /     --

 eth0:
       2021-11    185.98 KiB  /  330.13 KiB  /  516.12 KiB  /     --
         today    185.98 KiB  /  330.13 KiB  /  516.12 KiB  /     675 KiB
rx: rx is receive
tx: tx is transport
total: total
Estimated: estimated
vnstat -5
View every five minutes
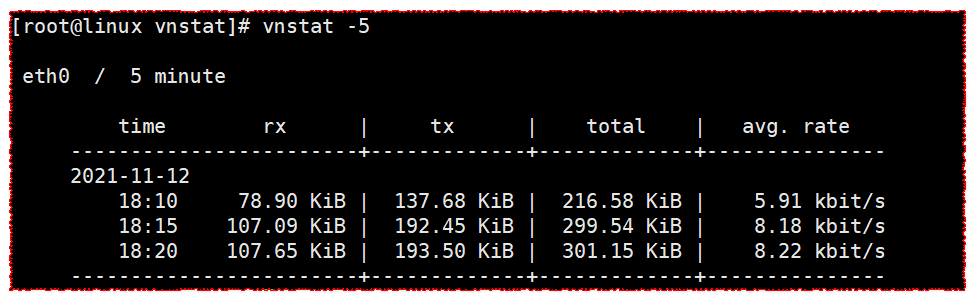
[root@linux vnstat]# vnstat -5

 eth0  /  5 minute

         time        rx      |     tx      |    total    |   avg. rate
     ------------------------+-------------+-------------+---------------
     2021-11-12
         18:10     78.90 KiB |  137.68 KiB |  216.58 KiB |    5.91 kbit/s
         18:15    107.09 KiB |  192.45 KiB |  299.54 KiB |    8.18 kbit/s
         18:20    107.65 KiB |  193.50 KiB |  301.15 KiB |    8.22 kbit/s
     ------------------------+-------------+-------------+---------------
Time: time
rx: rx is receive
tx: tx is transport
total: total
avg. rate: average speed
vnstat -h
View by hour
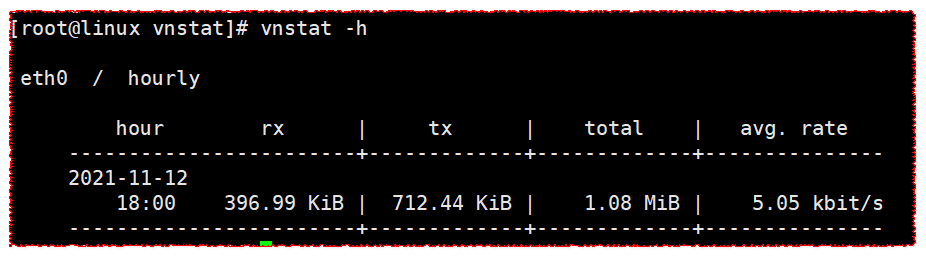
[root@linux vnstat]# vnstat -h

 eth0  /  hourly

         hour        rx      |     tx      |    total    |   avg. rate
     ------------------------+-------------+-------------+---------------
     2021-11-12
         18:00    396.99 KiB |  712.44 KiB |    1.08 MiB |    5.05 kbit/s
     ------------------------+-------------+-------------+---------------
vnstat -hg
Show hour chart
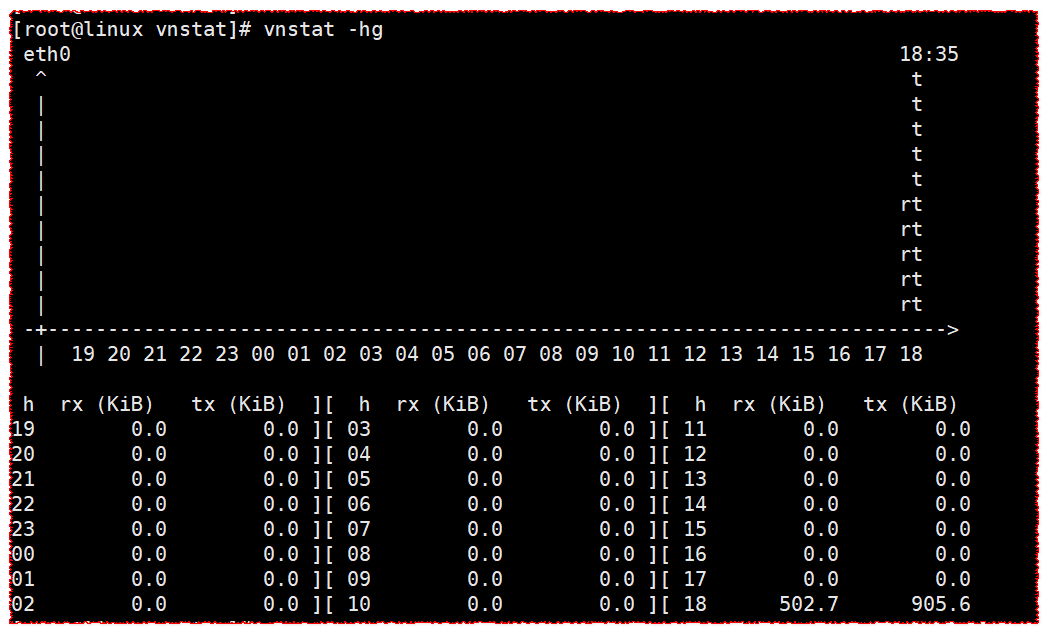
[root@linux vnstat]# vnstat -hg
 eth0                                                                     18:35
  ^                                                                        t
  |                                                                        t
  |                                                                        t
  |                                                                        t
  |                                                                        t
  |                                                                       rt
  |                                                                       rt
  |                                                                       rt
  |                                                                       rt
  |                                                                       rt
 -+--------------------------------------------------------------------------->
  |  19 20 21 22 23 00 01 02 03 04 05 06 07 08 09 10 11 12 13 14 15 16 17 18

 h  rx (KiB)   tx (KiB)  ][  h  rx (KiB)   tx (KiB)  ][  h  rx (KiB)   tx (KiB)
19        0.0        0.0 ][ 03        0.0        0.0 ][ 11        0.0        0.0
20        0.0        0.0 ][ 04        0.0        0.0 ][ 12        0.0        0.0
21        0.0        0.0 ][ 05        0.0        0.0 ][ 13        0.0        0.0
22        0.0        0.0 ][ 06        0.0        0.0 ][ 14        0.0        0.0
23        0.0        0.0 ][ 07        0.0        0.0 ][ 15        0.0        0.0
00        0.0        0.0 ][ 08        0.0        0.0 ][ 16        0.0        0.0
01        0.0        0.0 ][ 09        0.0        0.0 ][ 17        0.0        0.0
02        0.0        0.0 ][ 10        0.0        0.0 ][ 18      502.7      905.6
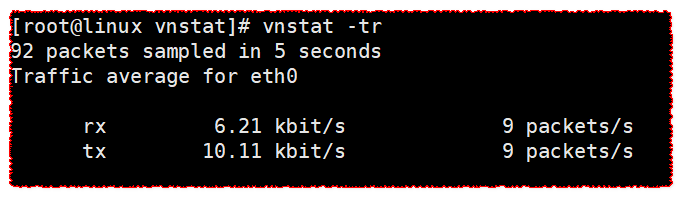
vnstat -tr
calculate traffic
[root@linux vnstat]# vnstat -tr
92 packets sampled in 5 seconds
Traffic average for eth0

      rx         6.21 kbit/s             9 packets/s
      tx        10.11 kbit/s             9 packets/s
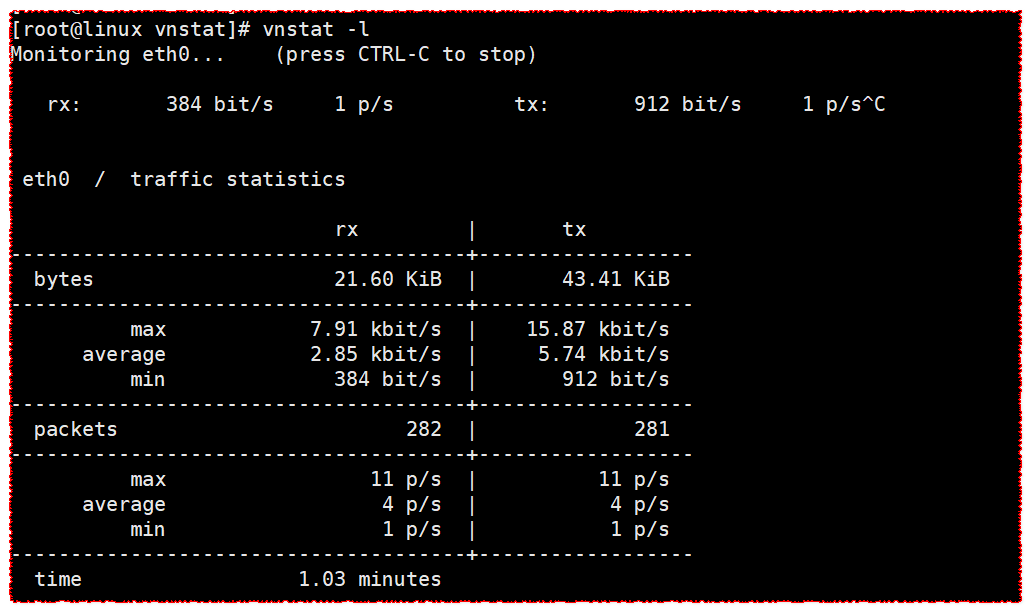
vnstat -l
Display real-time transmission rate
[root@linux vnstat]# vnstat -l
Monitoring eth0...    (press CTRL-C to stop)

   rx:       384 bit/s     1 p/s          tx:       912 bit/s     1 p/s^C


 eth0  /  traffic statistics

                           rx         |       tx
--------------------------------------+------------------
  bytes                    21.60 KiB  |       43.41 KiB
--------------------------------------+------------------
          max            7.91 kbit/s  |    15.87 kbit/s
      average            2.85 kbit/s  |     5.74 kbit/s
          min              384 bit/s  |       912 bit/s
--------------------------------------+------------------
  packets                        282  |             281
--------------------------------------+------------------
          max                 11 p/s  |          11 p/s
      average                  4 p/s  |           4 p/s
          min                  1 p/s  |           1 p/s
--------------------------------------+------------------
  time                  1.03 minutes
There are many usages, such as by day, by month and so on. You can try them by yourself.
Error reporting solution
Error one
configure: error: could not find required sqlite3 library
resolvent
Ubuntu
# Ubuntu
apt-get install sqlite3
apt-get install libsqlite3-dev
CentOS
# CentOS
# Method 1
wget http: //www.sqlite.org/sqlite-autoconf-3070500.tar.gz
tar xvzf sqlite-autoconf-3070500.tar.gz
cd sqlite-autoconf-3070500
./configure
make
make install

# Method 2:
yum install -y sqlite-devel

# Method 3:
yum install -y sqlite3-ruby
View version information: sqlite3 -version
Terminal entry command: sqlite3
Error two
configure: error: no acceptable C compiler found in $PATH
resolvent
Ubuntu
# Ubuntu
apt install 'g++'
CentOS
Method 1
yum -y install gcc gcc-c++

Method II
wget http://ftp.mirrorservice.org/sites/sourceware.org/pub/gcc/releases/gcc-9.4.0/gcc-9.4.0.tar.gz
tar zxf gcc-9.4.0.tar.gz
cd gcc-9.4.0
yum -y install bzip2
./contrib/download_prerequisites
./configure --disable-multilib --enable-languages=c,c++
make -j 4
make install
Error three
error: Cannot download mpfr-3.1.4.tar.bz2 from ftp://gcc.gnu.org/pub/gcc/infrastructure/
error: Cannot download mpc-1.0.3.tar.gz from ftp://gcc.gnu.org/pub/gcc/infrastructure/
error: Cannot download gmp-6.1.0.tar.bz2 from ftp://gcc.gnu.org/pub/gcc/infrastructure/
wget https://gmplib.org/download/gmp/gmp-6.1.0.tar.lz
wget https://www.mpfr.org/mpfr-current/mpfr-3.1.4.tar.bz2
wget https://ftp.gnu.org/gnu/mpc/mpc-1.0.3.tar.gz
wget https://gcc.gnu.org/pub/gcc/infrastructure/isl-0.18.tar.bz2