With the Editor VS Code, we still lack Ruby compiler and interpreter, supporting plug-ins and configuration code... However, I don't know much about the combination of VSCode and ruby. Learn and change slowly
1. Download and install Ruby
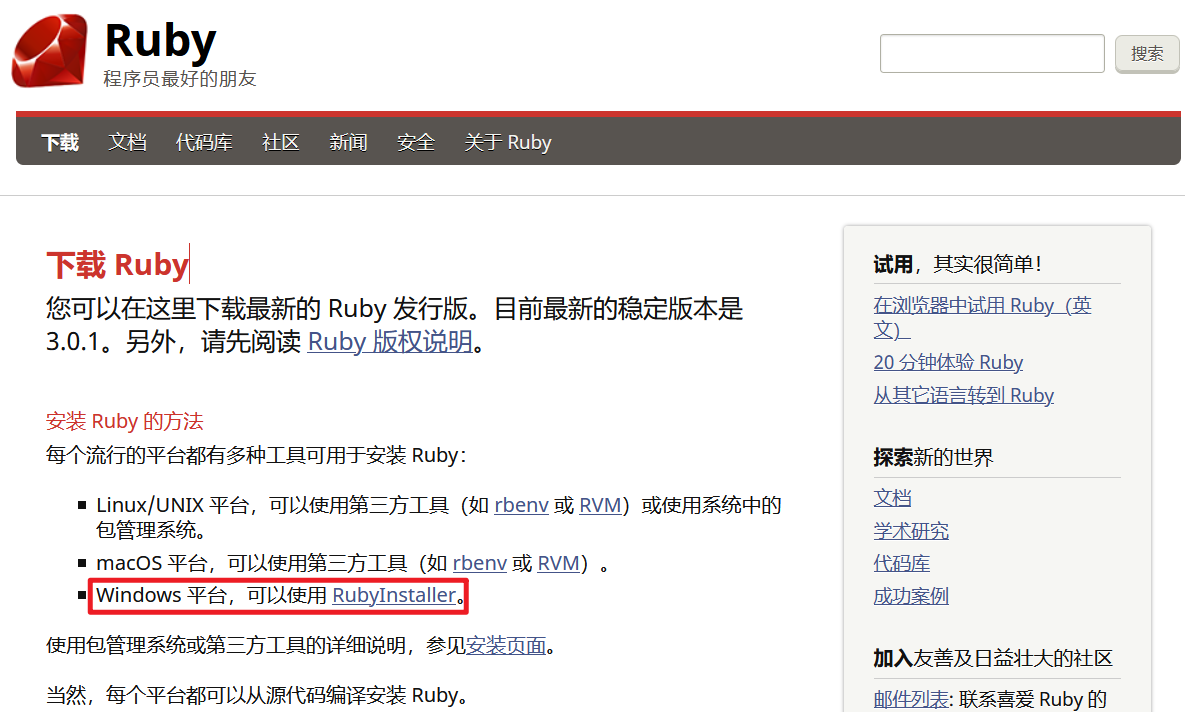
Open Ruby's official Chinese website first http://www.ruby-lang.org/zh_cn/downloads/ , click the red box position:
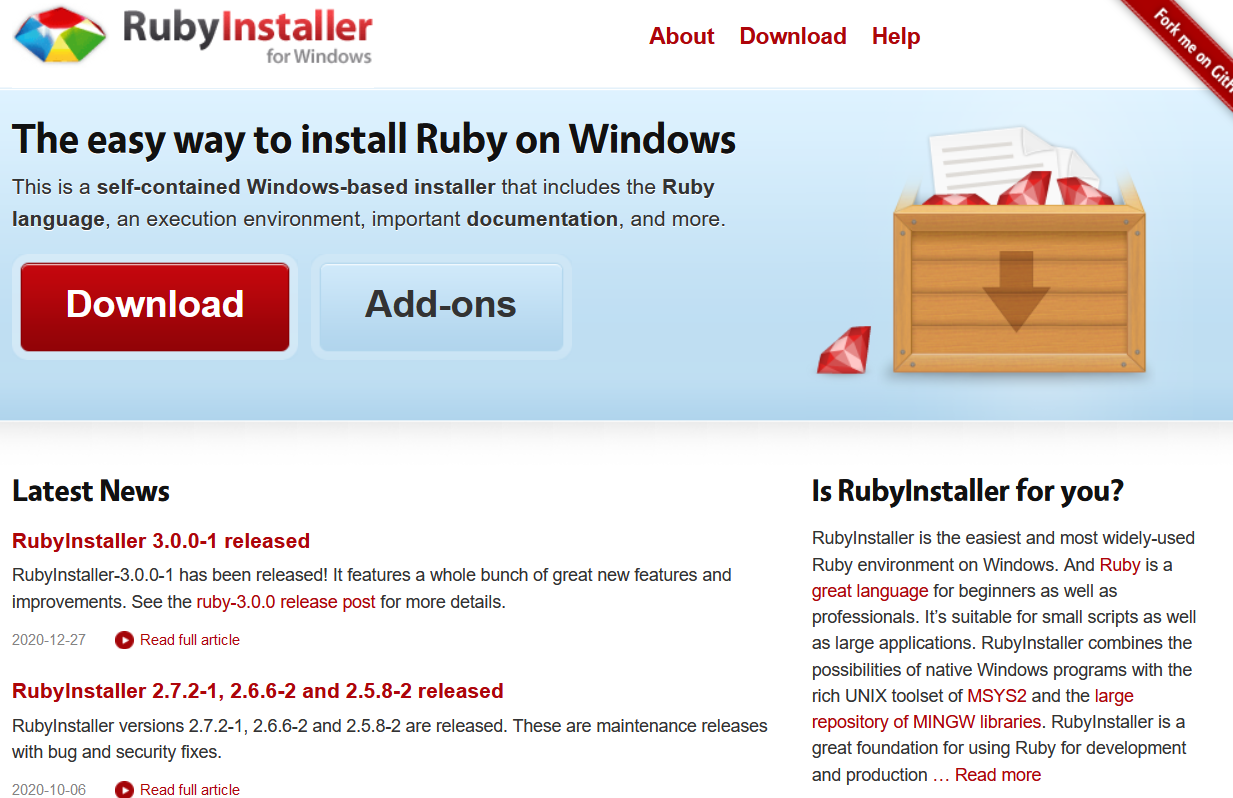
get into https://rubyinstaller.org/ Website:
Then click Download to enter the Download interface. There is a detailed explanation on the right. If you don't know which version to install, Ruby + devkit 2.7 is recommended X (x64) installation package, which provides the maximum number of compatible gems, and MSYS2 Devkit is installed with Ruby to compile gems with C extension. The 32-bit x86 version is recommended only if you must use a custom 32-bit native DLL or COM object.
Maybe you don't know MSYS2 very well, but as a programmer, you certainly know MinGW, and MSYS2 integrates MinGW. At the same time, it also has some other features, such as package manager Pacman (those who have used ArchLinux should know Pacman), and so on. In a word, MSYS2 can build a perfect Linux like environment under Windows (although it is not very useful to me), including Bash, Vim, gcc, make and other tools, which can be added and uninstalled through the package manager.
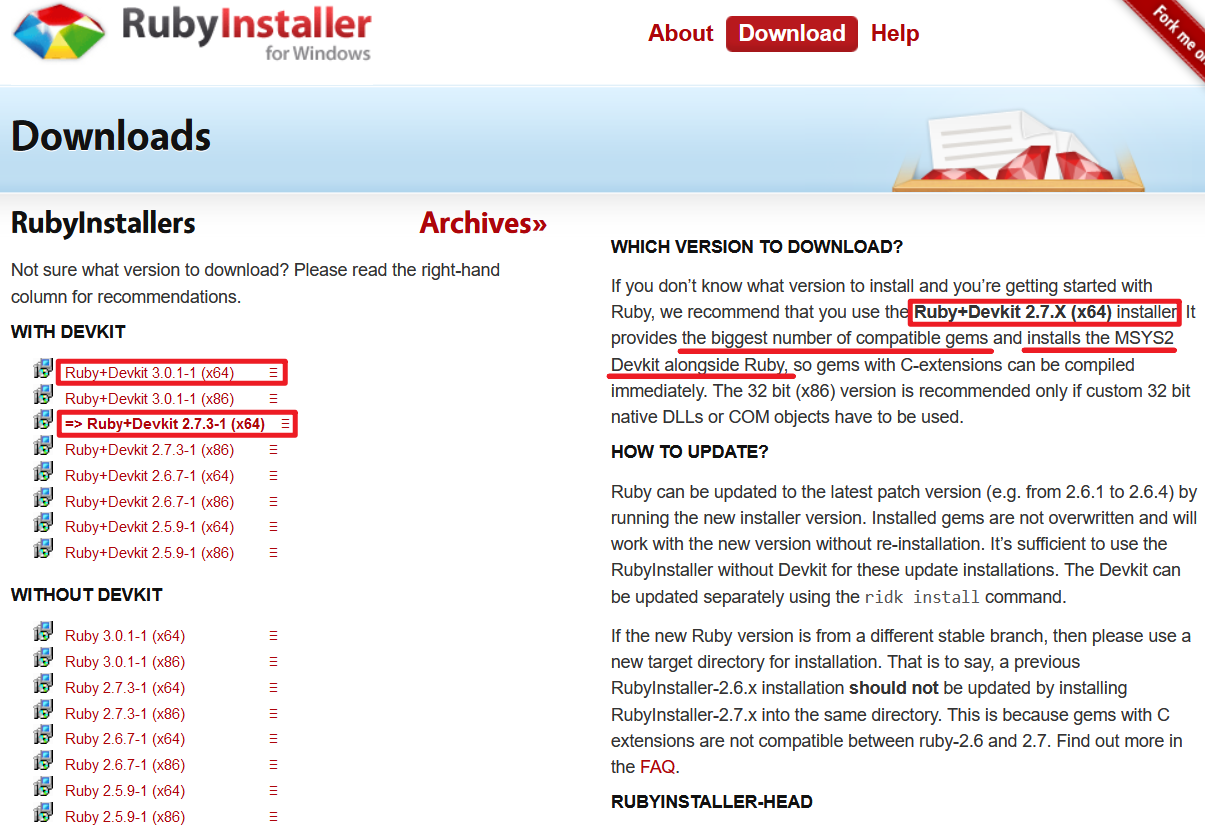
What I choose here is the latest version of Ruby+Devkit 3.0.1-1 (x64). Because the official website is too slow to download for a long time, you can click here Download my shared installation package resources. After downloading, click Run to accept the license first:

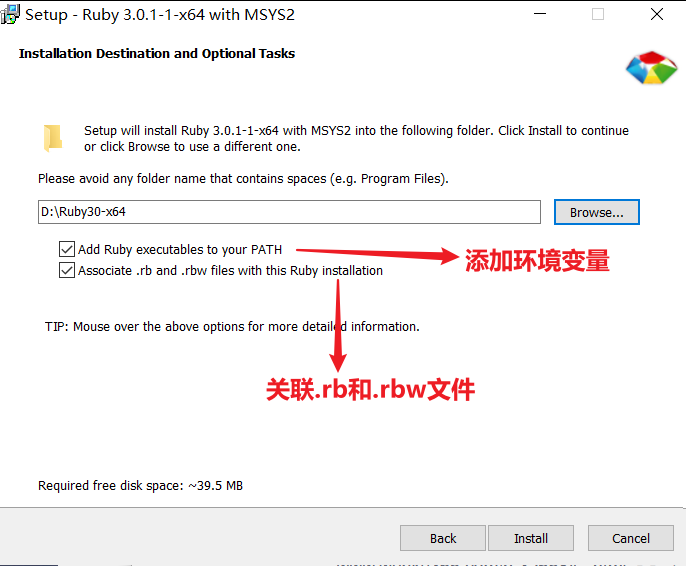
Customize the installation directory, check all two items, and click Install:
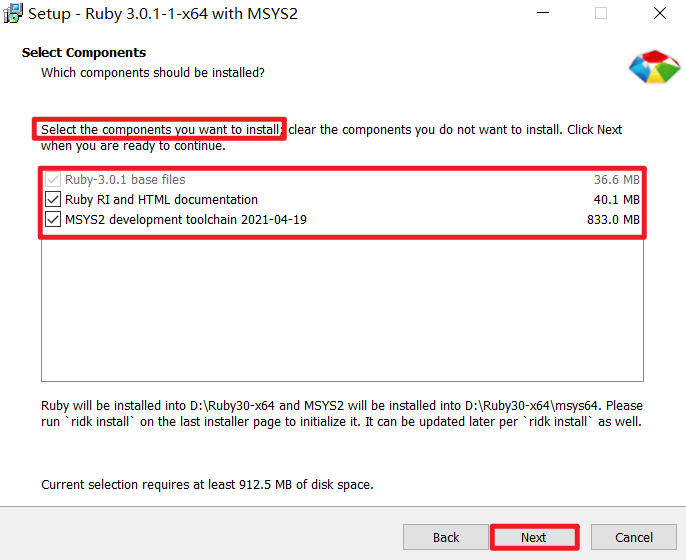
Then select the components to be installed, check all by default, and click Next:
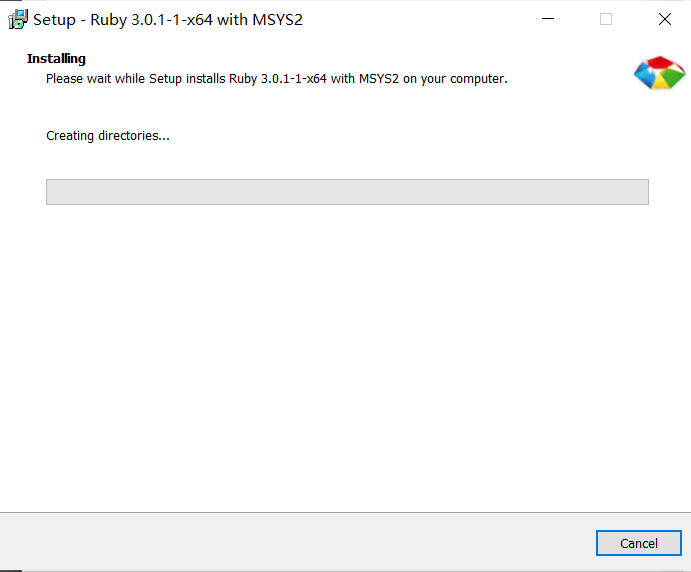
Finally, the installation begins:
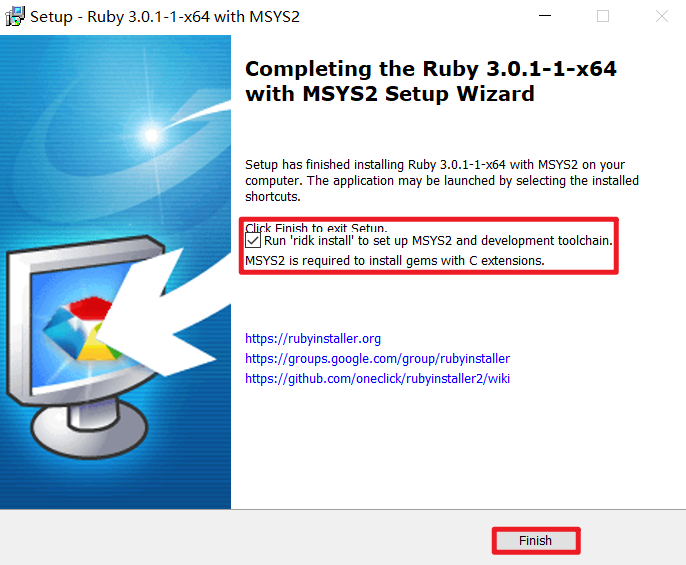
MSYS2 is selected by default. Check this here, and then click Finish:
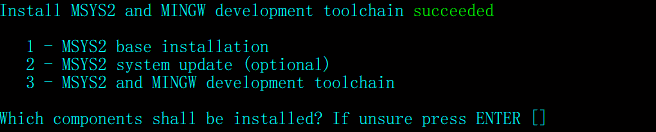
The following interface appears, even if I installed MinGW-w64 before , or to be safe, enter 3 here:
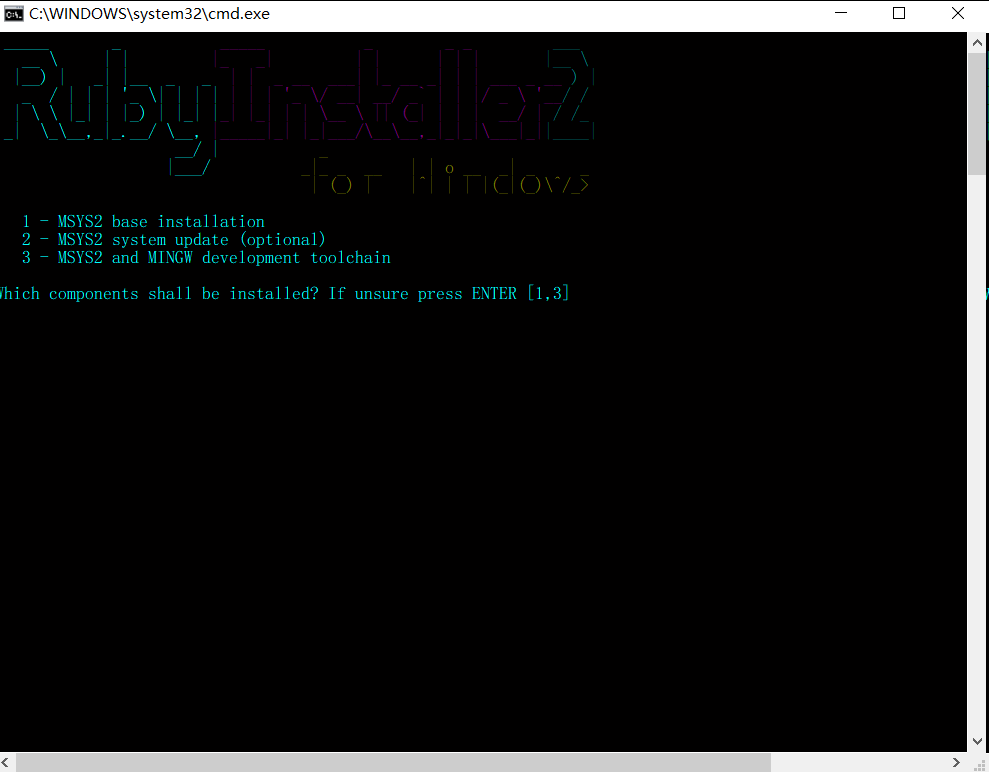
When the following figure finally appears, press enter to exit:
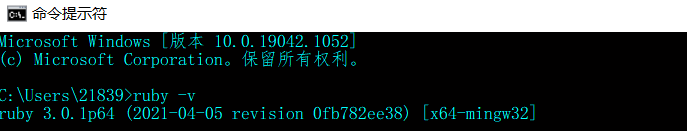
Now, open your command line and enter ruby -v to view the version number of ruby. If it is successful, the installation is successful:
2. Download and install plug-ins
Open VS Code, Ctrl+Shift+X to enter the extension interface, and enter Ruby to install the corresponding plug-in:

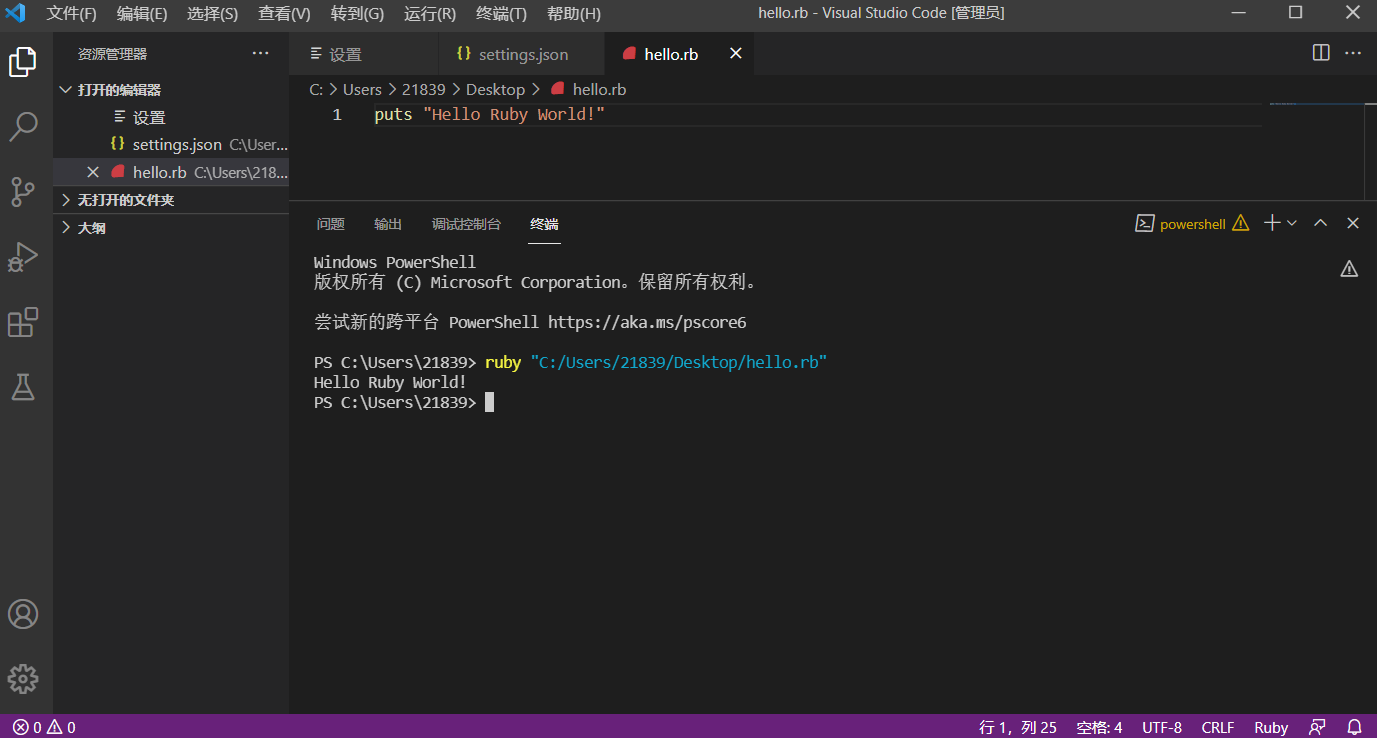
After installing the Ruby plug-in, create a new hello rb :
puts "Hello Ruby World!"
Then run the program in the terminal console of VS Code:
Note that if an error is reported that the "ruby" item cannot be recognized as a cmdlet, function, script file or runnable program, it may be due to insufficient permissions (why?), Find the code of VS Ccode Exe, right-click to select properties, check [run this program with administrator privileges] in compatibility, and then restart VS Code.
3. Install Ruby dependencies
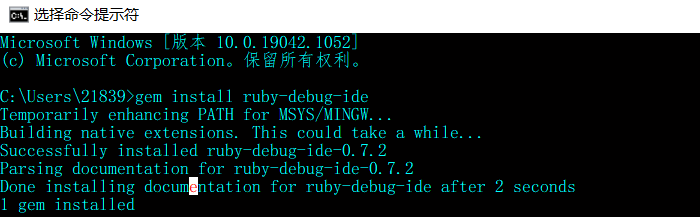
This section refers to the documentation corresponding to the Ruby plug-in: https://github.com/rubyide/vscode-ruby/blob/main/docs/debugger.md . First, enter the following commands in the console to install Ruby dependencies:
> gem install ruby-debug-ide
> gem install debase-ruby_core_source
> gem install debase
> gem install bundler
If this fails, you may need to modify the source of the gem:
gem sources -r / --remove XXX  # Remove installation source
gem sources -a / --add XXX	   # Add source
Then execute the following two commands, first delete the original sources source, then add a new source, and then run the above installation command again:
> gem sources --remove https://rubygems.org/
> gem sources -a https://mirrors.ustc.edu.cn/rubygems/
Execute RDebug ide to view parameters:
> rdebug-ide
Using ruby-debug-base 0.2.5.beta2
Usage: rdebug-ide is supposed to be called from RDT, NetBeans, RubyMine, or
       the IntelliJ IDEA Ruby plugin.  The command line interface to
       ruby-debug is rdebug.

Options:
    -h, --host HOST                  Host name used for remote debugging
    -p, --port PORT                  Port used for remote debugging
        --dispatcher-port PORT       Port used for multi-process debugging dispatcher
        --evaluation-timeout TIMEOUT evaluation timeout in seconds (default: 10)
        --evaluation-control         trace to_s evaluation
    -m, --memory-limit LIMIT         evaluation memory limit in mb (default: 10)
    -t, --time-limit LIMIT           evaluation time limit in milliseconds (default: 100)
        --stop                       stop when the script is loaded
    -x, --trace                      turn on line tracing
        --skip_wait_for_start        skip wait for 'start' command
    -l, --load-mode                  load mode (experimental)
    -d, --debug                      Debug self - prints information for debugging ruby-debug itself
        --xml-debug                  Debug self - sends information <message>s for debugging ruby-debug itself
    -I, --include PATH               Add PATH to $LOAD_PATH
        --attach-mode                Tells that rdebug-ide is working in attach mode
        --key-value                  Key/Value presentation of hash items
        --ignore-port                Generate another port
        --keep-frame-binding         Keep frame bindings
        --disable-int-handler        Disables interrupt signal handler
        --rubymine-protocol-extensions
                                     Enable all RubyMine-specific incompatible protocol extensions
        --catchpoint-deleted-event   Enable chatchpointDeleted event
        --value-as-nested-element    Allow to pass variable's value as nested element instead of attribute
        --socket-path PATH           Listen for debugger on the given UNIX domain socket path

Common options:
    -v, --version                    Show version

Must specify a script to run
4. Write the configuration file under Ruby single file
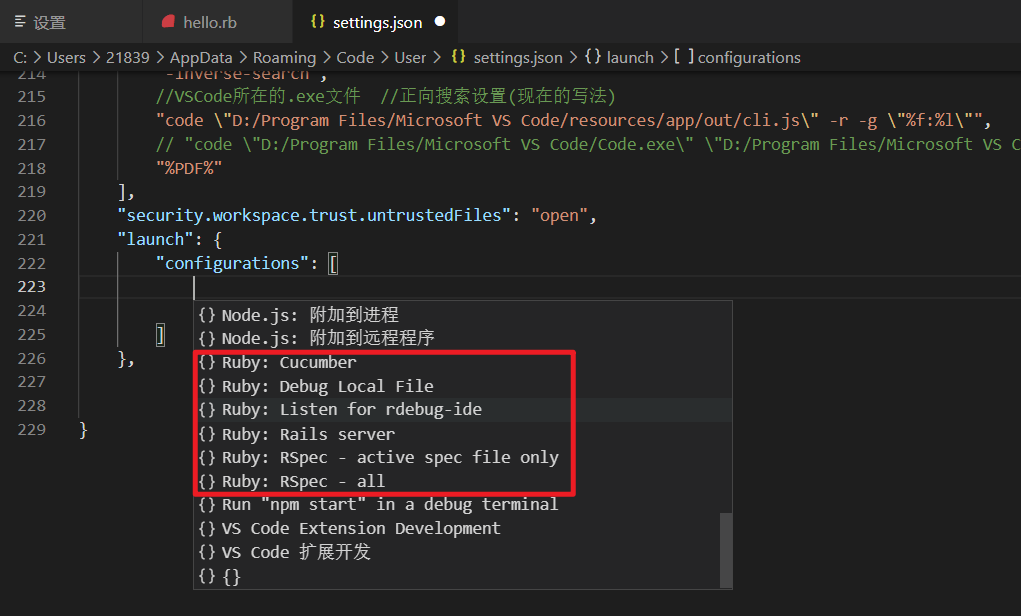
If you want to add a global configuration, you can directly run - > Add configuration without opening the folder, and then jump to the global configuration file settings JSON (for user configuration and workspace configuration, see Article here )- mine
LaTeX
\LaTeX
The LATE # X configuration code is currently in the global configuration file (maybe one day I will create a code_LATE folder, and then
TeX
\TeX
TE # X files are put in, but they are not necessarily converted to workspace configuration):
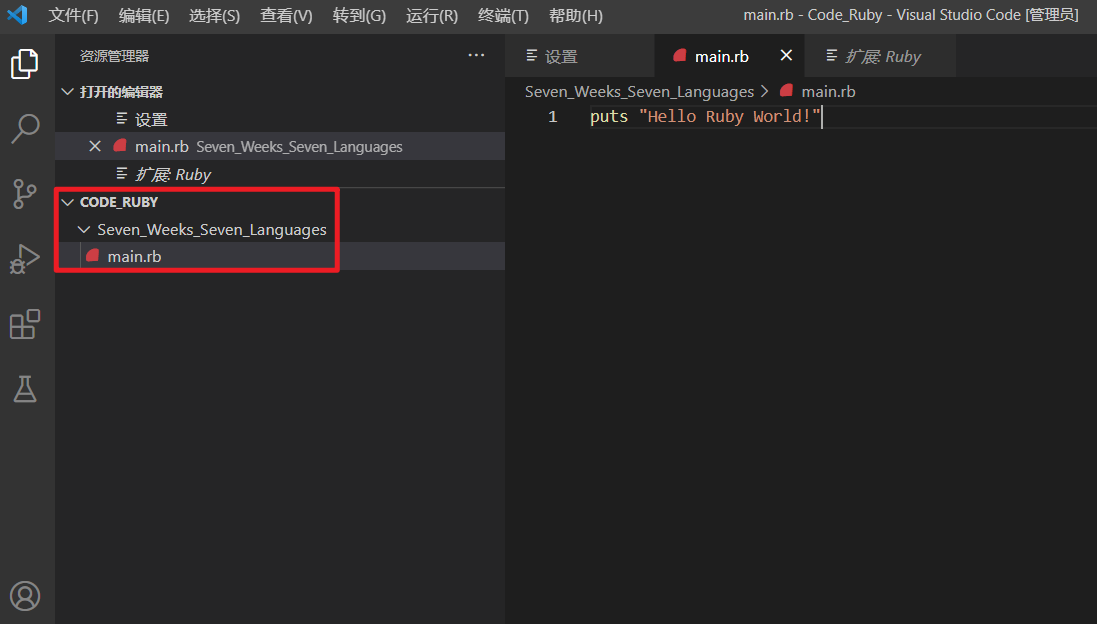
Otherwise, just like me, establish a CodeWorld/Code_Ruby folder, and then open the folder. be similar to Establishment of C/C + + single file language learning environment , first create a named Seven_Weeks_Seven_Languages folder for Study of seven weeks and seven languages.
Then use run - > Add configuration to create it automatically (when the folder is open and the source file exists) vscode folder and launch JSON file. Alternatively, you can click Create launch JSON file:

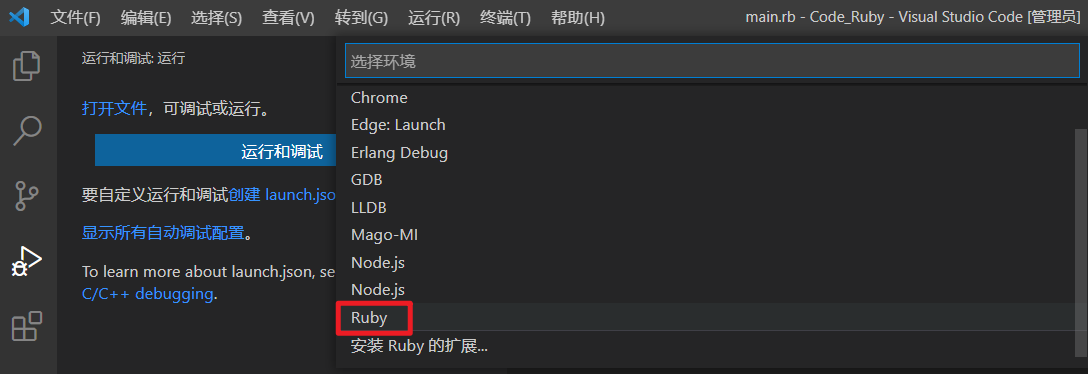
VS Code will try to automatically detect your debugging environment, but if it fails, you need to select it manually. Here we choose Ruby:
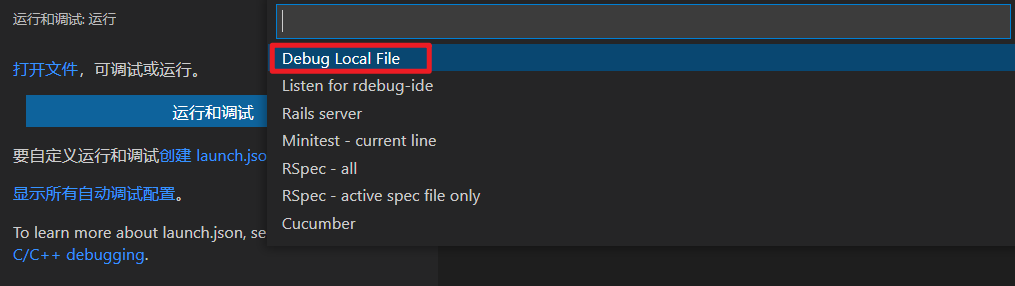
Next, select the name of the generated configuration and select Debug Local File:
Then it generates a launch JSON configuration file for Ruby debugging. Now back to the file browser, you can find that VS Code creates a file vscode folder and add launch JSON file to the workspace.
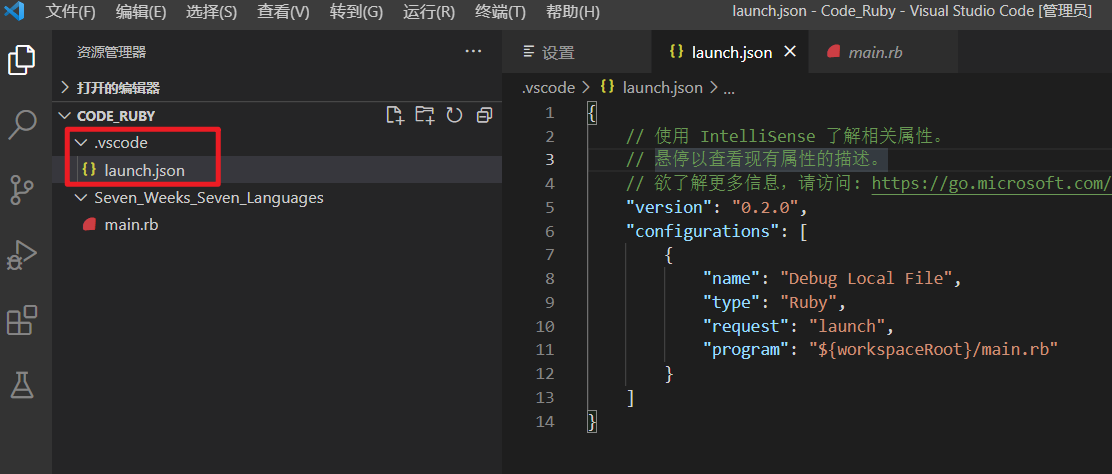 Where launch The contents of the JSON file are as follows:
{
    // Use IntelliSense to understand related properties.
    // Hover to view the description of an existing property.
    // For more information, visit: https://go.microsoft.com/fwlink/?linkid=830387
    "version": "0.2.0",
    "configurations": [
        {
            "name": "Debug Local File",
            "type": "Ruby",
            "request": "launch",
            "program": "${workspaceRoot}/main.rb"
        }
    ]
}
This is only one configuration in the configurations array. We can add as many configurations as we want, as long as their name s are unique. After repeated modifications, I'm at CodeWorld/Code_Ruby vscode/launch. The contents of the JSON file are as follows. I added the comments in configurations myself:
{
    // For more information, visit: https://go.microsoft.com/fwlink/?linkid=830387
    "version": "0.2.0",
    "configurations": [
        {
            //Name is the configuration name in string form, which is displayed in the startup configuration drop-down menu. It must be unique in the configuration array
            "name": "Debug Local File",
            //Type is the configuration type and must be Ruby. Tell VS Code what debugger to run
            "type": "Ruby",
            //Request is the request configuration type, which can be launch (it is allowed to start the provider directly from VS Code),
            //Or attach, which allows you to attach to a remote debug session
            "request": "launch",
            //The working directory of cwd debugger needs to be the folder location where the source file is located (the location indicated by the program string)
            "cwd": "${fileDirname}",
            //Program is the complete path of the program to be debugged and should not depend on the relative path
            //If the file is in your workspace, the program is usually such a string "${workspaceRoot}/path/to/script.rb"
            //-${workspaceRoot} opens the path of the folder in VS Code
            //-${file} currently open file (full path of)
            //-${fileBasename} basename of the currently open file (i.e. file name. Extension)
            //-${fileDirname} dirname of the currently open file
            //-${fileExtname} the extension of the currently open file
            "program": "${fileDirname}/${fileBasename}",
            //When stopOnEntry is set to true, the debugger will pause at the program entrance, which is equivalent to breaking the point on main
            "stopOnEntry": false,
            //Show debugger output shows some additional output information to the debugging terminal, especially about the operation of the RDebug ide
            "showDebuggerOutput": true,
            //args array is a command line parameter provided to the program during program debugging. Each string in it is passed as a separate parameter
            "args": [],
            //env provides environment variables to set before starting the program
            // "env": {
            //     "BASE": "${fileDirname}",
            //     "EXT": "${fileExtname}",
            //     "RAILS_ENV": "test"
            // },
            //If it's not 'Ruby', it's the path to the ruby executable file, which is used to run the program (when there is no debugger)
            //"pathToRuby": "ruby",
            //If 'RDebug ide' is not in the PATH environment variable, you need to provide the absolute PATH value of 'RDebug ide', such as "C: \ ruby \ RDebug ide. Bat"
            "pathToRDebugIDE": "rdebug-ide",
            //"pathToBundler": "bundle"
        },
        {
            "name": "Minitest - current line",
            "type": "Ruby",
            "request": "launch",
            "cwd": "${fileDirname}",
            "program": "${fileDirname}/bin/rails",
            "args": [
                "test",
                "${file}:${lineNumber}"
            ]
        },
        {   //Run Test::Unit only on the currently open test file
            "name": "Test::Unit - open test file",
            "type": "Ruby",
            "request": "launch",
            "cwd": "${fileDirname}",
            "program": "${file}",
            "includes": ["test", "lib"] //Use includes in $LOAD_PATH contains other paths.
        },
        {   //In the currently open file, run Test::Unit on a single selected test
            "name": "Test::Unit - single selected test",
            "type": "Ruby",
            "request": "launch",
            "cwd": "${fileDirname}",
            "program": "${file}",
            "includes": ["test", "lib"],
            "args": [
                "-n",
                "${selectedText}"
            ]
        },
        {   //This will run the rails server in the source file directory, assuming that binstubs has been installed through bundle install -- binstubs
            "name": "Rails server",
            "type": "Ruby",
            "request": "launch",
            "cwd": "${fileDirname}",
            "program": "${fileDirname}/bin/rails",
            "args": ["server"]
        },
        {   //Run all spec s using the additional parameters passed in
            "name": "RSpec - all",
            "type": "Ruby",
            "request": "launch",
            "cwd": "${fileDirname}",
            "program": "${fileDirname}/bin/rspec",
            "args": [
                "-I", "${fileDirname}",
                "--require", "spec_helper",
                "--require", "rails_helper",
                "--format", "documentation",
            ]
        },
        {   //Run RSpec, but only on the currently open spec file
            "name": "RSpec - active spec file only",
            "type": "Ruby",
            "request": "launch",
            "cwd": "${fileDirname}",
            "program": "${fileDirname}/bin/rspec",
            "args": [
                "-I",
                "${fileDirname}",
                "${file}"
            ]
        },
        {   //Run all cuke s
            "name": "Cucumber",
            "type": "Ruby",
            "request": "launch",
            "cwd": "${fileDirname}",
            "program": "${fileDirname}/bin/cucumber"
        },
        // {/ / the configuration for remote debugging is temporarily unavailable
        //     "name": "Listen for rdebug-ide",
        //     "type": "Ruby",
        //     "request": "attach",
        //     "remoteHost": "127.0.0.1",
        //     "remotePort": "1234",
        //     "remoteWorkspaceRoot": "${workspaceRoot}"
        // },
    ]
}
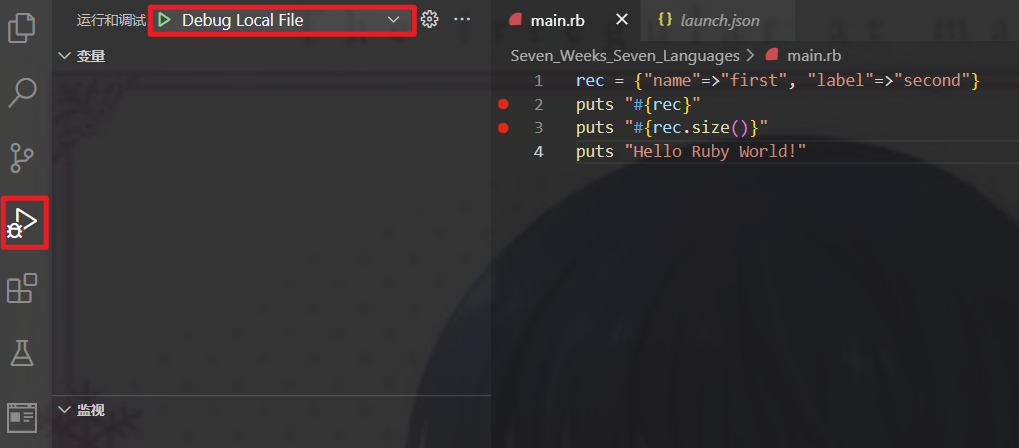
5. Try debugging Ruby code
A very simple Ruby Code:
rec = {"name"=>"first", "label"=>"second"}
puts "#{rec}"
puts "#{rec.size()}"
puts "Hello Ruby World!"
Under the run and debug icons, select Debug Local File:
Click the green triangle to start debugging the program:
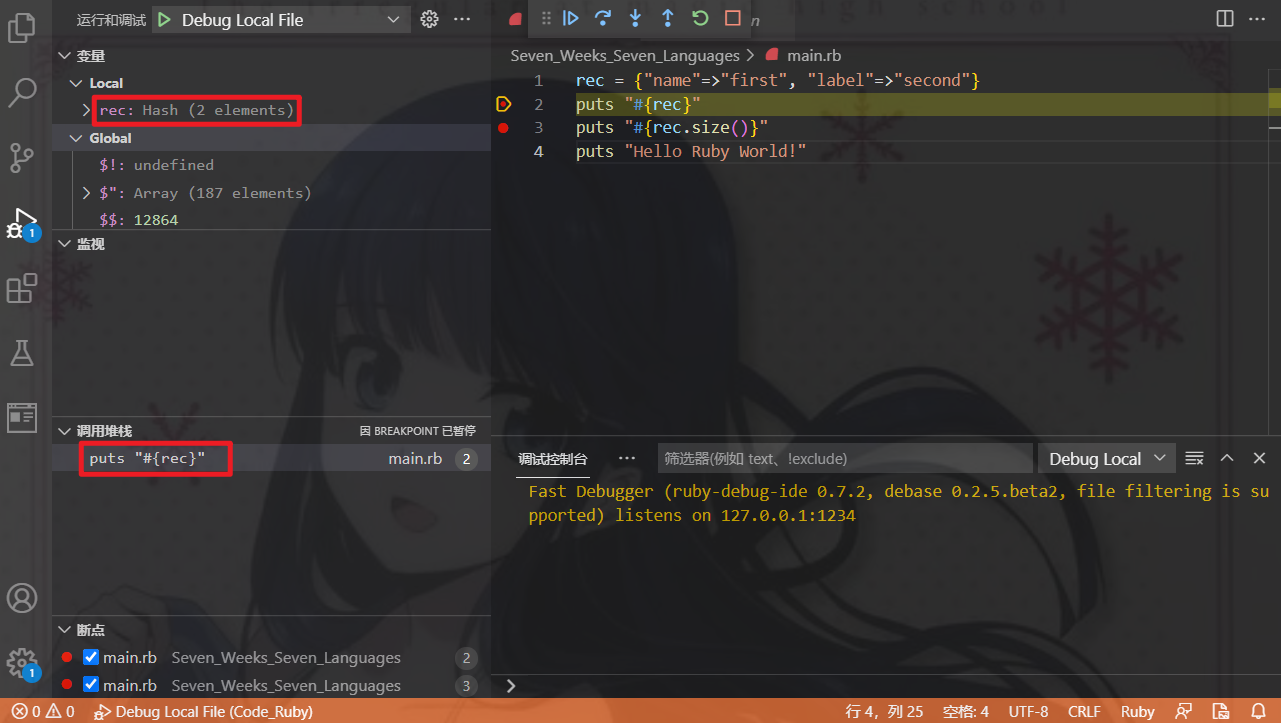
Then move forward:
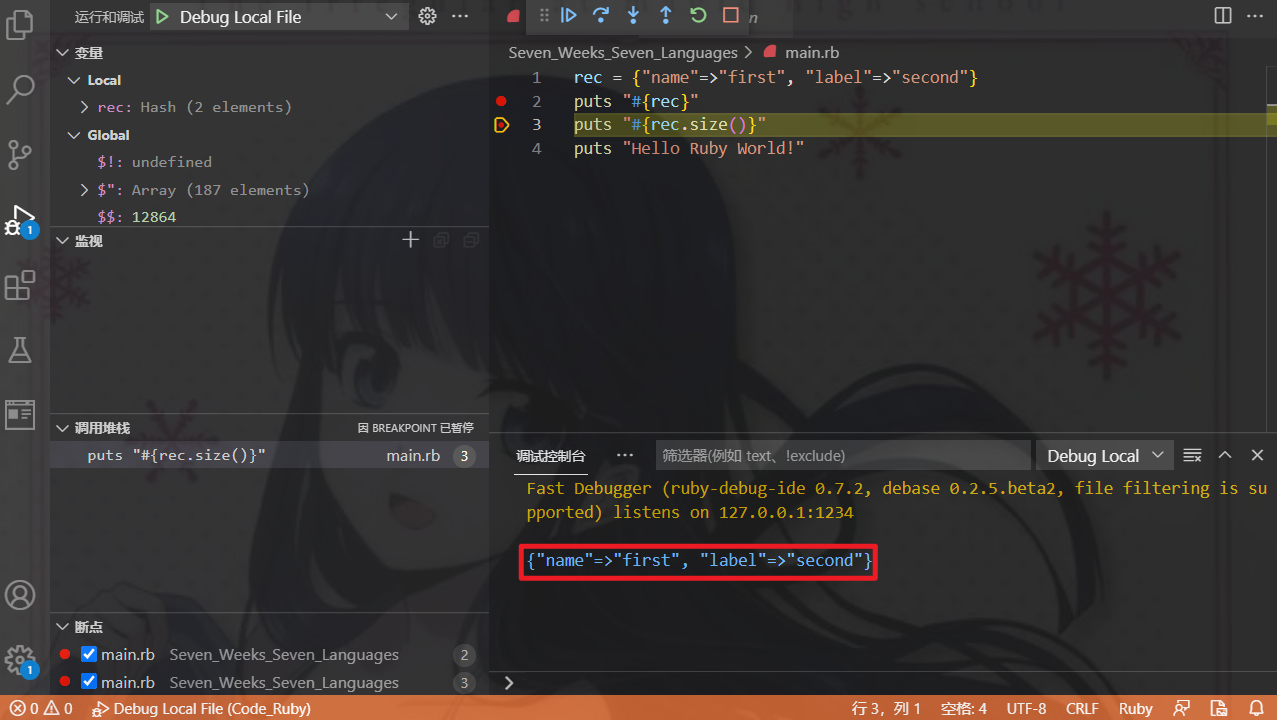
Proceed to the end of the program:
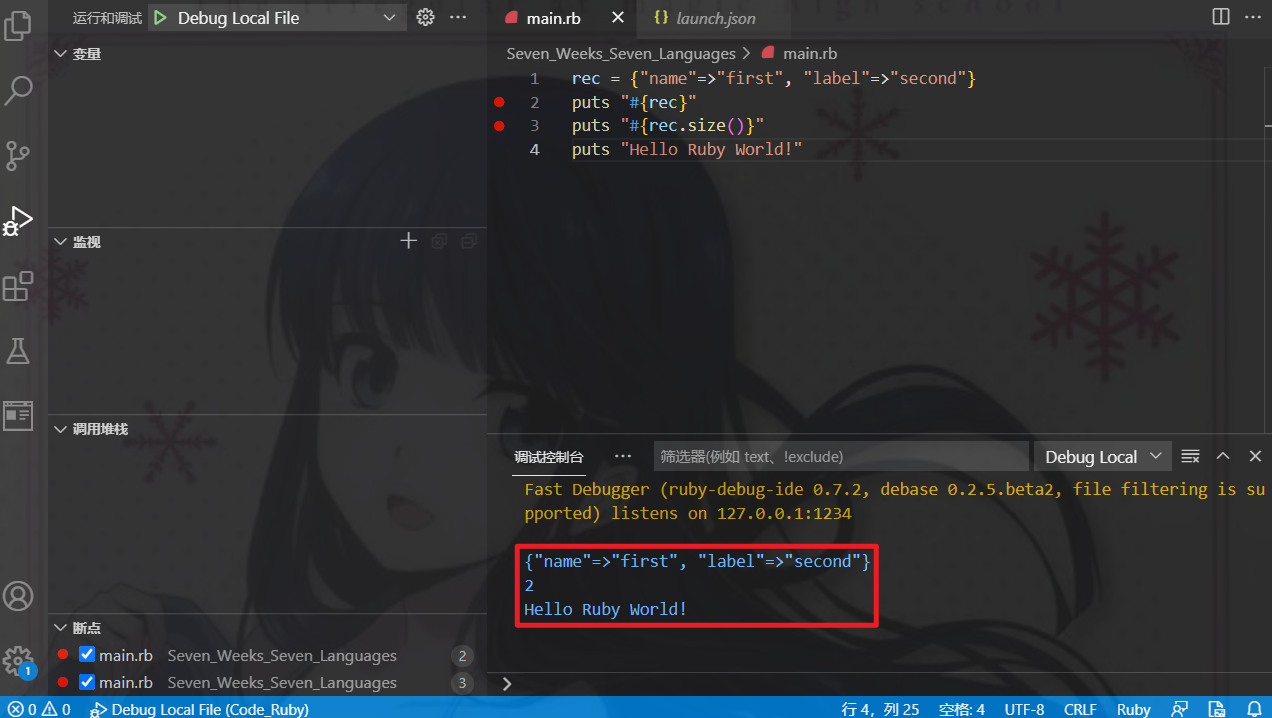
Now we can run and debug Ruby programs!