Official documents
Official document link (after reading it, I feel that I understand, but I don't fully understand.)
Specific use
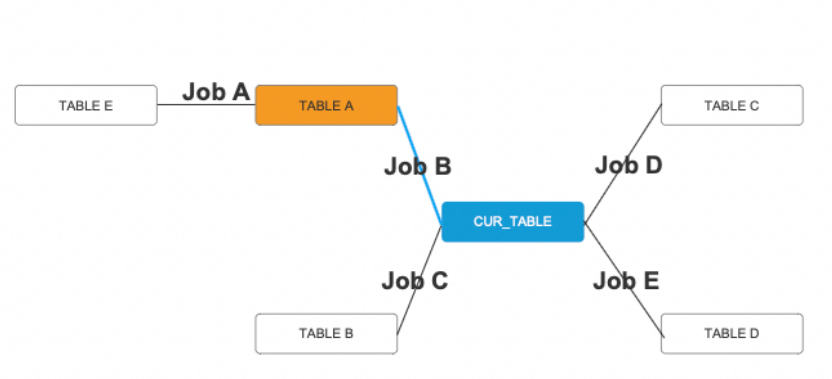
Business requirements

- Making data kinship is probably similar to making ER diagram. At first, I wanted to use the ecarts topology diagram, but ecarts has a positioning problem that has not been understood and can not find a solution. The nodes of ecarts need to customize the location, but we are dynamic data, and the force guidance algorithm does not meet the business needs, so we finally chose antv g6.
Main problems
1. A custom node is required. g6 uses a custom dom node to meet the modification requirements. However, according to the document, the dom node cannot use the click events provided by g6.

- By configuring the node type, make the node point to a user-defined node.
// Highlight the current node and match the custom node by type
if (this.data.nodes[i].highLight == 1) {
	this.data.nodes[i].type = 'center'
} else {
	this.data.nodes[i].type = 'dom-node'
}
- Custom dom node
G6.registerNode(
	'dom-node', {
		draw: (cfg, group) => {
			// console.log(cfg, group)
			const shape = group.addShape('dom', {
				attrs: {
					width: cfg.size[0],
					height: cfg.size[1],
					// html passed into DOM
					html: `
					<div onclick="select(${cfg.name})" id="${cfg.select}" class="dom-node-style" style="cursor:pointer; border-radius: 5px; width: ${
					  cfg.size[0] - 5
					}px; height: ${cfg.size[1] - 5}px; display: flex;">

					  <span style="margin:auto; padding:auto; color: #000">${cfg.id}</span>
					</div> `,
				},

				draggable: true,
			});
			return shape;
		},
	},
	'single-node',
);
// Current table node
G6.registerNode(
	'center', {
		draw: (cfg, group) => {
			// console.log(cfg)
			const shape = group.addShape('dom', {
				attrs: {
					width: cfg.size[0],
					height: cfg.size[1],
					// HTML ${CFG. Isactive? "Class ='selected-style '": "class ='node-style'"} passed into DOM“
					html: `
						<div onclick="select(${cfg.name})" id="${cfg.select}" class="node-style" style="width: ${
						  cfg.size[0] - 5
						}px; height: ${cfg.size[1] - 5}px; display: flex;border-radius: 5px;cursor:pointer;">
						  <span style="margin:auto; padding:auto; color: #000">${cfg.id}</span>
						</div> `,
				},

				draggable: true,
			});
			return shape;
		},

	},
	'single-node',
);
2. Adjust the status style, and change the style when you click a node or line.
- The default line can be configured directly. See the document for details
defaultEdge: {
	style: {
		endArrow: true,
		lineWidth: 2,
		stroke: '#CED4D9',
		fill: "#CED4D9",
	},
},
edgeStateStyles: {
	click: {
		lineWidth: 2,
		stroke: '#5394ef',
		fill: "#5394ef",
	},
},
// Edge click event
graph.on('edge:click', (e) => {
	// First, set all edges that are currently in click state to non click state
	const clickEdges = graph.findAllByState('edge', 'click');
	clickEdges.forEach((ce) => {
		graph.setItemState(ce, 'click', false);
	});
	const item = e.item; // Gets the edge element object entered by the mouse
	const jobId = item._cfg.model.jobId
	graph.setItemState(item, 'click', true); // Set the click status of the current edge to true
	that.getLineInfo(jobId)
});
- Custom dom nodes need to dynamically change the class attribute to change the style. No better solution has been found yet. Welcome to communicate!
// Node click event
let that = this;
window.select = function(id) {
	const clickEdges = graph.findAllByState('edge', 'click');
	clickEdges.forEach((ce) => {
		graph.setItemState(ce, 'click', false);
	});
	that.getNodeInfo(id)
	var divId = 'temp' + id
	// Get the currently selected div, click this div to replace the selected style, and all other div to restore the unselected style
	var selectId = document.getElementById(divId)
	for (let i in that.data.nodes) {
		if (that.data.nodes[i].name == id) {
			// if (that.data.nodes[i].isActive == false) {
				selectId.setAttribute('class', 'selected-style')
				that.data.nodes[i].isActive = true
			// }
		} else {
			let tempId = document.getElementById('temp' + that.data.nodes[i].name)
			if (that.data.nodes[i].type == 'dom-node') {
				tempId.setAttribute('class', 'dom-node-style')
			} else {
				tempId.setAttribute('class', 'node-style')
			}
			that.data.nodes[i].isActive = false
		}
	}
}
3. How do I destroy canvases?
- Judge before each data request. If there is already data, destroy the canvas.
// Avoid rendering data multiple times and destroy canvas
if (this.chart !== '') {
	this.chart.destroy()
}
- Assign this before rendering g6 chart = graph
4. The interactive mode is used. The default mode includes the behavior of clicking on the selected node and dragging the canvas. When triggered, the canvas will be re rendered, resulting in the cancellation of the state style set by the custom dom node. (custom dom nodes are written in draw, and changing the state style of dom nodes, such as changing color after selection, is realized by dynamically changing the class attribute). This problem has not been solved at present.
5. For the layout problem, g6 also uses the user-defined node location, but provides the dagre hierarchical layout, which can meet the requirements.
layout: {
	type: 'dagre', //Hierarchical layout
	rankdir: 'LR', // Optional. It defaults to the center of the graph
	align: 'DL', // Optional
	nodesep: 25, // Optional
	ranksep: 25, // Optional
	controlPoints: true, // Optional
},
Complete code

<script>
    //Introducing g6
	import G6 from '@antv/g6';
	import {
		getGraphData,
		getLineInfo,
		getNodeInfo
	} from '@/api/home/assetCatalogueDetail'
	export default {
		data() {
			return {
				id: 0,
				type:0,//0-all consanguinity, 1-immediate father and son, 2-all parent tables, 3-all child tables
				activeName:'first',
				chart: '',
				visible: true,
				nodeList: [],
				lineList: [],
				data: {
					// point set
					nodes: [],
					// Edge set
					edges: [],
				}
			}
		},
		methods: {
			init(id) {
				this.id = id
				this.getData()
			},
			getData() {
				// Avoid rendering data multiple times and destroy canvas
				if (this.chart !== '') {
					this.chart.destroy()
				}
				this.getNodeInfo(this.id)
				getGraphData(Object.assign({
					basicDataId:this.id,
					relationType: this.type
				})).then(response => {
					this.data.nodes = response.data.data.node
					this.data.edges = response.data.data.line
					// console.log(this.data)
					for (let i in this.data.nodes) {
						// g6 id represents the node name
						let name = this.data.nodes[i].name
						let id = this.data.nodes[i].id
						this.data.nodes[i].id = name
						this.data.nodes[i].name = id
						// Set the connection point of the node. anchorPoint refers to the relative position of the edge connected to the node, that is, the intersection position of the node and its related edges
						this.data.nodes[i].anchorPoints = [
							[0.5, 0],
							[1, 0.5],
							[0, 0.5],
							[0.5, 1],
						]
						this.data.nodes[i].select = 'temp' + id
						this.data.nodes[i].isActive = false
						this.data.nodes[i].size = [120, 40]
						// Highlight the current node and match the custom node by type
						if (this.data.nodes[i].highLight == 1) {
							this.data.nodes[i].type = 'center'
						} else {
							this.data.nodes[i].type = 'dom-node'
						}
					}

					this.renderView()
				})
			},
			renderView() {
				G6.registerNode(
					'dom-node', {
						draw: (cfg, group) => {
							// console.log(cfg, group)
							const shape = group.addShape('dom', {
								attrs: {
									width: cfg.size[0],
									height: cfg.size[1],
									// html passed into DOM
									html: `
									<div onclick="select(${cfg.name})" id="${cfg.select}" class="dom-node-style" style="cursor:pointer; border-radius: 5px; width: ${
									  cfg.size[0] - 5
									}px; height: ${cfg.size[1] - 5}px; display: flex;">

									  <span style="margin:auto; padding:auto; color: #000">${cfg.id}</span>
									</div> `,
								},

								draggable: true,
							});
							return shape;
						},
					},
					'single-node',
				);
				// Current table node
				G6.registerNode(
					'center', {
						draw: (cfg, group) => {
							// console.log(cfg)
							const shape = group.addShape('dom', {
								attrs: {
									width: cfg.size[0],
									height: cfg.size[1],
									// HTML ${CFG. Isactive? "Class ='selected-style '": "class ='node-style'"} passed into DOM“
									html: `
										<div onclick="select(${cfg.name})" id="${cfg.select}" class="node-style" style="width: ${
										  cfg.size[0] - 5
										}px; height: ${cfg.size[1] - 5}px; display: flex;border-radius: 5px;cursor:pointer;">
										  <span style="margin:auto; padding:auto; color: #000">${cfg.id}</span>
										</div> `,
								},

								draggable: true,
							});
							return shape;
						},

					},
					'single-node',
				);

				const graph = new G6.Graph({
					renderer: 'svg', //When using Dom node, you need to use svg to render the situation
					container: 'mountNode',
					width: 800,
					height: 500,
					layout: {
						type: 'dagre', //Hierarchical layout
						rankdir: 'LR', // Optional. It defaults to the center of the graph
						align: 'DL', // Optional
						nodesep: 25, // Optional
						ranksep: 25, // Optional
						controlPoints: true, // Optional
					},
					defaultEdge: {
						style: {
							endArrow: true,
							lineWidth: 2,
							stroke: '#CED4D9',
							fill: "#CED4D9",
							// cursor:'pointer'
						},
					},
					edgeStateStyles: {
						click: {
							lineWidth: 2,
							stroke: '#5394ef',
							fill: "#5394ef",
						},
					},
					modes: {
						default: [
							// 'drag canvas', / / drag the canvas
							// 'zoom canvas', / / Zoom canvas
						]
					},
					fitCenter: true, //Pan to center aligns to the center of the canvas, but does not zoom

				});
				// Node click event
				let that = this;
				window.select = function(id) {
					const clickEdges = graph.findAllByState('edge', 'click');
					clickEdges.forEach((ce) => {
						graph.setItemState(ce, 'click', false);
					});
					that.getNodeInfo(id)
					var divId = 'temp' + id
					// Get the currently selected div, click this div to replace the selected style, and all other div to restore the unselected style
					var selectId = document.getElementById(divId)
					for (let i in that.data.nodes) {
						if (that.data.nodes[i].name == id) {
							// if (that.data.nodes[i].isActive == false) {
								selectId.setAttribute('class', 'selected-style')
								that.data.nodes[i].isActive = true
							// }
						} else {
							let tempId = document.getElementById('temp' + that.data.nodes[i].name)
							if (that.data.nodes[i].type == 'dom-node') {
								tempId.setAttribute('class', 'dom-node-style')
							} else {
								tempId.setAttribute('class', 'node-style')
							}
							that.data.nodes[i].isActive = false
						}
					}
				}
				// Edge click event
				graph.on('edge:click', (e) => {
					// First, set all edges that are currently in click state to non click state
					const clickEdges = graph.findAllByState('edge', 'click');
					clickEdges.forEach((ce) => {
						graph.setItemState(ce, 'click', false);
					});
					const item = e.item; // Gets the edge element object entered by the mouse
					const jobId = item._cfg.model.jobId
					graph.setItemState(item, 'click', true); // Set the click status of the current edge to true
					that.getLineInfo(jobId)
				});
				this.chart = graph
				graph.data(this.data); // Read the data source in Step 2 to the diagram
				graph.render(); // Rendering
				// graph.fitView();
			},
			getNodeInfo(value) {
				this.visible = true
				getNodeInfo(Object.assign({
					id: value,
					curId: this.id
				})).then(response => {
					this.nodeList = response.data.data
					// console.log(this.nodeList)
				})
			},
			getLineInfo(value) {
				this.visible = false
				getLineInfo(value).then(response => {
					this.lineList = response.data.data
					// console.log(this.lineList)
				})
			},

		}
	}
</script>

<style>
	.node-style {
		background-color: #fff;
		border: 1px solid #5B8FF9;
	}

	.selected-style {
		background-color: orange;
	}

	.dom-node-style {
		background-color: #fff;
		border: 1px solid #000;
	}
</style>