When we play games, because everyone's device configuration is different, we sometimes pay great attention to the change of frame rate in the game. Because the lower the configuration or the poor optimization of the game program itself, it is easy to reduce the frame rate in the process of the game. The lower the frame rate, the easier it is to get stuck. So can we also detect and monitor the FPS frame rate of the website?
The browser's rendering method for web pages is actually different from that in the game. In the game, because the picture is constantly changing, it needs continuous rendering to form a smooth picture. But the web pages in the browser are different. If you don't do some operations, the content displayed on the web page may not change, so you don't need real-time rendering.
fps is mainly used to measure the performance of animation, specifically to the page, that is, the performance of page animation, not the performance of the whole page. Picture sliding is animation, and page scrolling is also animation in essence. When the page is still and there is no other animation, it is inappropriate to measure it with fps.
However, fps frame rate, as one of the web page performance measurement standards, can not be ignored in some business scenarios. We can monitor web pages in the following ways:
1. Monitoring through chrome developer tools.
2. This is achieved by adding Javascript code to the page.
3. Rapid integrated monitoring through third-party monitoring tool probes.
Method 1. Monitor through the chrome developer tool
This method is generally used in the development phase:
1. First, press F12 in the Chrome browser to open the chrome developer tool - performance, and click the reload button.
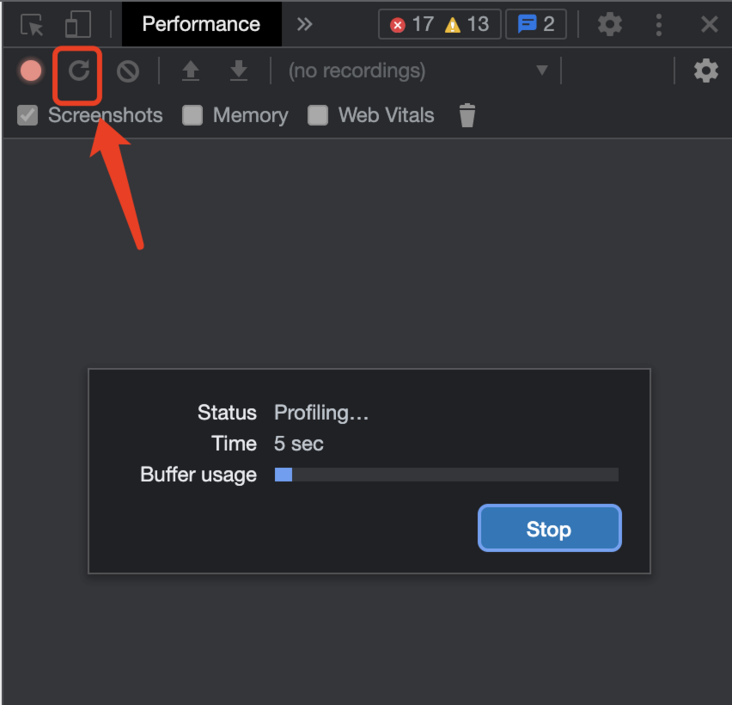
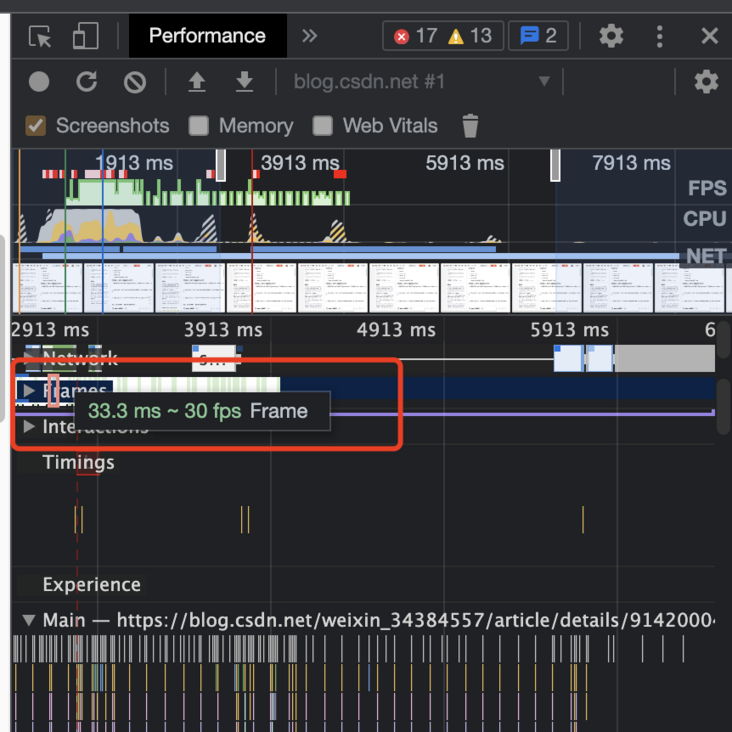
2. After loading, you can see the analysis results of each dimension in the figure below, but this is not the focus of our discussion today.
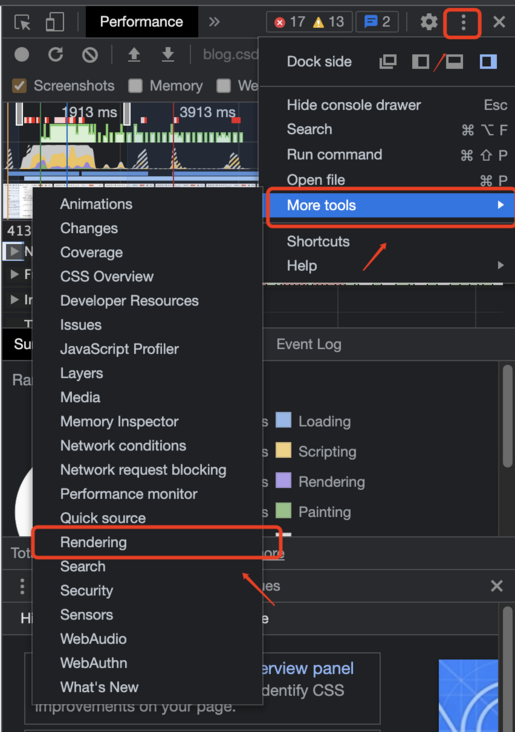
3. Click the toolbar in the upper left corner, find rendering in More tools, and check FPS meter
Method 2: by adding a Javascript code to the web page, the fps value of the current web page will be displayed in the upper left corner of the page.
demo:
<!DOCTYPE html>
<html lang="zh-cn">
<head>
<meta charset="UTF-8" />
<meta http-equiv="X-UA-Compatible" content="IE=edge" />
<meta name="viewport" content="width=device-width, initial-scale=1.0" />
<title>FPS Test Page</title>
</head>
<body>
<script>
// Create fps panel presentation elements
var fpsPanel = document.createElement("div");
fpsPanel.setAttribute("id", "fps");
fpsPanel.style.position = "fixed";
fpsPanel.style.left = "3px";
fpsPanel.style.top = "3px";
fpsPanel.style.color = "red";
fpsPanel.style.zIndex = 10000;
// Insert the panel into the body
document.body.append(fpsPanel);
// Implementation of fps monitoring logic
var showFPS = (function () {
var requestAnimationFrame =
window.requestAnimationFrame ||
window.webkitRequestAnimationFrame ||
window.mozRequestAnimationFrame ||
window.oRequestAnimationFrame ||
window.msRequestAnimationFrame ||
function (callback) {
window.setTimeout(callback, 1000 / 60);
};
var e, pe, pid, fps, last, offset, step, appendFps;
fps = 0;
last = Date.now();
step = function () {
offset = Date.now() - last;
fps += 1;
if (offset >= 1000) {
last += offset;
appendFps(fps);
fps = 0;
}
requestAnimationFrame(step);
};
appendFps = function (fps) {
// Print fps
console.log(fps + "FPS");
// Modify the values displayed in the panel
fpsPanel.innerHTML = fps + "FPS";
};
step();
})();
</script>
</body>
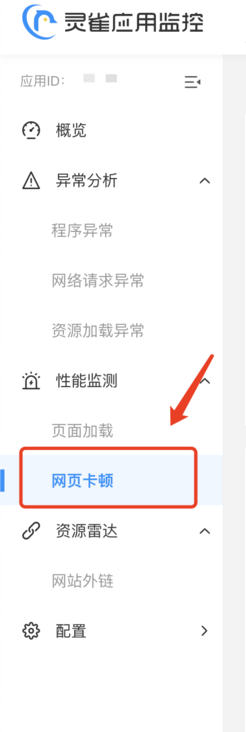
</html>Mode 3. Through the third-party monitoring tools, I choose the free lingque application monitoring platform here( https://perf.51.la ), the function, operation and interface are relatively simple and easy to understand, and it is convenient to view data. It is also an old statistical service provider. The service stability and technology are still guaranteed, and it also supports spa pages, such as Vue The page written in JS can also be easily accessed. Interested students can learn about it.
This monitoring tool is very simple. You just need to create an application and add code to the website.
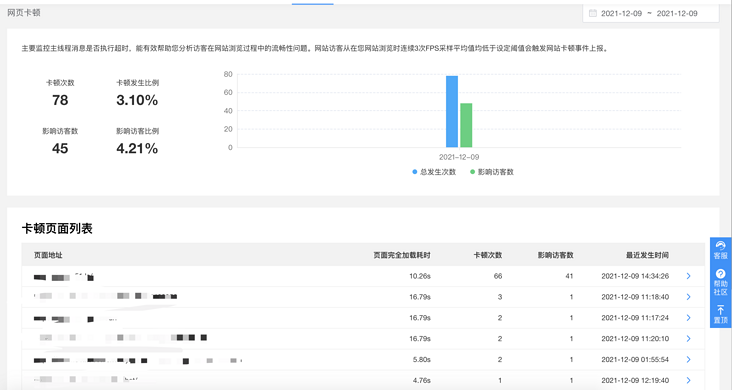
Overall, it is quite convenient to use. I recommend you to use it.