1, Background of the topic
Mobile phone itself is not a standard, so there will eventually be products with different thickness, and thickness has become an important parameter in mobile phone products. It is this parameter that various manufacturers rack their brains in order to reduce the cost. First of all, from the perspective of marketing and positioning, mobile phones are thinner than people. The two decimal places after the decimal point may be a key point to seize the first mind of users. Now that information is so explosive, the first mind is extremely important. Use the crawler tool to crawl the thickness ranking data of the mobile phone, and then visually output the analysis results.
2, Thematic web crawler design
1. Name of themed web crawler: crawling mobile phone thickness ranking
2. Content and data feature analysis of topic web crawler
Climb the mobile phone thickness ranking, and select the ranking, name and thickness for data analysis
3. Overview of thematic web crawler design scheme (including implementation ideas and technical difficulties)
Implementation idea: import the required library, obtain the interface, analyze the data, save the data to the csv file, and then visually analyze the data according to the crawled data.
Technical difficulties: find and import relevant Libraries
3, Analysis on the structural characteristics of theme pages
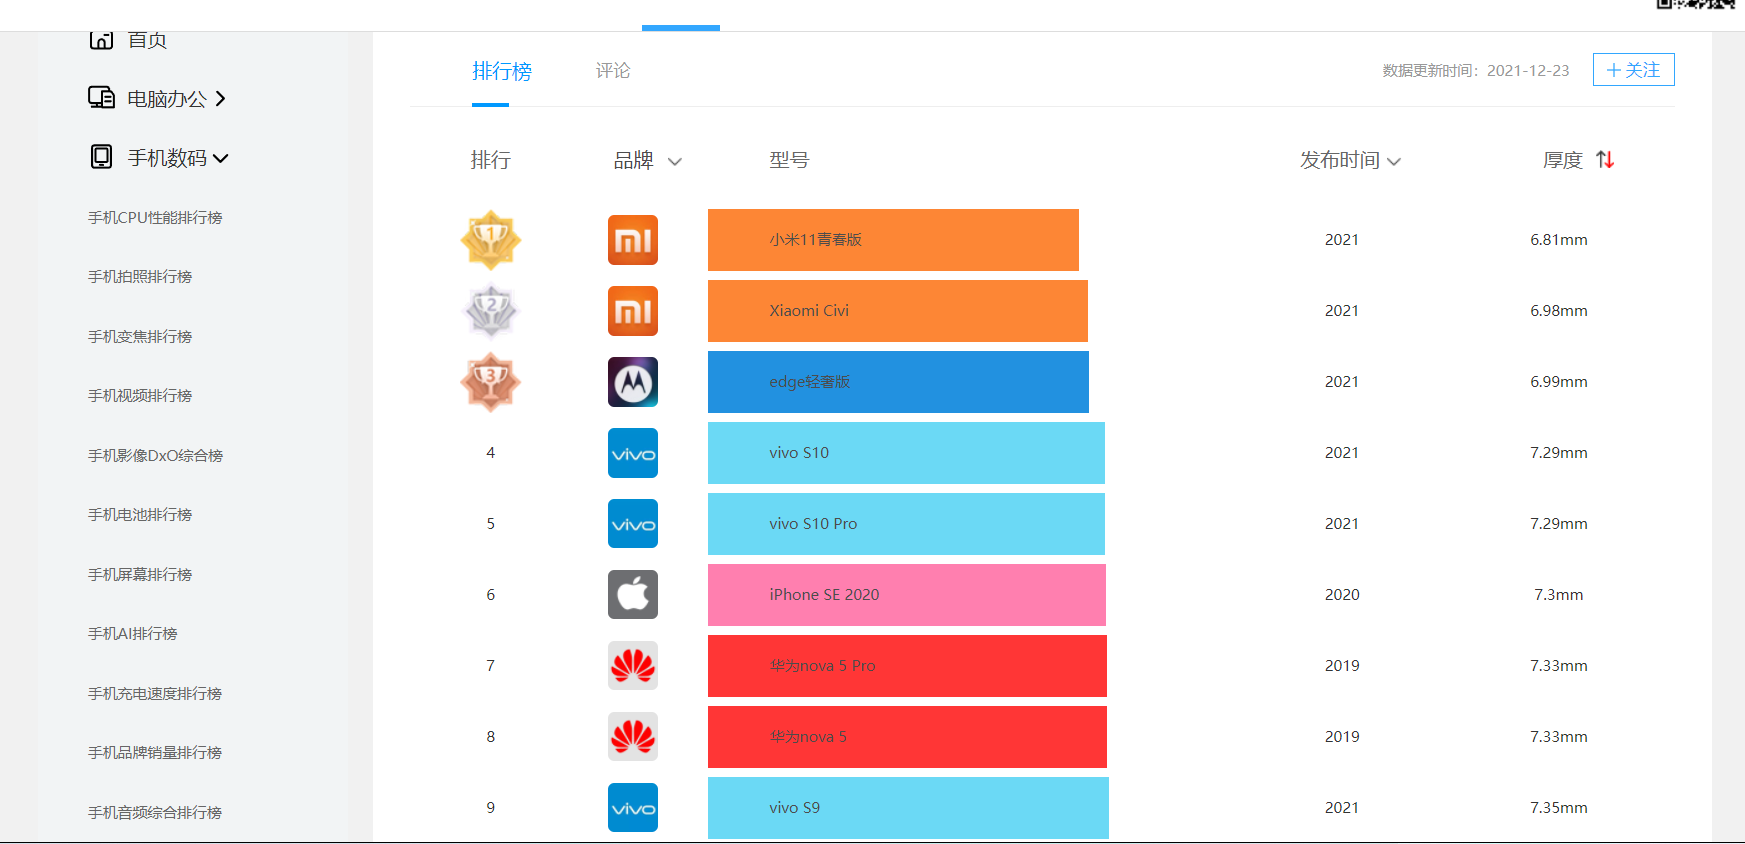
Crawl website: Mobile phone thickness ranking - fast technology ladder list (kkj.cn)
1. Structure and feature analysis of theme page
2. HTML page parsing

4, Web crawler programming
1. Data crawling and acquisition
 1 #-*- coding = utf-8 -*-
 2 from bs4 import BeautifulSoup
 3 #Perform web page parsing
 4
 5 import re
 6 #Text matching
 7
 8 import urllib.request,urllib.error
 9 #formulate URL,Get web page data
10
11 import xlwt
12 #conduct excel operation
13
14 import sqlite3
15 #conduct SQLite Database operation
16
17
18 def getData(url):
19     datalist = []
20     html = askURL(url)
21     soup = BeautifulSoup(html,"html.parser")
22     i=1
23     for item in soup.find_all('tr', class_="list_tr"):
24         data = []
25         item = str(item)
26
27         pm = i
28         i=i+1
29         data.append(pm)
30
31         findbt = re.compile(r'href="javascript:;".*>(.*?)</a>')
32         bt = re.findall(findbt, item)[0]
33         data.append(bt)
34         findrs = re.compile(r'class="mark1">(.*?)</li>')
35         rs = re.findall(findrs, item)[0].replace("mm","")
36         data.append(rs)
37         datalist.append(data)
38         if i==31:
39             break
40     return datalist
41
42
43 def askURL(url):
44     head = {
45         "User-Agent": "Mozilla / 5.0 (Windows NT 10.0; Win64; x64) AppleWebKit/537.36(KHTML, like Gecko) Chrome / 96.0.4664.110 Safari / 537.36"
46     }
47     request = urllib.request.Request(url, headers=head)
48     html = ""
49     try:
50         response = urllib.request.urlopen(request)
51         html = response.read().decode("utf-8")
52     except urllib.error.URLError as e:
53         if hasattr(e, "code"):
54             print(e.code)
55
56         if hasattr(e, "reason"):
57             print(e.reason)
58
59     return html
60
61 url = "https://rank.kkj.cn/Phone63.shtml"
62 getData(url)
63 print("Climb over!")
64
65
66
67 url = ("https://rank.kkj.cn/Phone63.shtml")
68 html=askURL(url)
69 datalist = getData(url)
70 print(datalist)
71 print("Climb over!")
72 savepath = ".\\Mobile phone thickness ranking.xls"
73 book = xlwt.Workbook(encoding="utf-8",style_compression=0)
74     #establish workbook object
75 sheet = book.add_sheet('Mobile phone thickness ranking',cell_overwrite_ok=True)
76
77     #Create worksheet
78 col = ("ranking","Phone name","Mobile phone thickness")
79
80 for i in range(0,3):
81     sheet.write(0,i,col[i]) #Listing
82
83 for i in range(0,30):
84
85         #test print("The first%d strip" %(i+1))
86
87     data = datalist[i]
88     for j in range(0,3):
89         sheet.write(i+1,j,data[j])
90             #data
91
92 book.save(savepath)
93
94 print('Exported table!')

2. Clean and process the data
Import data
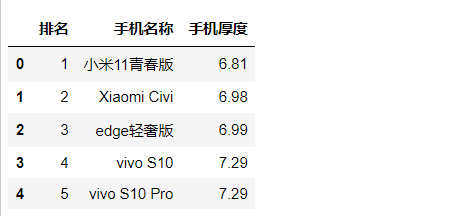
1 #Import data
2 import pandas as pd
3 import numpy as np
4 import seaborn as sns
5 import sklearn
6 #Import data
7 ranking=pd.DataFrame(pd.read_excel(r'C:\Users\liuquanwang\Desktop\Mobile phone thickness ranking.xls'))
8 #Display the first five rows of data
9 ranking.head()
Find duplicate values
1 # find duplicate values2 ranking duplicated()

Delete duplicate values
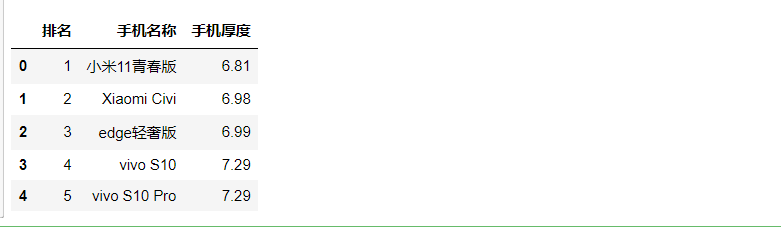
1 #Delete duplicate values
2 ranking=ranking.drop_duplicates()
3 #First five lines of output data
4 ranking.head()
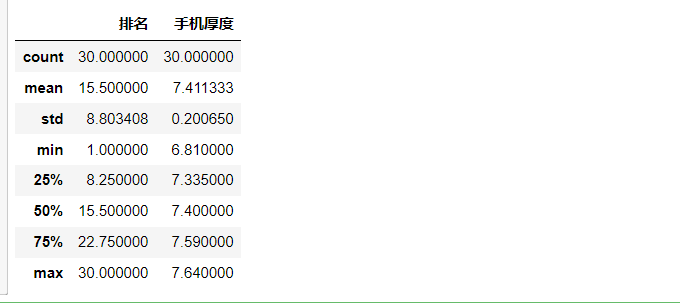
Outlier query
1 # outlier query 2 ranking describe()
3. Text analysis (optional): jieba word segmentation, wordcloud visualization
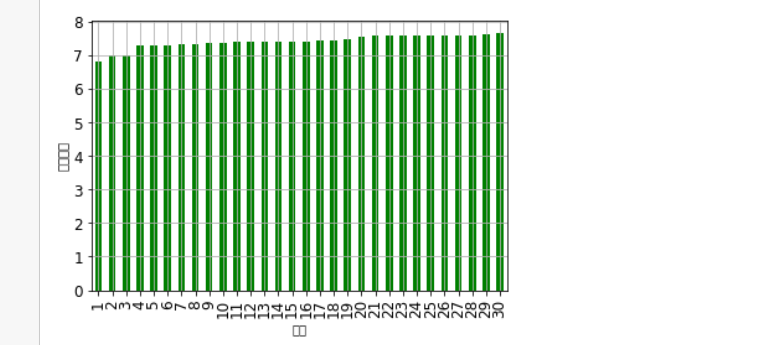
4. Data analysis and visualization
#Histogram
import matplotlib.pyplot as plt
import pandas as pd
import numpy as np
df=pd.read_excel(r'C:\Users\liuquanwang\Desktop\Mobile phone thickness ranking.xls')
index=np.array(df['ranking'])
#Indexes
data=np.array(df['Mobile phone thickness'])
#Used to display Chinese labels normally
plt.rcParams['font.sans-serif']=['Arial Unicode MS']
#Used to display negative signs normally
plt.rcParams['axes.unicode_minus']=False
#modify x Axis font size is 12
plt.xticks(fontsize=12)
#modify y Axis font size is 12
plt.yticks(fontsize=12)
print(data)
print(index)
#x label
plt.xlabel('ranking')
#y label
plt.ylabel('Mobile phone thickness')
s = pd.Series(data, index)
s.plot(kind='bar',color='g')
plt.grid()
plt.show()
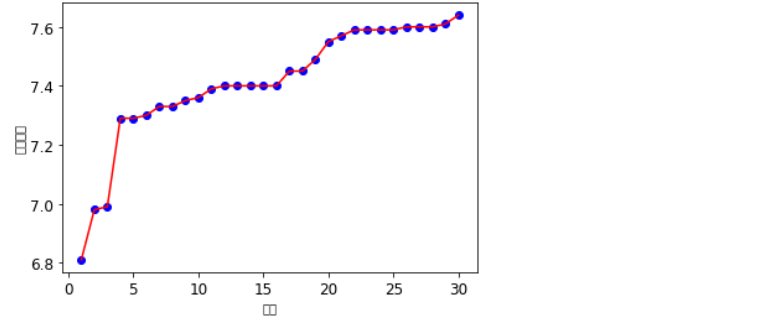
 1 #Scatter chart, line chart
 2 kuake_df=pd.read_excel(r'C:\Users\liuquanwang\Desktop\Mobile phone thickness ranking.xls')
 3 plt.rcParams['font.sans-serif']=['Arial Unicode MS']
 4 plt.rcParams['axes.unicode_minus']=False
 5 plt.xticks(fontsize=12)
 6 plt.yticks(fontsize=12)
 7 #Scatter
 8 plt.scatter(kuake_df.ranking, kuake_df.Mobile phone thickness,color='b')
 9 #broken line
10 plt.plot(kuake_df.ranking, kuake_df.Mobile phone thickness,color='r')
11 #x label
12 plt.xlabel('ranking')
13 #y label
14 plt.ylabel('Mobile phone thickness')
15 plt.show()
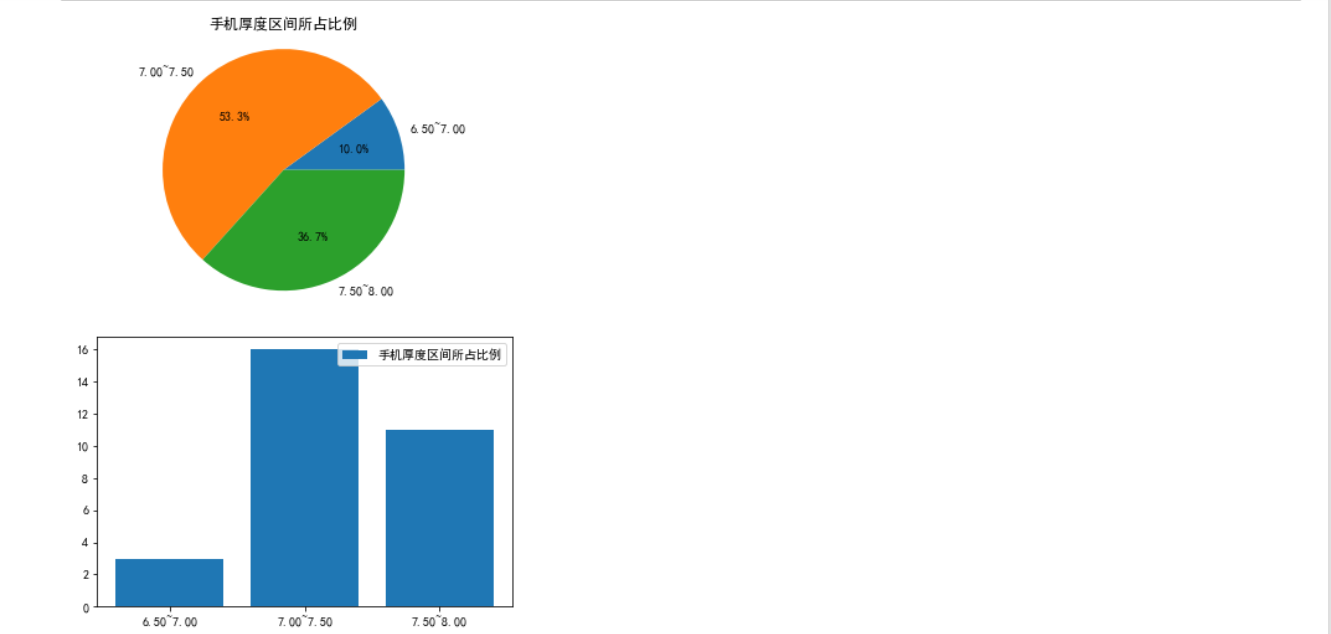
 1 # Fan chart bar chart
 2 import matplotlib.pyplot as plt
 3 plt.rcParams['font.sans-serif']=['SimHei'] #Display Chinese
 4 plt.rcParams['axes.unicode_minus']=False
 5 Type = ['6.50~7.00', '7.00~7.50', '7.50~8.00']
 6 Data = [3, 16,11]
 7 plt.pie(Data ,labels=Type, autopct='%1.1f%%')
 8 plt.axis('equal')
 9 plt.title('Proportion of mobile phone thickness range')
10 plt.show()
11 plt.bar(['6.50~7.00', '7.00~7.50', '7.50~8.00'],
12         [3, 16,11],
13         label="Proportion of mobile phone thickness range")
14 plt.legend()
15 plt.show()
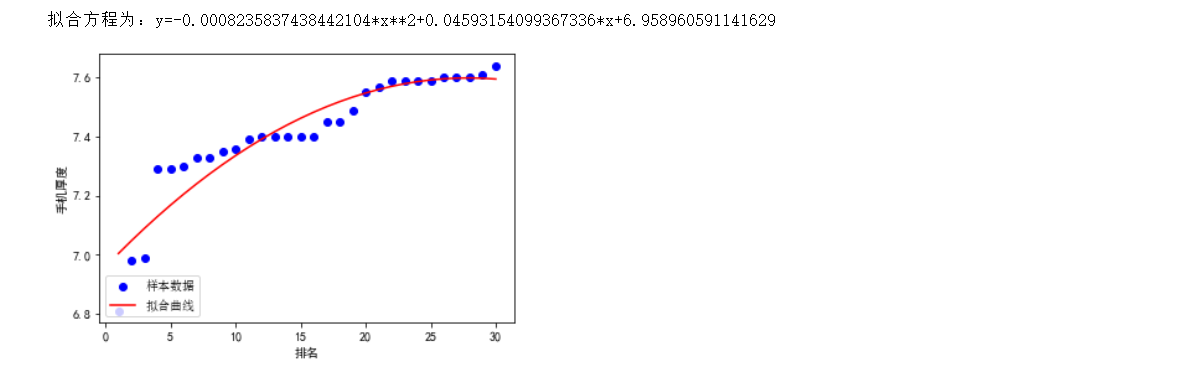
5. According to the relationship between the data, analyze the correlation coefficient between the two variables, draw the scatter diagram, and establish the regression equation (univariate or multivariate) between the variables
 1 import scipy.optimize as opt
 2 import matplotlib.pyplot as plt
 3 import matplotlib
 4 x0=np.array(df['ranking'])
 5 y0=np.array(df['Mobile phone thickness'])
 6 def func(x,c0):
 7     a,b,c=c0
 8     return a*x**2+b*x+c
 9 def errfc(c0,x,y):
10     return y-func(x,c0)
11 c0=[0,2,3]
12 c1=opt.leastsq(errfc,c0,args=(x0,y0))[0]
13 a,b,c=c1
14 print(f"The fitting equation is: y={a}*x**2+{b}*x+{c}")
15 chinese=matplotlib.font_manager.FontProperties(fname='C:\Windows\Fonts\simsun.ttc')
16 plt.plot(x0,y0,"ob",label="sample data ")
17 plt.plot(x0,func(x0,c1),"r",label="Fitting curve")
18 #x label
19 plt.xlabel("ranking")
20 #y label
21 plt.ylabel("Mobile phone thickness")
22 plt.legend(loc=3,prop=chinese)
23 plt.show()
6. Data persistence
Save data for next use.
7. Summary
  1 #-*- coding = utf-8 -*-
  2 from bs4 import BeautifulSoup
  3 #Perform web page parsing
  4
  5 import re
  6 #Text matching
  7
  8 import urllib.request,urllib.error
  9 #formulate URL,Get web page data
 10
 11 import xlwt
 12 #conduct excel operation
 13
 14 import sqlite3
 15 #conduct SQLite Database operation
 16
 17
 18 def getData(url):
 19     datalist = []
 20     html = askURL(url)
 21     soup = BeautifulSoup(html,"html.parser")
 22     i=1
 23     for item in soup.find_all('tr', class_="list_tr"):
 24         data = []
 25         item = str(item)
 26
 27         pm = i
 28         i=i+1
 29         data.append(pm)
 30
 31         findbt = re.compile(r'href="javascript:;".*>(.*?)</a>')
 32         bt = re.findall(findbt, item)[0]
 33         data.append(bt)
 34         findrs = re.compile(r'class="mark1">(.*?)</li>')
 35         rs = re.findall(findrs, item)[0].replace("mm","")
 36         data.append(rs)
 37         datalist.append(data)
 38         if i==31:
 39             break
 40     return datalist
 41
 42
 43 def askURL(url):
 44     head = {
 45         "User-Agent": "Mozilla / 5.0 (Windows NT 10.0; Win64; x64) AppleWebKit/537.36(KHTML, like Gecko) Chrome / 96.0.4664.110 Safari / 537.36"
 46     }
 47     request = urllib.request.Request(url, headers=head)
 48     html = ""
 49     try:
 50         response = urllib.request.urlopen(request)
 51         html = response.read().decode("utf-8")
 52     except urllib.error.URLError as e:
 53         if hasattr(e, "code"):
 54             print(e.code)
 55
 56         if hasattr(e, "reason"):
 57             print(e.reason)
 58
 59     return html
 60
 61 url = "https://rank.kkj.cn/Phone63.shtml"
 62 getData(url)
 63 print("Climb over!")
 64
 65
 66
 67 url = ("https://rank.kkj.cn/Phone63.shtml")
 68 html=askURL(url)
 69 datalist = getData(url)
 70 print(datalist)
 71 print("Climb over!")
 72 savepath = ".\\Mobile phone thickness ranking.xls"
 73 book = xlwt.Workbook(encoding="utf-8",style_compression=0)
 74     #establish workbook object
 75 sheet = book.add_sheet('Mobile phone thickness ranking',cell_overwrite_ok=True)
 76
 77     #Create worksheet
 78 col = ("ranking","Phone name","Mobile phone thickness")
 79
 80 for i in range(0,3):
 81     sheet.write(0,i,col[i]) #Listing
 82
 83 for i in range(0,30):
 84
 85         #test print("The first%d strip" %(i+1))
 86
 87     data = datalist[i]
 88     for j in range(0,3):
 89         sheet.write(i+1,j,data[j])
 90             #data
 91
 92 book.save(savepath)
 93
 94 print('Exported table!')
 95
 96 #Data cleaning
 97 import pandas as pd
 98 import numpy as np
 99 import seaborn as sns
100 import sklearn
101 #Import data
102 ranking=pd.DataFrame(pd.read_excel(r'C:\Users\liuquanwang\Desktop\Mobile phone thickness ranking.xls'))
103 #Display the first five rows of data
104 ranking.head()
105
106 #Find duplicate values
107 ranking.duplicated()
108
109 #Delete duplicate values
110 ranking=ranking.drop_duplicates()
111 #First five lines of output data
112 ranking.head()
113
114 #Outlier query
115 ranking.describe()
116
117 #Histogram
118 import matplotlib.pyplot as plt
119 import pandas as pd
120 import numpy as np
121 df=pd.read_excel(r'C:\Users\liuquanwang\Desktop\Mobile phone thickness ranking.xls')
122 index=np.array(df['ranking'])
123 #Indexes
124 data=np.array(df['Mobile phone thickness'])
125 #Used to display Chinese labels normally
126 plt.rcParams['font.sans-serif']=['Arial Unicode MS']
127 #Used to display negative signs normally
128 plt.rcParams['axes.unicode_minus']=False
129 #modify x Axis font size is 12
130 plt.xticks(fontsize=12)
131 #modify y Axis font size is 12
132 plt.yticks(fontsize=12)
133 print(data)
134 print(index)
135 #x label
136 plt.xlabel('ranking')
137 #y label
138 plt.ylabel('Mobile phone thickness')
139 s = pd.Series(data, index)
140 s.plot(kind='bar',color='g')
141 plt.grid()
142 plt.show()
143
144 #Scatter chart, line chart
145 kuake_df=pd.read_excel(r'C:\Users\liuquanwang\Desktop\Mobile phone thickness ranking.xls')
146 plt.rcParams['font.sans-serif']=['Arial Unicode MS']
147 plt.rcParams['axes.unicode_minus']=False
148 plt.xticks(fontsize=12)
149 plt.yticks(fontsize=12)
150 #Scatter
151 plt.scatter(kuake_df.ranking, kuake_df.Mobile phone thickness,color='b')
152 #broken line
153 plt.plot(kuake_df.ranking, kuake_df.Mobile phone thickness,color='r')
154 #x label
155 plt.xlabel('ranking')
156 #y label
157 plt.ylabel('Mobile phone thickness')
158 plt.show()
159
160 # Fan chart bar chart
161 import matplotlib.pyplot as plt
162 plt.rcParams['font.sans-serif']=['SimHei'] #Display Chinese
163 plt.rcParams['axes.unicode_minus']=False
164 Type = ['6.50~7.00', '7.00~7.50', '7.50~8.00']
165 Data = [3, 16,11]
166 plt.pie(Data ,labels=Type, autopct='%1.1f%%')
167 plt.axis('equal')
168 plt.title('Proportion of mobile phone thickness range')
169 plt.show()
170 plt.bar(['6.50~7.00', '7.00~7.50', '7.50~8.00'],
171         [3, 16,11],
172         label="Proportion of mobile phone thickness range")
173 plt.legend()
174 plt.show()
175
176 #Establish linear regression equation
177 import scipy.optimize as opt
178 import matplotlib.pyplot as plt
179 import matplotlib
180 x0=np.array(df['ranking'])
181 y0=np.array(df['Mobile phone thickness'])
182 def func(x,c0):
183     a,b,c=c0
184     return a*x**2+b*x+c
185 def errfc(c0,x,y):
186     return y-func(x,c0)
187 c0=[0,2,3]
188 c1=opt.leastsq(errfc,c0,args=(x0,y0))[0]
189 a,b,c=c1
190 print(f"The fitting equation is: y={a}*x**2+{b}*x+{c}")
191 chinese=matplotlib.font_manager.FontProperties(fname='C:\Windows\Fonts\simsun.ttc')
192 plt.plot(x0,y0,"ob",label="sample data ")
193 plt.plot(x0,func(x0,c1),"r",label="Fitting curve")
194 #x label
195 plt.xlabel("ranking")
196 #y label
197 plt.ylabel("Mobile phone thickness")
198 plt.legend(loc=3,prop=chinese)
199 plt.show()
5, Summary
Through the data analysis, it can be seen that mobile phones are increasingly pursuing the thinness of mobile phones, but the thickness of mobile phones is generally about 7.50mm, indicating that manufacturers pay more attention to the quality of mobile phones while pursuing the thinness of mobile phones.
The knowledge of this semester is more comprehensive, but it also exposes some shortcomings. The visualization of data is not skilled enough. When writing code, you still need to find books and materials.