Abstract: Recently, I encountered the problem of memory leakage, and the operation and maintenance students urgently called to solve it. Therefore, while solving the problem, I also systematically recorded the common solutions to the problem of memory leakage.
Recently, I encountered the problem of memory leakage, and the operation and maintenance students urgently called to solve it. Therefore, while solving the problem, I also systematically recorded the common solutions to the problem of memory leakage.
Firstly, the phenomenon of this problem is clarified:
1. The service went online once on the 13th. Since the 23rd, there has been a problem of memory rising. After reaching the early warning value and restarting the instance, the rising speed is faster.
2. The services are deployed on chips A and B respectively, but except for model reasoning, almost all preprocessing and post-processing share A set of code. Chip B has A memory leak warning, and chip A has no exceptions.
Idea 1: study the dependency differences between old and new source codes and two party libraries
According to the above two conditions, the first thought is the problem introduced by the update on the 13th, and the update may come from two aspects:
1. Self developed code
2. Two party dependency code
From the above two perspectives:
- On the one hand, we compared the source code of the two versions with Git historical information and BeyondCompare tools, and focused on the separate processing parts of the chip codes of A and B, and found no exceptions.
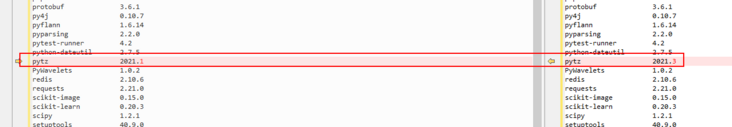
- On the other hand, by comparing the two packages in the two image packages with the pip list command, it is found that only the version that the pytz time zone tool depends on has changed.
After research and analysis, it is considered that the memory leakage caused by this package is unlikely, so it is put down for the time being.
So far, it seems that the way to find out the memory leak problem by studying the changes of the source code of the old and new versions can't go on.
Idea 2: monitor the memory change difference between the old and new versions
At present, python's commonly used memory detection tools include pympler, objgraph, tracemalloc, etc.
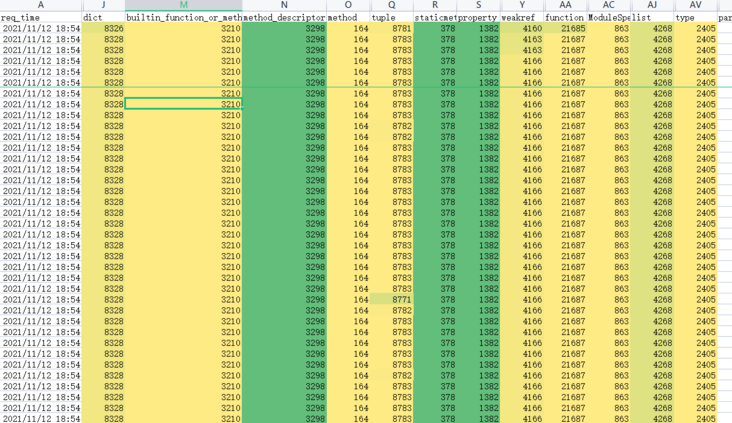
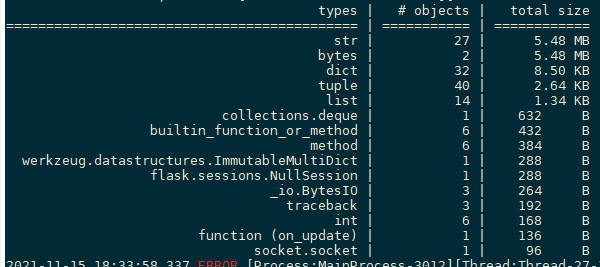
Firstly, the TOP50 variable types in the old and new services are observed and counted by objgraph tool
Common obgraph commands are as follows:
\# Number of global types
objgraph.show\_most\_common\_types(limit=50)
\# Incremental change
objgraph.show\_growth(limit=30)
Here, in order to better observe the change curve, I simply made a package to output the data directly to the csv file for observation.
stats = objgraph.most\_common\_types(limit=50)
stats\_path = "./types\_stats.csv"
tmp\_dict = dict(stats)
req\_time = time.strftime("%Y-%m-%d %H:%M:%S", time.localtime())
tmp\_dict\['req\_time'\] = req\_time
df = pd.DataFrame.from\_dict(tmp\_dict, orient='index').T
if os.path.exists(stats\_path):
df.to\_csv(stats\_path, mode='a', header=True, index=False)
else:
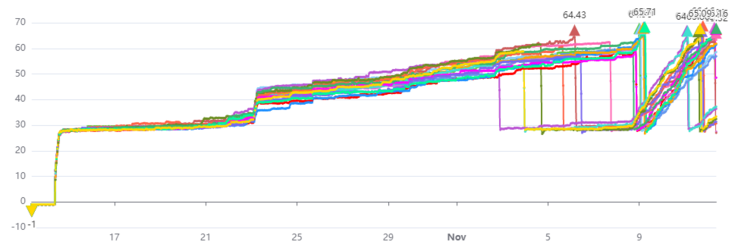
df.to\_csv(stats\_path, index=False)As shown in the figure below, a batch of pictures ran on the old and new versions for 1 hour, everything was as stable as an old dog, and there was no wave in the number of various types.
At this time, I think that I will generally use a batch of abnormal format pictures for boundary verification before transfer test or online.
Although these abnormalities must have been verified before the test students went online, the dead horse was easily tested as a live horse doctor.
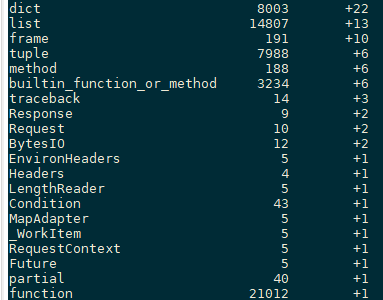
The calm data has been broken, as shown in the red box below: the number of important types such as dict, function, method, tuple and traceback began to rise.
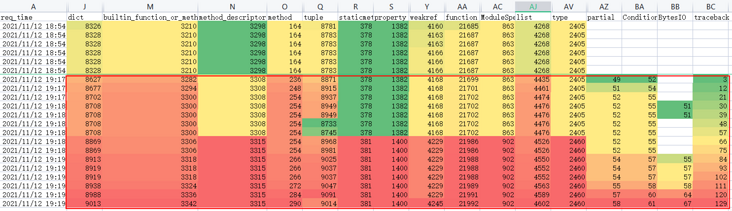
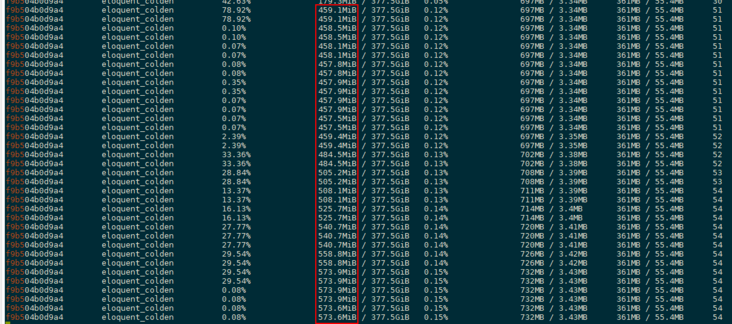
At this time, the mirrored memory is also increasing and there is no sign of convergence.
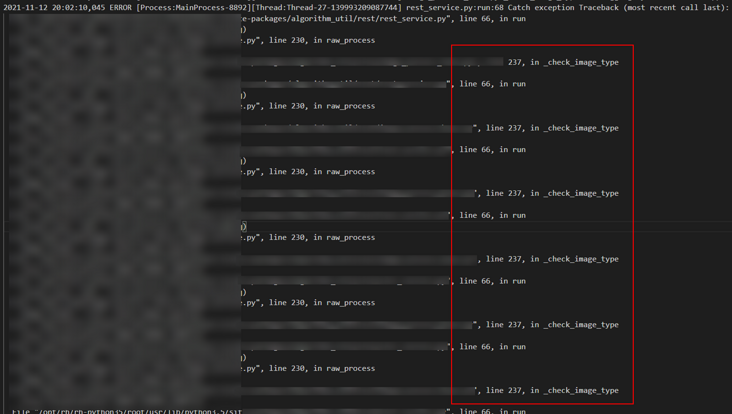
Thus, although it is impossible to confirm whether it is an online problem, at least one bug has been located. At this time, I checked the log and found a strange phenomenon:
Under normal circumstances, for exceptions caused by special pictures, the log should output the following information, namely check\_ image\_ The type method prints only once in the exception stack.
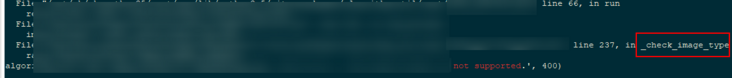
But the status quo is check\_ image\_ The type method repeatedly prints multiple times, and the number of repetitions increases with the number of tests.
Re studied the exception handling code here.
The exception statement is as follows:
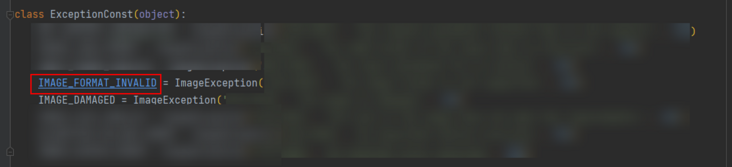
Throw exception codes are as follows:
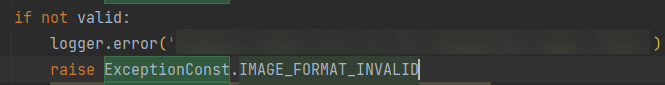
The problem is
After thinking about it, I probably figured out the root cause of the problem:
Here, each exception instance is equivalent to being defined as a global variable, and when throwing an exception, it is this global variable that is thrown. When this global variable is pushed into the exception stack, it will not be recycled.
Therefore, with the increasing number of wrong format picture calls, the information in the exception stack will also increase. Moreover, since the exception also contains the requested picture information, the memory will increase at the MB level.
But this part of the code has been online for A long time. If the online problem is really caused here, why didn't there be any problems before, and why didn't there be any problems on chip A?
With the above two questions, we made two verifications:
Firstly, it is confirmed that this problem also occurs in the previous version and chip A.
Secondly, we checked the online call records and found that a new customer was recently connected, and there was a phenomenon of using a large number of pictures with similar problems to call the services of an office (most of which are B chips). We found some online examples and observed the same phenomenon from the log.
Therefore, the above questions have been basically explained. After fixing this bug, the memory overflow problem will no longer occur.
Advanced thinking
Be reasonable, it seems that the work can be finished when the problem is solved to this point. But I asked myself a question. If I didn't print this line of log at the beginning, or developers were lazy and didn't print out all the exception stacks, how should I locate them?
With this problem, I continued to study the objgraph and pympler tools.
It has been found that memory leakage will occur in the case of abnormal pictures, so let's focus on the following abnormal situations:
Through the following commands, we can see which variables are added to memory and the increased memory each time an exception occurs.
1. Use objgraph show\_ growth(limit=20)
2. Use pympler tool
from pympler import tracker
tr = tracker.SummaryTracker()
tr.print\_diff()
Through the following code, you can print out which references these new variables come from for further analysis.
gth = objgraph.growth(limit=20)
for gt in gth:
    logger.info("growth type:%s, count:%s, growth:%s" % (gt\[0\], gt\[1\], gt\[2\]))
    if gt\[2\] > 100 or gt\[1\] > 300:
        continue
    objgraph.show\_backrefs(objgraph.by\_type(gt\[0\])\[0\], max\_depth=10, too\_many=5,
                           filename="./dots/%s\_backrefs.dot" % gt\[0\])
    objgraph.show\_refs(objgraph.by\_type(gt\[0\])\[0\], max\_depth=10, too\_many=5,
                       filename="./dots/%s\_refs.dot" % gt\[0\])
    objgraph.show\_chain(
        objgraph.find\_backref\_chain(objgraph.by\_type(gt\[0\])\[0\], objgraph.is\_proper\_module),
        filename="./dots/%s\_chain.dot" % gt\[0\]
    )
Use the dot tool of graphviz to convert the graph format data produced above into the following pictures:
dot -Tpng xxx.dot -o xxx.png
Here, because there are too many basic types such as dict, list, frame, tuple and method, it is difficult to observe, so filtering is done here first.
Call chain of ImageReqWrapper added in memory
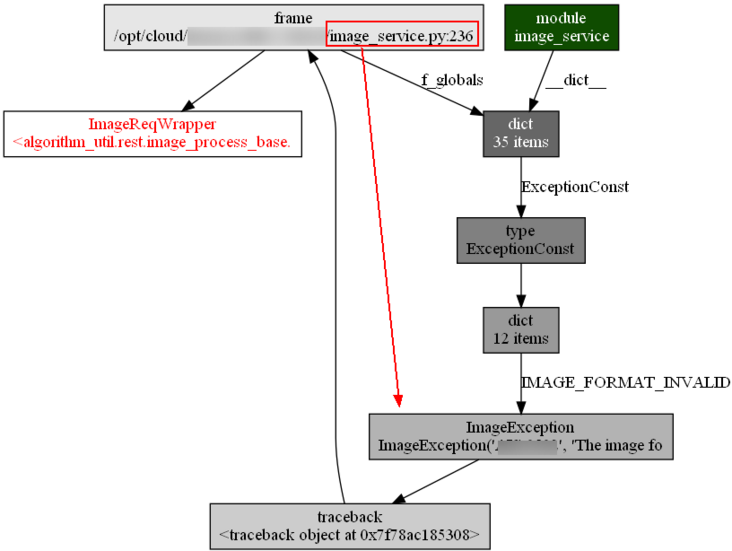
Call chain of traceback added in memory:
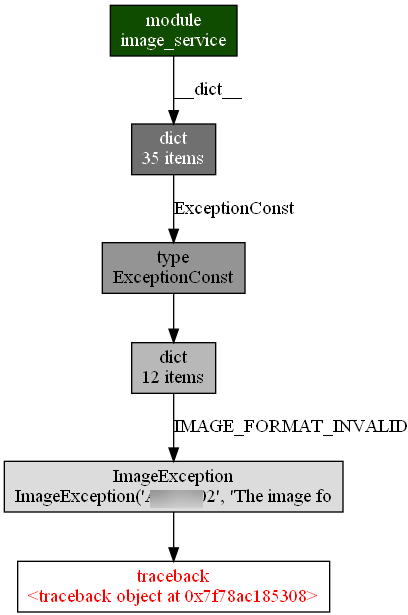
Although with the prior knowledge, we naturally pay attention to traceback and its corresponding IMAGE\_FORMAT\_EXCEPTION.
However, by thinking about why the above variables that should have been recycled after the service call are not recycled, especially all traceback variables are recycled by image\_ FORMAT\_ Such phenomena as failure to recycle after exception call; At the same time, do some small experiments. I believe we can locate the root of the problem soon.
So far, we can draw the following conclusions:
Because the thrown exception cannot be recycled, the corresponding exception stack, request body and other variables cannot be recycled. Because the request body contains picture information, each such request will lead to MB level memory leakage.
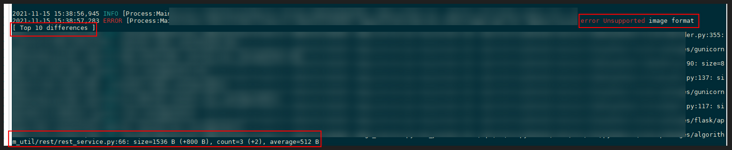
In addition, it is also found that Python 3 comes with a memory analysis tool tracemalloc. You can observe the relationship between code lines and memory through the following code. Although it may not be accurate, it can also provide some clues.
import tracemalloc

tracemalloc.start(25)
snapshot = tracemalloc.take\_snapshot()
global snapshot
gc.collect()
snapshot1 = tracemalloc.take\_snapshot()
top\_stats = snapshot1.compare\_to(snapshot, 'lineno')
logger.warning("\[ Top 20 differences \]")
for stat in top\_stats\[:20\]:
    if stat.size\_diff < 0:
        continue
    logger.warning(stat)
snapshot = tracemalloc.take\_snapshot()