Learning the Pandas sorting method is a good way to start or practice basic data analysis using Python. The most common data analysis is done using spreadsheets, SQL, or Pandas. One of the advantages of using Pandas is that it can process a large amount of data and provide high-performance data operation capability.
In this tutorial, you will learn how to use sort_values() and sort_index(), which will enable you to effectively sort the data in the DataFrame.
At the end of this tutorial, you will know how to:
- Sorts the Pandas DataFrame by the value of one or more columns
- Use the ascending parameter to change the sort order
- Use index to sort the DataFrame sort_index()
- Organize missing data when sorting values
- Use set to to sort DataFrame in place inplaceTrue
To learn this tutorial, you need to have a basic understanding of Pandas DataFrames and a certain understanding of reading data from files.
Introduction to Pandas sorting method
As a quick reminder, DataFrame is a data structure with marked axes for rows and columns. You can sort the DataFrame by row or column value and row or column index.
Both rows and columns have indexes, which are numerical representations of the position of data in the DataFrame. You can use the index position of the DataFrame to retrieve data from a specific row or column. By default, the index number starts from zero. You can also manually assign your own index.
Prepare dataset
In this tutorial, you will use fuel economy data compiled by the U.S. Environmental Protection Agency (EPA) for vehicles manufactured between 1984 and 2021. The EPA fuel economy data set is great because it contains many different types of information that you can sort, from text to digital data types. The dataset contains a total of 83 columns.
To continue, you need to install the pandas Python library. The code in this tutorial uses pandas 1.2 0 and python 3.9 1 implementation.
Note: the entire fuel economy data set is approximately 18 MB. Reading the entire dataset into memory may take a minute or two. Limiting the number of rows and columns helps improve performance, but downloading data still takes a few seconds.
For analysis purposes, you will view MPG (miles per gallon) data for vehicles by make, model, year, and other vehicle attributes. You can specify the columns to read into the DataFrame. For this tutorial, you only need a subset of the available columns.
The following is the command to read the relevant columns of the fuel economy dataset into the DataFrame and display the first five lines:
class="highlight">
>>> >>> import pandas as pd >>> column_subset = [ ... "id", ... "make", ... "model", ... "year", ... "cylinders", ... "fuelType", ... "trany", ... "mpgData", ... "city08", ... "highway08" ... ] >>> df = pd.read_csv( ... "https://www.fueleconomy.gov/feg/epadata/vehicles.csv", ... usecols=column_subset, ... nrows=100 ... ) >>> df.head() city08 cylinders fuelType ... mpgData trany year 0 19 4 Regular ... Y Manual 5-spd 1985 1 9 12 Regular ... N Manual 5-spd 1985 2 23 4 Regular ... Y Manual 5-spd 1985 3 10 8 Regular ... N Automatic 3-spd 1985 4 17 4 Premium ... N Manual 5-spd 1993 [5 rows x 10 columns]
Pass read_csv() is called using the dataset URL, and you can load the data into the DataFrame. Shrinking columns results in faster load times and less memory usage. To further limit memory consumption and quickly understand the data, you can use nrows to specify the number of rows to load.
Familiar sort_values()
You use for sort_values() sorts the values in the DataFrame along any axis (column or row). Typically, you want to sort the rows in the DataFrame by the values of one or more columns:
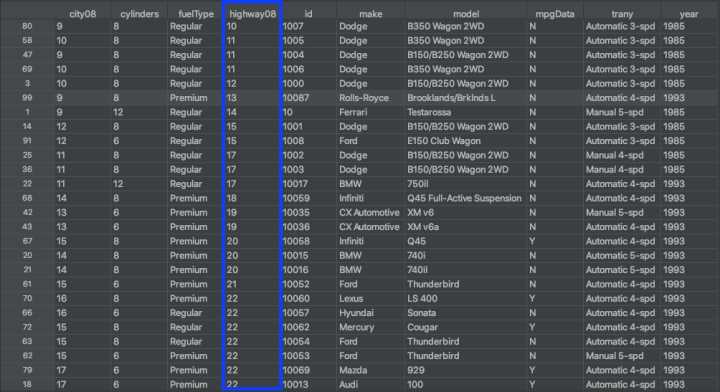
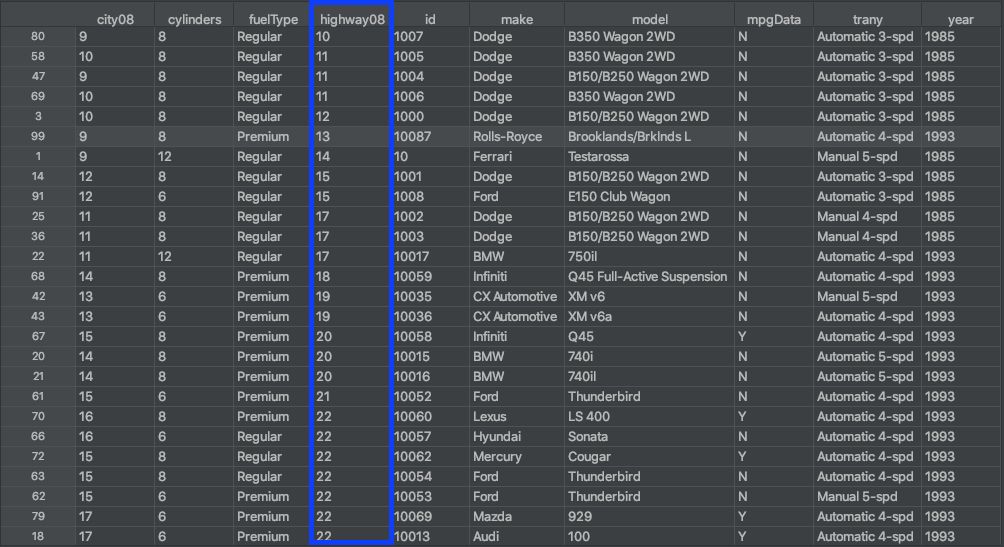
The figure above shows the use of sort_values() is the result of sorting the rows of the DataFrame according to the values in the highway08 column. This is similar to sorting data in a spreadsheet using columns.
Familiar sort_index()
You use for sort_index() sorts the DataFrame by row index or column label. The difference from using sort_values() is that you sort the DataFrame by its row index or column name, not by the values in those rows or columns:
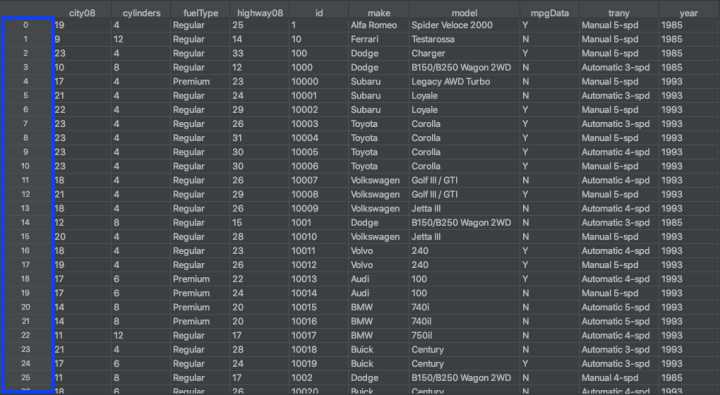
The row index of the DataFrame is marked in blue in the figure above. An index is not treated as a column; you usually have only one row index. A row index can be considered a zero based row number.
Sort the DataFrame on a single column
To sort the DataFrame based on the values in a single column, you will use sort_values(). By default, this returns a new DataFrame sorted in ascending order. It does not modify the original DataFrame.
Sort by column in ascending order
To use sort_values(), pass a single parameter to the method that contains the name of the column to sort by. In this example, you sort the DataFrame by city08 column, which represents the city MPG of pure fuel vehicles:
>>>
>>> df.sort_values("city08")
    city08  cylinders fuelType  ...  mpgData            trany  year
99       9          8  Premium  ...        N  Automatic 4-spd  1993
1        9         12  Regular  ...        N     Manual 5-spd  1985
80       9          8  Regular  ...        N  Automatic 3-spd  1985
47       9          8  Regular  ...        N  Automatic 3-spd  1985
3       10          8  Regular  ...        N  Automatic 3-spd  1985
..     ...        ...      ...  ...      ...              ...   ...
9       23          4  Regular  ...        Y  Automatic 4-spd  1993
8       23          4  Regular  ...        Y     Manual 5-spd  1993
7       23          4  Regular  ...        Y  Automatic 3-spd  1993
76      23          4  Regular  ...        Y     Manual 5-spd  1993
2       23          4  Regular  ...        Y     Manual 5-spd  1985
[100 rows x 10 columns]
This will sort your DataFrame using the column values in city08, showing the vehicle with the lowest MPG first. By default, in ascending order sort_values() sorts the data. Although you did not specify a name for the parameter passed to, the sort_values() you actually use the by parameter, which you will see in the next example.
Change sort order
Another parameter of sort_values() is ascending. By default sort_values() has been ascending set to True. If you want the DataFrame to be sorted in descending order, you can pass False to this parameter:
>>>
>>> df.sort_values(
...     by="city08",
...     ascending=False
... )
    city08  cylinders fuelType  ...  mpgData            trany  year
9       23          4  Regular  ...        Y  Automatic 4-spd  1993
2       23          4  Regular  ...        Y     Manual 5-spd  1985
7       23          4  Regular  ...        Y  Automatic 3-spd  1993
8       23          4  Regular  ...        Y     Manual 5-spd  1993
76      23          4  Regular  ...        Y     Manual 5-spd  1993
..     ...        ...      ...  ...      ...              ...   ...
58      10          8  Regular  ...        N  Automatic 3-spd  1985
80       9          8  Regular  ...        N  Automatic 3-spd  1985
1        9         12  Regular  ...        N     Manual 5-spd  1985
47       9          8  Regular  ...        N  Automatic 3-spd  1985
99       9          8  Premium  ...        N  Automatic 4-spd  1993
[100 rows x 10 columns]
You can reverse the sort order by passing False to ascending. Your DataFrame is now sorted in descending order by the average MPG measured under urban conditions. The vehicle with the highest MPG value is in the first row.
Select Sorting Algorithm
It is worth noting that pandas allows you to choose different sorting algorithms to work with sort_values() is used with sort_index(). The available algorithms are quicksort, mergeport and heapsort. For more information about these different sorting algorithms, see sorting algorithms in Python.
When sorting a single column, the default algorithm is quicksort. To change it to a stable sorting algorithm, use mergeport. You can do this using the kind parameter in or, as follows: sort_values().sort_index()
>>>
>>> df.sort_values(
...     by="city08",
...     ascending=False,
...     kind="mergesort"
... )
    city08  cylinders fuelType  ...  mpgData            trany  year
2       23          4  Regular  ...        Y     Manual 5-spd  1985
7       23          4  Regular  ...        Y  Automatic 3-spd  1993
8       23          4  Regular  ...        Y     Manual 5-spd  1993
9       23          4  Regular  ...        Y  Automatic 4-spd  1993
10      23          4  Regular  ...        Y     Manual 5-spd  1993
..     ...        ...      ...  ...      ...              ...   ...
69      10          8  Regular  ...        N  Automatic 3-spd  1985
1        9         12  Regular  ...        N     Manual 5-spd  1985
47       9          8  Regular  ...        N  Automatic 3-spd  1985
80       9          8  Regular  ...        N  Automatic 3-spd  1985
99       9          8  Premium  ...        N  Automatic 4-spd  1993
[100 rows x 10 columns]
With kind, you set the sorting algorithm to merge. The previous output used the default quicksort algorithm. Looking at the highlighted index, you can see that the order of rows is different. This is because quicksort is not a stable sorting algorithm, but mergeport.
Note: in Pandas, kind is ignored when you sort multiple columns or labels.
When you sort multiple records with the same key, a stable sorting algorithm will maintain the original order of these records after sorting. Therefore, if you plan to perform multiple sorts, you must use a stable sort algorithm.
Sort dataframes on multiple columns
In data analysis, you usually want to sort the data according to the values of multiple columns. Imagine that you have a dataset containing people's first and last names. It makes sense to sort first by last name and then by first name, so that people with the same last name will be arranged alphabetically according to their first name.
In the first example, you sorted the DataFrame on a single column named city08. From the perspective of analysis, MPG under urban conditions is an important factor to determine the popularity of cars. In addition to mpg in urban conditions, you may also want to view mpg in highway conditions. To sort by two keys, you can pass the list of column names to by:
>>>
>>> df.sort_values(
...     by=["city08", "highway08"]
... )[["city08", "highway08"]]
    city08  highway08
80       9         10
47       9         11
99       9         13
1        9         14
58      10         11
..     ...        ...
9       23         30
10      23         30
8       23         31
76      23         31
2       23         33
[100 rows x 2 columns]
By specifying the column names city08 and highway08, you can sort the dataframes on the two columns using sort_values(). The next example explains how to specify the sort order and why it is important to note the list of column names you use.
Sort multiple columns in ascending order
To sort the DataFrame on multiple columns, you must provide a list of column names. For example, to sort model s by make and, you should create the following list and pass it to sort_values():
>>>
>>> df.sort_values(
...     by=["make", "model"]
... )[["make", "model"]]
          make               model
0   Alfa Romeo  Spider Veloce 2000
18        Audi                 100
19        Audi                 100
20         BMW                740i
21         BMW               740il
..         ...                 ...
12  Volkswagen      Golf III / GTI
13  Volkswagen           Jetta III
15  Volkswagen           Jetta III
16       Volvo                 240
17       Volvo                 240
[100 rows x 2 columns]
Now your DataFrame is sorted in ascending order make. If there are two or more of the same brands, sort by model. The order in which column names are specified in the list corresponds to how the DataFrame is sorted.
Change column sort order
Because you use multiple columns for sorting, you can specify the sort order of the columns. If you want to change the logical sort order in the previous example, you can change the order of column names in the list passed to the by parameter:
>>>
>>> df.sort_values(
...     by=["model", "make"]
... )[["make", "model"]]
             make        model
18           Audi          100
19           Audi          100
16          Volvo          240
17          Volvo          240
75          Mazda          626
..            ...          ...
62           Ford  Thunderbird
63           Ford  Thunderbird
88     Oldsmobile     Toronado
42  CX Automotive        XM v6
43  CX Automotive       XM v6a
[100 rows x 2 columns]
Your DataFrame is now sorted by model in ascending order, by column, and then by make whether there are two or more identical models. You can see that changing the order of columns also changes the sort order of values.
Sort by descending sort by multiple columns
So far, you have only sorted multiple columns in ascending order. In the next example, you will sort in descending order based on the make and model columns. To sort in descending order, set ascending to False:
>>>
>>> df.sort_values(
...     by=["make", "model"],
...     ascending=False
... )[["make", "model"]]
          make               model
16       Volvo                 240
17       Volvo                 240
13  Volkswagen           Jetta III
15  Volkswagen           Jetta III
11  Volkswagen      Golf III / GTI
..         ...                 ...
21         BMW               740il
20         BMW                740i
18        Audi                 100
19        Audi                 100
0   Alfa Romeo  Spider Veloce 2000
[100 rows x 2 columns]
The values in the make column are arranged alphabetically in reverse model order for the same make For text data, sorting is case sensitive, which means that uppercase text will appear first in ascending order and last in descending order.
Sort by multiple columns with different sort order
You might want to know if you can sort with multiple columns and have them use different ascending parameters. With panda, you can do this through a single method call. If you want to sort some columns in ascending order and some columns in descending order, you can pass a Boolean list to ascending
In this example, you arrange the data frames by the make, model and city08 columns, which are sorted in ascending order with the first two columns and in descending order with city08. To do this, you pass a list of column names to by and a list of Boolean values to ascending:
>>>
>>> df.sort_values(
...     by=["make", "model", "city08"],
...     ascending=[True, True, False]
... )[["make", "model", "city08"]]
          make               model  city08
0   Alfa Romeo  Spider Veloce 2000      19
18        Audi                 100      17
19        Audi                 100      17
20         BMW                740i      14
21         BMW               740il      14
..         ...                 ...     ...
11  Volkswagen      Golf III / GTI      18
15  Volkswagen           Jetta III      20
13  Volkswagen           Jetta III      18
17       Volvo                 240      19
16       Volvo                 240      18
[100 rows x 3 columns]
Now sort your data frames, make, and model in ascending order, but with city08 in descending order. This is useful because it groups cars in classification order and displays the car with the highest MPG first.
Sort dataframes by index
Before sorting an index, it's best to know what the index represents. DataFrame has one Index property, which is a numeric representation of its row position by default. You can think of an index as a line number. It helps to quickly find and identify rows.
Sort by index in ascending order
You can sort the DataFrame according to the row index sort_index(). As in the previous example, sorting by column value reorders the rows in the DataFrame, so the index becomes disorganized. This also happens when you filter the DataFrame or delete or add rows.
To illustrate the use of sort_index(), first create a new sorted dataframe using the following method sort_ values():
>>>
>>> sorted_df = df.sort_values(by=["make", "model"])
>>> sorted_df
    city08  cylinders fuelType  ...  mpgData            trany  year
0       19          4  Regular  ...        Y     Manual 5-spd  1985
18      17          6  Premium  ...        Y  Automatic 4-spd  1993
19      17          6  Premium  ...        N     Manual 5-spd  1993
20      14          8  Premium  ...        N  Automatic 5-spd  1993
21      14          8  Premium  ...        N  Automatic 5-spd  1993
..     ...        ...      ...  ...      ...              ...   ...
12      21          4  Regular  ...        Y     Manual 5-spd  1993
13      18          4  Regular  ...        N  Automatic 4-spd  1993
15      20          4  Regular  ...        N     Manual 5-spd  1993
16      18          4  Regular  ...        Y  Automatic 4-spd  1993
17      19          4  Regular  ...        Y     Manual 5-spd  1993
[100 rows x 10 columns]
You have created a DataFrame sorted with multiple values. Notice how the row indexes are not in a specific order. To restore the new DataFrame to the original order, you can use sort_index():
>>>
>>> sorted_df.sort_index()
    city08  cylinders fuelType  ...  mpgData            trany  year
0       19          4  Regular  ...        Y     Manual 5-spd  1985
1        9         12  Regular  ...        N     Manual 5-spd  1985
2       23          4  Regular  ...        Y     Manual 5-spd  1985
3       10          8  Regular  ...        N  Automatic 3-spd  1985
4       17          4  Premium  ...        N     Manual 5-spd  1993
..     ...        ...      ...  ...      ...              ...   ...
95      17          6  Regular  ...        Y  Automatic 3-spd  1993
96      17          6  Regular  ...        N  Automatic 4-spd  1993
97      15          6  Regular  ...        N  Automatic 4-spd  1993
98      15          6  Regular  ...        N     Manual 5-spd  1993
99       9          8  Premium  ...        N  Automatic 4-spd  1993
[100 rows x 10 columns]
The index is now arranged in ascending order. Like in sort_ The default parameter for values () is that you can change it to descending order by passing. Sorting the index has no effect on the data itself because the value remains the same. ascending.sort_index()TrueFalse
When you use set_index(). If you want to set a custom index using the make and model columns, you can pass the list to set_index():
>>>
>>> assigned_index_df = df.set_index(
...     ["make", "model"]
... )
>>> assigned_index_df
                                  city08  cylinders  ...            trany  year
make        model                                    ...
Alfa Romeo  Spider Veloce 2000        19          4  ...     Manual 5-spd  1985
Ferrari     Testarossa                 9         12  ...     Manual 5-spd  1985
Dodge       Charger                   23          4  ...     Manual 5-spd  1985
            B150/B250 Wagon 2WD       10          8  ...  Automatic 3-spd  1985
Subaru      Legacy AWD Turbo          17          4  ...     Manual 5-spd  1993
                                  ...        ...  ...              ...   ...
Pontiac     Grand Prix                17          6  ...  Automatic 3-spd  1993
            Grand Prix                17          6  ...  Automatic 4-spd  1993
            Grand Prix                15          6  ...  Automatic 4-spd  1993
            Grand Prix                15          6  ...     Manual 5-spd  1993
Rolls-Royce Brooklands/Brklnds L       9          8  ...  Automatic 4-spd  1993
[100 rows x 8 columns]
Using this method, you can replace the default integer based row index with two axis labels. This is considered a MultiIndex or a hierarchical index. Your DataFrame is now indexed by multiple keys that you can use sort_index() sorts by the following key:
>>>
>>> assigned_index_df.sort_index()
                               city08  cylinders  ...            trany  year
make       model                                  ...
Alfa Romeo Spider Veloce 2000      19          4  ...     Manual 5-spd  1985
Audi       100                     17          6  ...  Automatic 4-spd  1993
           100                     17          6  ...     Manual 5-spd  1993
BMW        740i                    14          8  ...  Automatic 5-spd  1993
           740il                   14          8  ...  Automatic 5-spd  1993
                               ...        ...  ...              ...   ...
Volkswagen Golf III / GTI          21          4  ...     Manual 5-spd  1993
           Jetta III               18          4  ...  Automatic 4-spd  1993
           Jetta III               20          4  ...     Manual 5-spd  1993
Volvo      240                     18          4  ...  Automatic 4-spd  1993
           240                     19          4  ...     Manual 5-spd  1993
[100 rows x 8 columns]
First assign a new index model to the DataFrame using make and column, and then sort the index using sort_index(). You can set_index() read more about using in the pandas documentation.
Sort by index in descending order
For the next example, you will sort the dataframes in descending order by index. Remember, by sorting the DataFrame sort_values(), you can reverse the sort order by setting ascending to False. This parameter also applies to sort_index(), so you can sort the dataframes in reverse order, as shown below:
>>>
>>> assigned_index_df.sort_index(ascending=False)
                               city08  cylinders  ...            trany  year
make       model                                  ...
Volvo      240                     18          4  ...  Automatic 4-spd  1993
           240                     19          4  ...     Manual 5-spd  1993
Volkswagen Jetta III               18          4  ...  Automatic 4-spd  1993
           Jetta III               20          4  ...     Manual 5-spd  1993
           Golf III / GTI          18          4  ...  Automatic 4-spd  1993
                               ...        ...  ...              ...   ...
BMW        740il                   14          8  ...  Automatic 5-spd  1993
           740i                    14          8  ...  Automatic 5-spd  1993
Audi       100                     17          6  ...  Automatic 4-spd  1993
           100                     17          6  ...     Manual 5-spd  1993
Alfa Romeo Spider Veloce 2000      19          4  ...     Manual 5-spd  1985
[100 rows x 8 columns]
Your DataFrame is now sorted in descending order by its index. use. sort_index() is a difference between and sort_values() is it sort_index() has no by parameter because it sorts the DataFrame on the row index by default.
Explore advanced index sorting concepts
There are many situations in data analysis where you want to sort hierarchical indexes. You have seen how to use make and model in MultiIndex. For this dataset, you can also use the id column as an index.
Setting the ID column as an index may help link related datasets. For example, EPA's emission data set is also used to represent the vehicle record ID. This links emissions data to fuel economy data. Other methods (such as. Merge()) can be used to sort the indexes of two datasets in the DataFrame To learn more about combining data in Pandas, see using merge(),. In Pandas join() and concat() combine data.
Sort the columns of the DataFrame
You can also sort row values using the column labels of the DataFrame. Use set to sort_ The optional parameter of index () sorts the DataFrame by column label. The sorting algorithm is applied to axis labels rather than actual data. This facilitates a visual inspection of the DataFrame. axis1
Use data frame axis
When you are sort_index() is used as the default parameter when it is used without passing any explicit parameter axis=0. The axis of a DataFrame refers to an index (axis=0) or a column (axis=1). You can use these two axes to index, select, and sort data in the DataFrame.
Sort using column labels
You can also use the column label of the DataFrame as the sort_index(). Set the column axis of DataFrame to be 1 sorted according to the column label:
>>>
>>> df.sort_index(axis=1)
    city08  cylinders fuelType  ...  mpgData            trany  year
0       19          4  Regular  ...        Y     Manual 5-spd  1985
1        9         12  Regular  ...        N     Manual 5-spd  1985
2       23          4  Regular  ...        Y     Manual 5-spd  1985
3       10          8  Regular  ...        N  Automatic 3-spd  1985
4       17          4  Premium  ...        N     Manual 5-spd  1993
..     ...        ...      ...  ...      ...              ...   ...
95      17          6  Regular  ...        Y  Automatic 3-spd  1993
96      17          6  Regular  ...        N  Automatic 4-spd  1993
97      15          6  Regular  ...        N  Automatic 4-spd  1993
98      15          6  Regular  ...        N     Manual 5-spd  1993
99       9          8  Premium  ...        N  Automatic 4-spd  1993
[100 rows x 10 columns]
The columns of the DataFrame are sorted alphabetically from left to right. If you want to sort columns in descending order, you can use ascending=False:
>>>
>>> df.sort_index(axis=1, ascending=False)
    year            trany mpgData  ... fuelType cylinders  city08
0   1985     Manual 5-spd       Y  ...  Regular         4      19
1   1985     Manual 5-spd       N  ...  Regular        12       9
2   1985     Manual 5-spd       Y  ...  Regular         4      23
3   1985  Automatic 3-spd       N  ...  Regular         8      10
4   1993     Manual 5-spd       N  ...  Premium         4      17
..   ...              ...     ...  ...      ...       ...     ...
95  1993  Automatic 3-spd       Y  ...  Regular         6      17
96  1993  Automatic 4-spd       N  ...  Regular         6      17
97  1993  Automatic 4-spd       N  ...  Regular         6      15
98  1993     Manual 5-spd       N  ...  Regular         6      15
99  1993  Automatic 4-spd       N  ...  Premium         8       9
[100 rows x 10 columns]
Use axis = 1in sort_ Index (), you can sort the columns of the DataFrame in ascending and descending order. This may be more useful in other datasets, such as datasets where column labels correspond to months of the year. In this case, it makes sense to arrange the data in ascending or descending order by month.
Process lost data when sorting in Pandas
Usually, real-world data has many defects. Although Pandas has several ways to clean up data before sorting, sometimes it's good to see lost data when sorting. You can use na_position parameter to do this.
The subset of fuel economy data used in this tutorial has no missing values. To illustrate the use of na_position, first you need to create some missing data. The following code creates a new column based on the existing mpgData column, mapping the position where mpgData is equal to Y and NaN is not equal to:
>>>
>>> df["mpgData_"] = df["mpgData"].map({"Y": True})
>>> df
    city08  cylinders fuelType  ...            trany  year mpgData_
0       19          4  Regular  ...     Manual 5-spd  1985     True
1        9         12  Regular  ...     Manual 5-spd  1985      NaN
2       23          4  Regular  ...     Manual 5-spd  1985     True
3       10          8  Regular  ...  Automatic 3-spd  1985      NaN
4       17          4  Premium  ...     Manual 5-spd  1993      NaN
..     ...        ...      ...  ...              ...   ...      ...
95      17          6  Regular  ...  Automatic 3-spd  1993     True
96      17          6  Regular  ...  Automatic 4-spd  1993      NaN
97      15          6  Regular  ...  Automatic 4-spd  1993      NaN
98      15          6  Regular  ...     Manual 5-spd  1993      NaN
99       9          8  Premium  ...  Automatic 4-spd  1993      NaN
[100 rows x 11 columns]
Now you have a new column called mpgData_ Contains both True and NaN values. You will use this column to view na_position the effect of using these two sorting methods. To learn more about using map(), you can read the Pandas project: making a grade book using Python and Pandas.
Understanding na_position parameter sort_values()
. sort_values() accepts a parameter named na_position, which helps organize missing data in the columns you sort. If you sort columns with missing data, rows with missing values appear at the end of the DataFrame. This happens whether you sort in ascending or descending order.
When you sort columns with missing data, your DataFrame is as follows:
>>>
>>> df.sort_values(by="mpgData_")
    city08  cylinders fuelType  ...            trany  year mpgData_
0       19          4  Regular  ...     Manual 5-spd  1985     True
55      18          6  Regular  ...  Automatic 4-spd  1993     True
56      18          6  Regular  ...  Automatic 4-spd  1993     True
57      16          6  Premium  ...     Manual 5-spd  1993     True
59      17          6  Regular  ...  Automatic 4-spd  1993     True
..     ...        ...      ...  ...              ...   ...      ...
94      18          6  Regular  ...  Automatic 4-spd  1993      NaN
96      17          6  Regular  ...  Automatic 4-spd  1993      NaN
97      15          6  Regular  ...  Automatic 4-spd  1993      NaN
98      15          6  Regular  ...     Manual 5-spd  1993      NaN
99       9          8  Premium  ...  Automatic 4-spd  1993      NaN
[100 rows x 11 columns]
To change this behavior and have lost data appear in your data frame for the first time, you can set na_position to first. The Na_ The position parameter only accepts the value last, which is the default, and first. Here is how to use na_position sort_values():
>>>
>>> df.sort_values(
...     by="mpgData_",
...     na_position="first"
... )
    city08  cylinders fuelType  ...            trany  year mpgData_
1        9         12  Regular  ...     Manual 5-spd  1985      NaN
3       10          8  Regular  ...  Automatic 3-spd  1985      NaN
4       17          4  Premium  ...     Manual 5-spd  1993      NaN
5       21          4  Regular  ...  Automatic 3-spd  1993      NaN
11      18          4  Regular  ...  Automatic 4-spd  1993      NaN
..     ...        ...      ...  ...              ...   ...      ...
32      15          8  Premium  ...  Automatic 4-spd  1993     True
33      15          8  Premium  ...  Automatic 4-spd  1993     True
37      17          6  Regular  ...  Automatic 3-spd  1993     True
85      17          6  Regular  ...  Automatic 4-spd  1993     True
95      17          6  Regular  ...  Automatic 3-spd  1993     True
[100 rows x 11 columns]
Any missing data in the columns you use to sort will now appear at the top of the DataFrame. This is useful when you first start analyzing data and are not sure if there are missing values.
Understanding na_position parameter sort_index()
. sort_index() also accepts na_position. Your DataFrame usually does not take the NaN value as part of its index, so this parameter is in sort_index(). However, I'm glad to know that if your DataFrame NaN does exist in the row index or column name, you can use it sort_index() and quickly identify this_ position.
By default, this parameter is set to last and the NaN value is placed at the end of the sorting result. To change this behavior and have lost data in your data frame first, set na_position to first.
Modify your DataFrame using the sorting method
In all the examples you've seen so far, it's true sort_values() and sort_ What methods do you call when index () has returned the data frame object. This is because the panda sorting does not work in place by default. In general, this is the most common and preferred way to analyze data using Pandas, because it creates a new DataFrame instead of modifying the original data. This allows you to preserve the data state when reading data from a file.
However, you can directly modify the original DataFrame True by specifying an optional parameter with an inplace value of. Most Pandas methods contain an inplace parameter. Next, you'll see some examples where inplace=True is used to properly sort the DataFrame.
. sort_values() in place
With inplace set to True, you modify the original data frame, so the sorting method returns None. city08 sorts the DataFrame by column value as in the first example, but inplace is set to True:
>>>
>>> df.sort_values("city08", inplace=True)
Notice how the call works sort_values() does not return a DataFrame. This is what the df original looks like:
>>>
>>> df
    city08  cylinders fuelType  ...            trany  year mpgData_
99       9          8  Premium  ...  Automatic 4-spd  1993      NaN
1        9         12  Regular  ...     Manual 5-spd  1985      NaN
80       9          8  Regular  ...  Automatic 3-spd  1985      NaN
47       9          8  Regular  ...  Automatic 3-spd  1985      NaN
3       10          8  Regular  ...  Automatic 3-spd  1985      NaN
..     ...        ...      ...  ...              ...   ...      ...
9       23          4  Regular  ...  Automatic 4-spd  1993     True
8       23          4  Regular  ...     Manual 5-spd  1993     True
7       23          4  Regular  ...  Automatic 3-spd  1993     True
76      23          4  Regular  ...     Manual 5-spd  1993     True
2       23          4  Regular  ...     Manual 5-spd  1985     True
[100 rows x 11 columns]
In the df object, the values are now sorted in ascending order based on the city08 column. Your original DataFrame has been modified and the changes will persist. It is usually a good idea to avoid inplace=True for analysis, because changes to the DataFrame cannot be undone.
. sort_index() local use
The next example shows that this inplace also applies to sort_index().
Since the index is created in ascending order when you read the files into the DataFrame, you can df modify the objects again to restore them to their original order. use. sort_ Set index() and inplace to True to modify the data frame:
>>>
>>> df.sort_index(inplace=True)
>>> df
    city08  cylinders fuelType  ...            trany  year mpgData_
0       19          4  Regular  ...     Manual 5-spd  1985     True
1        9         12  Regular  ...     Manual 5-spd  1985      NaN
2       23          4  Regular  ...     Manual 5-spd  1985     True
3       10          8  Regular  ...  Automatic 3-spd  1985      NaN
4       17          4  Premium  ...     Manual 5-spd  1993      NaN
..     ...        ...      ...  ...              ...   ...      ...
95      17          6  Regular  ...  Automatic 3-spd  1993     True
96      17          6  Regular  ...  Automatic 4-spd  1993      NaN
97      15          6  Regular  ...  Automatic 4-spd  1993      NaN
98      15          6  Regular  ...     Manual 5-spd  1993      NaN
99       9          8  Premium  ...  Automatic 4-spd  1993      NaN
[100 rows x 11 columns]
Your DataFrame is now in use sort_index(). Because your DataFrame still has its default index, sorting it in ascending order puts the data back in its original order.
If you are familiar with Python's built-in functions sort()and sorted(), the parameters available in the inplaceandas sorting method may feel very similar. For more information, you can see how to use sorted() and sort() in Python.
conclusion
You now know how to use the two core methods of the pandas Library: sort_values() and sort_index(). With this knowledge, you can perform basic data analysis using DataFrame. Although there are many similarities between the two methods, you can clearly know which method to use to perform different analysis tasks by looking at the differences between them.
In this tutorial, you learned how to:
- Sorts the Pandas DataFrame by the value of one or more columns
- Use the ascending parameter to change the sort order
- Use index to sort the DataFrame sort_index()
- Organize missing data when sorting values
- Use set to to sort DataFrame in place inplaceTrue
These methods are an important part of mastering data analysis. They will help you build a strong foundation from which you can perform more advanced Pandas operations. If you want to see some examples of more advanced usage of the Pandas sorting method, the Pandas documentation is a good resource.