Introduction
understand WebGL Basics After that, I went to see the logic of obtaining and analyzing wind farm data, and encountered problems again.
Installing ecCodes
In the article Sample source library In the instructions, first install ecCodes and try to use HomeBrew, but it doesn't work. So according to ecCodes The source library is compiled and installed locally.
In step 4, I encountered a problem:
No CMAKE_Fortran_COMPILER could be found.
The query data says that gfortran is missing. You can use the command to check whether it has been installed:
which gfortran
There are several Installation mode , I choose Download installation package.
After solving this problem, continue according to the instructions. The compilation and installation are successful. The version is 2.23.0.
Execute script
When executing the script, an error message appears:
grib_set: command not found grib_dump: command not found
However, grib was found in the bin directory of the previously installed folder_ Set executable. The inference is that it is not registered in the global path.
Check whether the ecCodes installation path is registered in the global path:
echo $PATH
The problem encountered here is that it is not registered in the global path. Please refer to the setting method here.
Modification example:
vim ./.bash_profile
After entering the editing mode, add the following content:
export ECCODE_HOME=/xx/xx/xx/xx/eccodesbuild/bin
export PATH=$PATH:$ECCODE_HOME
After saving, make it effective
source ./.bash_profile
To see if it works, try the command grib_set -h, if no effect is found, it may be related to the shell end used. See here.
Data generation
The script can be executed normally, but the generated data is incorrect:
undefined:1
{"u":,"v":}
Check the issues of the source library. Someone also mentioned this problem , I tried some methods inside and found this pull The modification of can work normally. So I fork ed, got the modified content, and changed some data. See XXHolic/webgl-wind .
Data meaning
In download In the SH script, after the data is obtained and parsed, a readable file TMP is generated JSON, take a look at the main structure and some data in this file:
{
  "u":{
    "messages" : [
      [
        {
          "key" : "name",
          "value" : "U component of wind"
        },
        {
          "key" : "Ni",
          "value" : 360
        },
        {
          "key" : "Nj",
          "value" : 181
        },
        {
          "key" : "values",
          "value" : [5.51964, 5.71964, ...]
        },
        {
          "key" : "maximum",
          "value" : 103.02
        },
        {
          "key" : "minimum",
          "value" : -36.0804
        }
      ]
    ]
  },
  "v":{
    "messages" : [
      [
        {
          "key" : "name",
          "value" : "V component of wind"
        },
        {
          "key" : "getNumberOfValues",
          "value" : 65160
        },
        {
          "key" : "values",
          "value" : [14.9446, 14.8446, ...]
        },
        {
          "key" : "maximum",
          "value" : 80.3446
        },
        {
          "key" : "minimum",
          "value" : -66.4554
        }
      ]
    ]
  }
}
There may be some doubts when you see this. The air flow in the atmosphere has both speed and direction, which can be mathematically represented by a vector. In meteorology, if we know the direction and magnitude of the wind, we can get the vector representing the wind, u component and v component:
// ws wind size θ  Mathematical direction description of wind
u = ws * cos(θ)
v = ws * sin(θ)
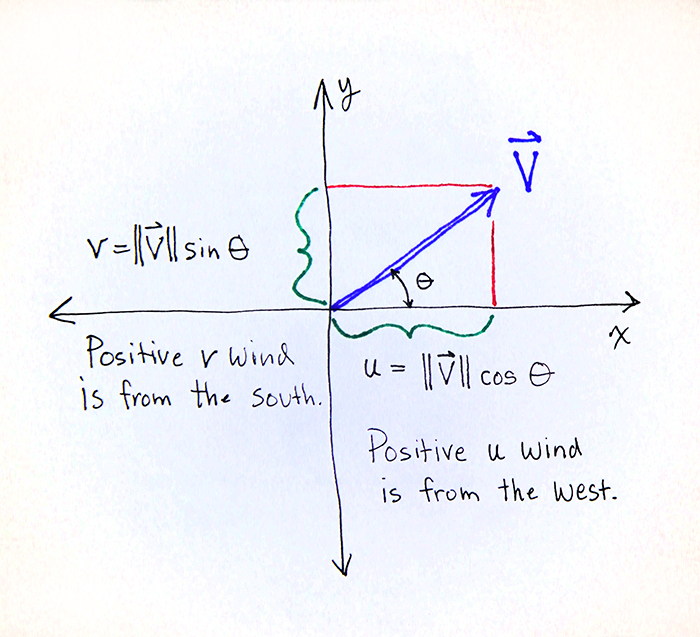
For more details, see Wind: u and v Components .
Then in prepare The key s used in wind data in JS are:
- Ni indicates how many points there are on a weft, simply how many columns there are.
- Nj indicates how many points there are on a meridian, simply how many lines there are.
- Values stores all values of the component.
- Minimum represents the minimum value of the component.
- Maximum represents the maximum value of the component.
Ni and Nj determine the width and height of the generated picture. The main logic of the color corresponding to the wind speed mapping is as follows:
for (let y = 0; y < height; y++) {
  for (let x = 0; x < width; x++) {
    const i = (y * width + x) * 4;
    const k = y * width + ((x + width / 2) % width);
    png.data[i + 0] = Math.floor(
      (255 * (u.values[k] - u.minimum)) / (u.maximum - u.minimum)
    );
    png.data[i + 1] = Math.floor(
      (255 * (v.values[k] - v.minimum)) / (v.maximum - v.minimum)
    );
    png.data[i + 2] = 0;
    png.data[i + 3] = 255;
  }
}- i: Used pngjs For the plug-in, the color uses RGBA mode. Every four consecutive positions in the array store the color value of a point, so the i variable should be a multiple of 4.
- k: It is used to obtain the index of wind speed. First, when y=0, the value of K increases first from 180 - > 359, and then from 0 - > 179. In this way, the value is taken from the middle. It is speculated that the display map is a two-dimensional world map, and the returned data is such a corresponding rule.
- Mapping method: take maximum - minimum as the benchmark, then calculate the relative value of wind speed values[k] - minimum, and multiply the ratio of the two values by the maximum value of color component 255.