1: Background
1. Tell a story
A few days ago, a friend jia wx complained that his program always had an inexplicable high cpu during the peak period. How to analyze it for help?


After communicating with this friend, it is said that this problem has plagued them for several years 😂, We also invited Microsoft engineers to solve the problem and ended up with nothing. We still didn't find the right boss of Microsoft...
As for the problem of high CPU explosion, regular readers should know that I have written several articles, which are basically divided into two categories:
GC trigger
Large number of lock locks
A few are all kinds of inexplicable problems, which cannot be listed one by one 🤣🤣🤣, Now that my friend has found me, I have to find a way to solve it for him. I don't talk much and go to windbg.
2: windbg analysis
1. View the synchronization block table
In case of this problem, it is my inertial thinking to check the synchronization block table for the first time. The command is very simple! syncblk .
0:000> !syncblk
Index SyncBlock MonitorHeld Recursion Owning Thread Info  SyncBlock Owner
-----------------------------
Total           20779
CCW             16
RCW             21
ComClassFactory 0
Free            16490
I went and threw an empty one. There was nothing in the synchronization block table... Since it has nothing to do with the lock, let's look at the thread. After all, the thread depends on the CPU.
2. View threads
To view the managed threads in the system, you can use! t command, there are many threads, which is a little simplified.
0:000> !t
ThreadCount:      135
UnstartedThread:  0
BackgroundThread: 132
PendingThread:    0
DeadThread:       1
Hosted Runtime:   no
                                                                                                        Lock
       ID OSID ThreadOBJ           State GC Mode     GC Alloc Context                  Domain           Count Apt Exception
  34    1 25d4 000001ea28702130    28220 Preemptive  0000000000000000:0000000000000000 000001ea286ee080 0     Ukn
  74    2 3ed0 000001ea286fa940    2b220 Preemptive  0000000000000000:0000000000000000 000001ea286ee080 0     MTA (Finalizer)
  76    3 4a70 000001f4447d7810  102a220 Preemptive  0000000000000000:0000000000000000 000001ea286ee080 0     MTA (Threadpool Worker)
  77    4 326c 000001f4447dbe60    21220 Preemptive  0000000000000000:0000000000000000 000001ea286ee080 0     Ukn
  78    6 2dac 000001f4447d9750  1020220 Preemptive  0000000000000000:0000000000000000 000001ea286ee080 0     Ukn (Threadpool Worker)
  79    7 1468 000001f444a2d6f0    21220 Preemptive  0000000000000000:0000000000000000 000001ea286ee080 1     Ukn (GC)
  80    8   f0 000001f444a2cf20    21220 Preemptive  0000000000000000:0000000000000000 000001ea286ee080 0     Ukn
  81    9 3118 000001f444a2f630    21220 Preemptive  0000000000000000:0000000000000000 000001ea286ee080 0     Ukn
First sell a pass, can a friend see what's different about these threads??? Yes, there is a Ukn (GC) tag in the last column of thread 79. I think you must be curious. What does this mean? There are some changes in the mode of the underlying GC, but anyway, it tells you to a certain extent that your program triggers GC. For further verification, you can use it! t -special see what category thread 79 belongs to and more detailed information.
0:000> !t -special
ThreadCount:      135
UnstartedThread:  0
BackgroundThread: 132
PendingThread:    0
DeadThread:       1
Hosted Runtime:   no
                                                                                                        Lock
       ID OSID ThreadOBJ           State GC Mode     GC Alloc Context                  Domain           Count Apt Exception
  34    1 25d4 000001ea28702130    28220 Preemptive  0000000000000000:0000000000000000 000001ea286ee080 0     Ukn
  79    7 1468 000001f444a2d6f0    21220 Preemptive  0000000000000000:0000000000000000 000001ea286ee080 1     Ukn (GC)

OSID Special thread type
41 38d8 DbgHelper
42 1c88 GC
74 3ed0 Finalizer
75 402c ProfilingAPIAttach
76 4a70 Timer
79 1468 GC SuspendEE
As you can see from the last line of output, 79 is the GC thread, followed by a strange SuspendEE tag. You're curious. What does that mean?
SuspendEE = Suspend CLR Execution Engine (EE)
In other words, thread 79 freezes the CLR execution engine for the simple purpose of facilitating the other 31 GC threads to take care of the current managed heap, but this old man machine is really 🐂👃, 32core, I don't know which hospital is so awesome. Add it! cpuid validation.
0:000> !cpuid
CP  F/M/S  Manufacturer     MHz
 0  6,62,4  <unavailable>   2600
 1  6,62,4  <unavailable>   2600
 2  6,62,4  <unavailable>   2600
 3  6,62,4  <unavailable>   2600
 xxx
31  6,62,4  <unavailable>   2600
Since the GC trigger is predicted, the next step is to call out the managed and unmanaged stacks of all threads.
3. View each thread stack
To view the managed and unmanaged stacks of each thread, it's easy to use! eestack, and then you can retrieve the keyword WaitUntilGCComplete to determine how many threads are waiting for GC processing to complete.
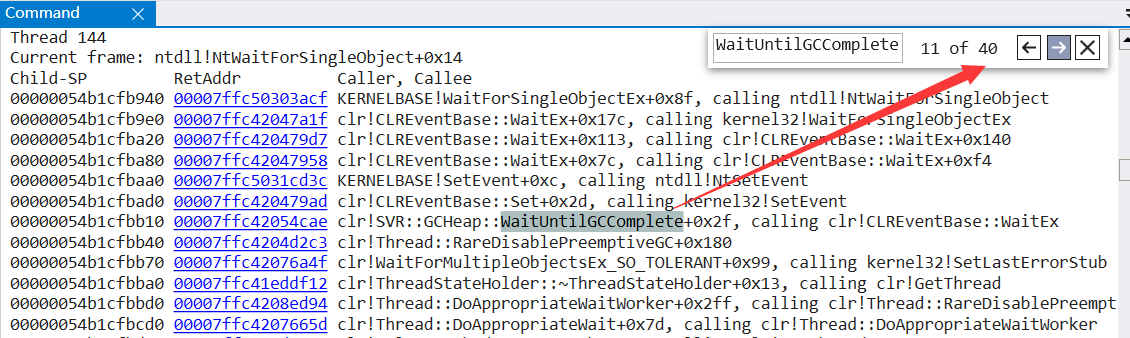
It can be seen from the figure that 40 threads are blocked at present. It's good. The problem is becoming clearer and clearer. Next, analyze which thread did what it shouldn't do, resulting in GC triggering. You can also search try_allocate_more_space to determine which threads are allocating space.
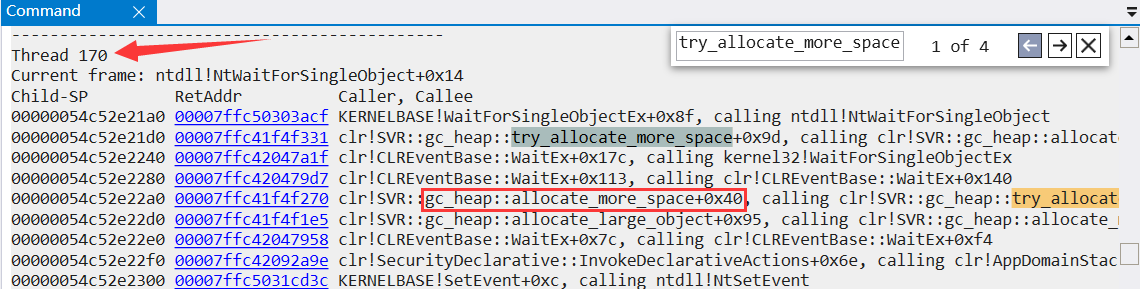
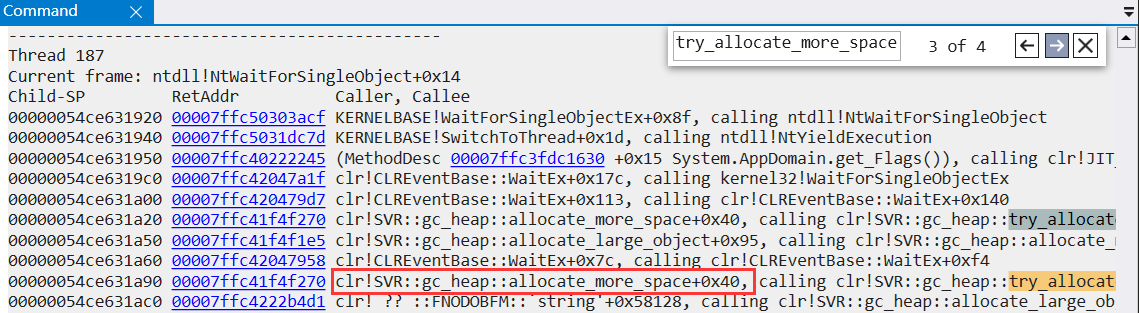
I'll go. It's obvious that threads 170 and 187 are allocating large objects_ heap::allocate_ large_ Object triggers GC. The large object heap itself is a daunting thing. Its recycling and cleaning are very CPU intensive. This is also consistent with the fact that the CPU drops in about one minute.
4. Find the culprit
Now the focus is on these two threads. I've seen that these two thread stacks are the same method, so here's a 187 thread to analyze. It can be used! clrstack looks at its hosting stack.
0:187> !clrstack
OS Thread Id: 0x1ef0 (187)
        Child SP               IP Call Site
00000054ce631e30 00007ffc4021bde2 System.String.FillStringChecked(System.String, Int32, System.String)
00000054ce631e70 00007ffc402222a8 System.String.ConcatArray(System.String[], Int32)
00000054ce631ed0 00007ffc40223528 System.String.Concat(System.String[])
00000054ce631f40 00007ffbe6dbdafb BLL.xxx.xxx.GetRowString(System.String, Boolean, Boolean, System.String, System.String, System.String, System.String, System.String, System.String, Int32, System.String, System.String, System.String, System.String, System.String, System.String, Int32, Int32, System.String, System.Nullable`1, System.Nullable`1, System.String, System.Nullable`1, System.Nullable`1, System.Nullable`1, System.Nullable`1, System.String, System.String, System.String, System.String, System.String ByRef)
00000054ce65cf40 00007ffbe6ab3187 BLL.xxx.xxx.ExpZB(System.String, Boolean, Boolean, System.String, System.String, System.String, System.String, Int32, System.String, System.String, System.String, Int32, System.String, System.String, System.String, System.String, System.String, System.String, Int32, Int32, System.String, System.Nullable`1, System.Nullable`1, System.String, System.Nullable`1, System.Nullable`1, System.Nullable`1, System.Nullable`1, System.String, System.String, System.String, System.String)
From the stack point of view, it seems to use system String. Concat splicing is caused by string. Good guy, string splicing has been criticized many times over the years. There are still many people stepping on the pit 😓😓😓, For further verification, you can use! clrstack -p + !da -details xxx look at this system What exactly is string [] simplified as follows:
0:187> !clrstack -p
OS Thread Id: 0x1ef0 (187)
00000054ce631e70 00007ffc402222a8 System.String.ConcatArray(System.String[], Int32)
    PARAMETERS:
        values (<CLR reg>) = 0x000001ea69e8d2f8
        totalLength = <no data>
0:187> !da -details 0x000001ea69e8d2f8
Name:        System.String[]
Size:        128(0x80) bytes
Array:       Rank 1, Number of elements 13, Type CLASS
Element Methodtable: 00007ffc403d6948
[0] 000001f2391a83f0
    Name:        System.String
    MethodTable: 00007ffc403d6948
    EEClass:     00007ffc3fcd50e0
    Size:        445950(0x6cdfe) bytes
    File:        C:\Windows\Microsoft.Net\assembly\GAC_64\mscorlib\v4.0_4.0.0.0__b77a5c561934e089\mscorlib.dll
    String:      xxxxx
From the output information, we can see that there are 13 elements in string [], of which the largest string is 445950 bytes = 445k, which is larger than the 85k definition of large objects. Therefore, Concat here is the crux, and the same is true for thread 170. The next question I have to solve is: why is such a large string generated, What is done in the code??? To find the answer, you have to export the source code from dump to find out.
5. Check the problem code
To analyze the problem code, you can use! ip2md + !savemodule export Bll xxx. xxx. Getrowstring method.
0:187> !ip2md 00007ffbe6dbdafb
MethodDesc:   00007ffbe5342118
Method Name:  BLL.xxx.xxx.GetRowString(System.String, Boolean, Boolean, System.String, System.String, System.String, System.String, System.String, System.String, Int32, System.String, System.String, System.String, System.String, System.String, System.String, Int32, Int32, System.String, System.Nullable`1<Int32>, System.Nullable`1<Int32>, System.String, System.Nullable`1<Single>, System.Nullable`1<Single>, System.Nullable`1<Single>, System.Nullable`1<Single>, System.String, System.String, System.String, System.String, System.String ByRef)
Class:        00007ffbe52fe328
MethodTable:  00007ffbe53421d8
mdToken:      0000000006000096
Module:       00007ffbe471a890
0:187> !savemodule  00007ffbe471a890 E:\dumps\RowString.dll
3 sections in file
section 0 - VA=2000, VASize=f7fcc, FileAddr=200, FileSize=f8000
section 1 - VA=fa000, VASize=3bc, FileAddr=f8200, FileSize=400
section 2 - VA=fc000, VASize=c, FileAddr=f8600, FileSize=200
Then, ILSpy decompiles this code.
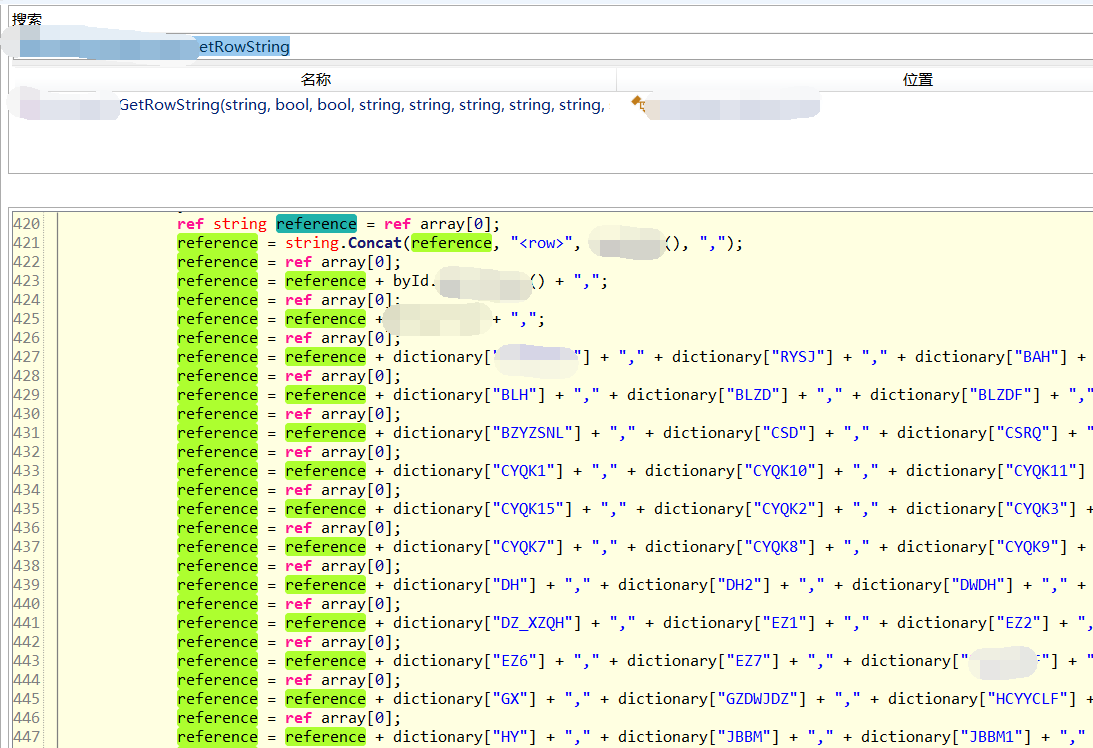
Good guy, it's really written 🐂👃, With countless string splices, I feel that gen and LOH have no time to allocate memory segments 😥😥😥, It really killed GC...
3: Summary
In fact, this is a textbook problem and there are also textbook solutions. Moreover, I have seen that this method has more than 600 lines of code, basically doing string splicing. Finally, let's talk about the solution.
- Refactor this method and try to replace String with StringBuilder to minimize the number of GC triggers.
It seems that the result of this analysis coincides with the deep suspicion of friends...

More high quality dry goods: see my GitHub: dotnetfly