1. Preprocessing instruction
-
When compiling software, there are often two versions, such as a basic version and an advanced version, which requires preprocessing instructions.
-
Using preprocessing instructions, you can compile a part of the code by the binary compiler, and you can also compile the code related to external functions by the binary compiler.
-
There is no separate preprocessor in C # and the compiler directly preprocesses it
-
All preprocessing instructions begin with # such as:
-
#defing and undef:
- It does not contain practical significance and has no effect when used alone
- It must be used at the beginning of the program and before any other keywords, such as those instructions in the namespace declaration, otherwise the following error will be reported
- It is meaningful to use it in combination with #if, #elif, #else

-
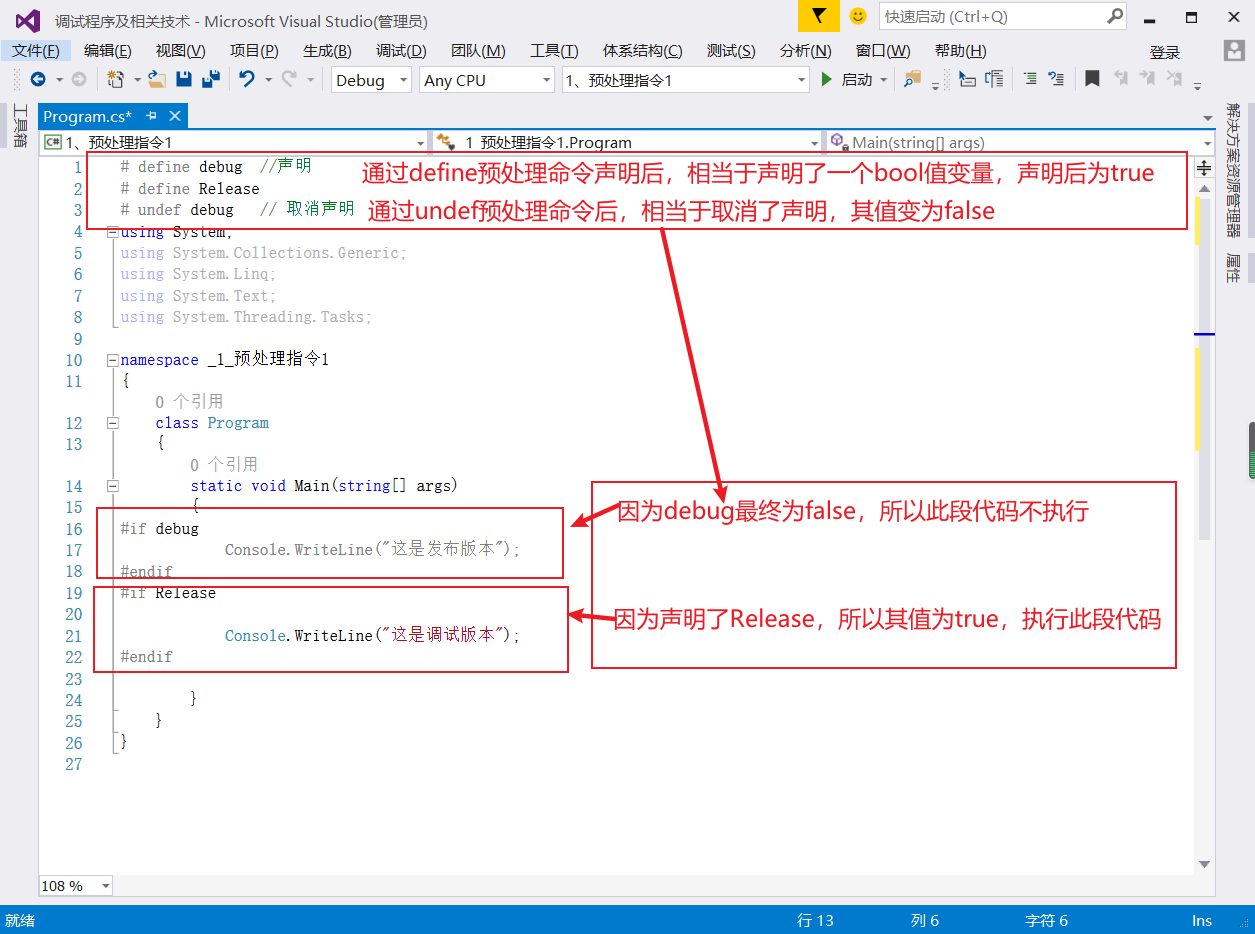
#if #elif #else and #endif
- Tells the compiler whether to execute an edge on a piece of code
# define debug / / declaration
# define Release
//#undef debug / / cancel the declaration
# undef Release
using System;

namespace _1_Preprocessing instruction 1
{
    class Program
    {
        static void Main(string[] args)
        {
#if (!debug) && Release

            Console.WriteLine("Only release versions exist");
#elif debug && Release
            Console.WriteLine("Two versions exist at the same time, which is not allowed");
#elif debug && (!Release)
            Console.WriteLine("Only debug versions exist");
#else
            Console.WriteLine("Neither version exists");
#endif
            Console.ReadLine();

        }
    }
}
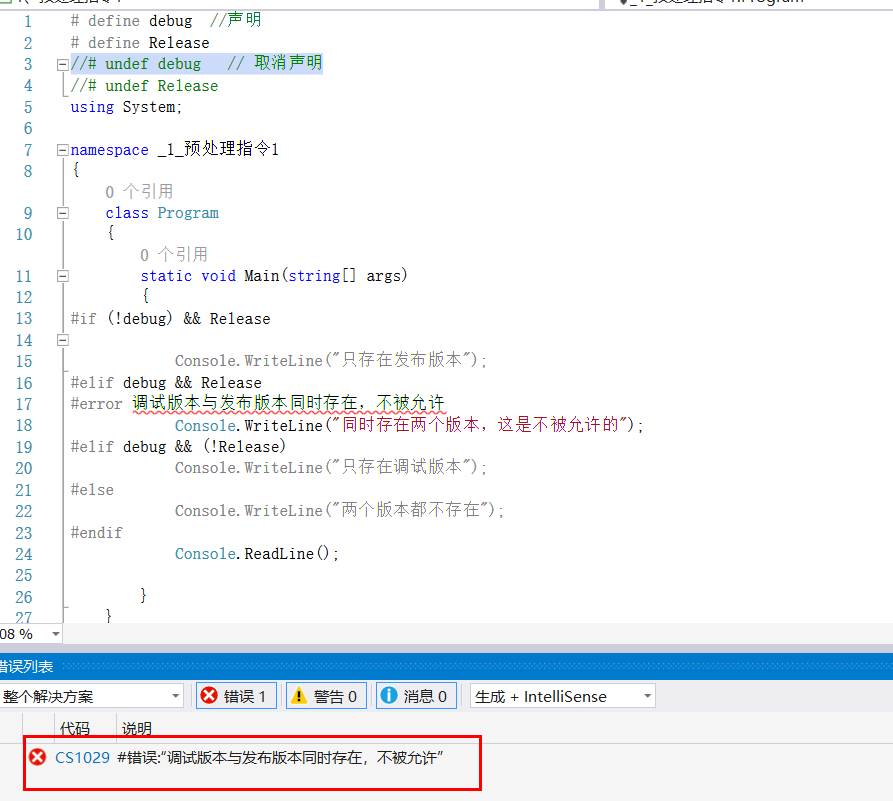
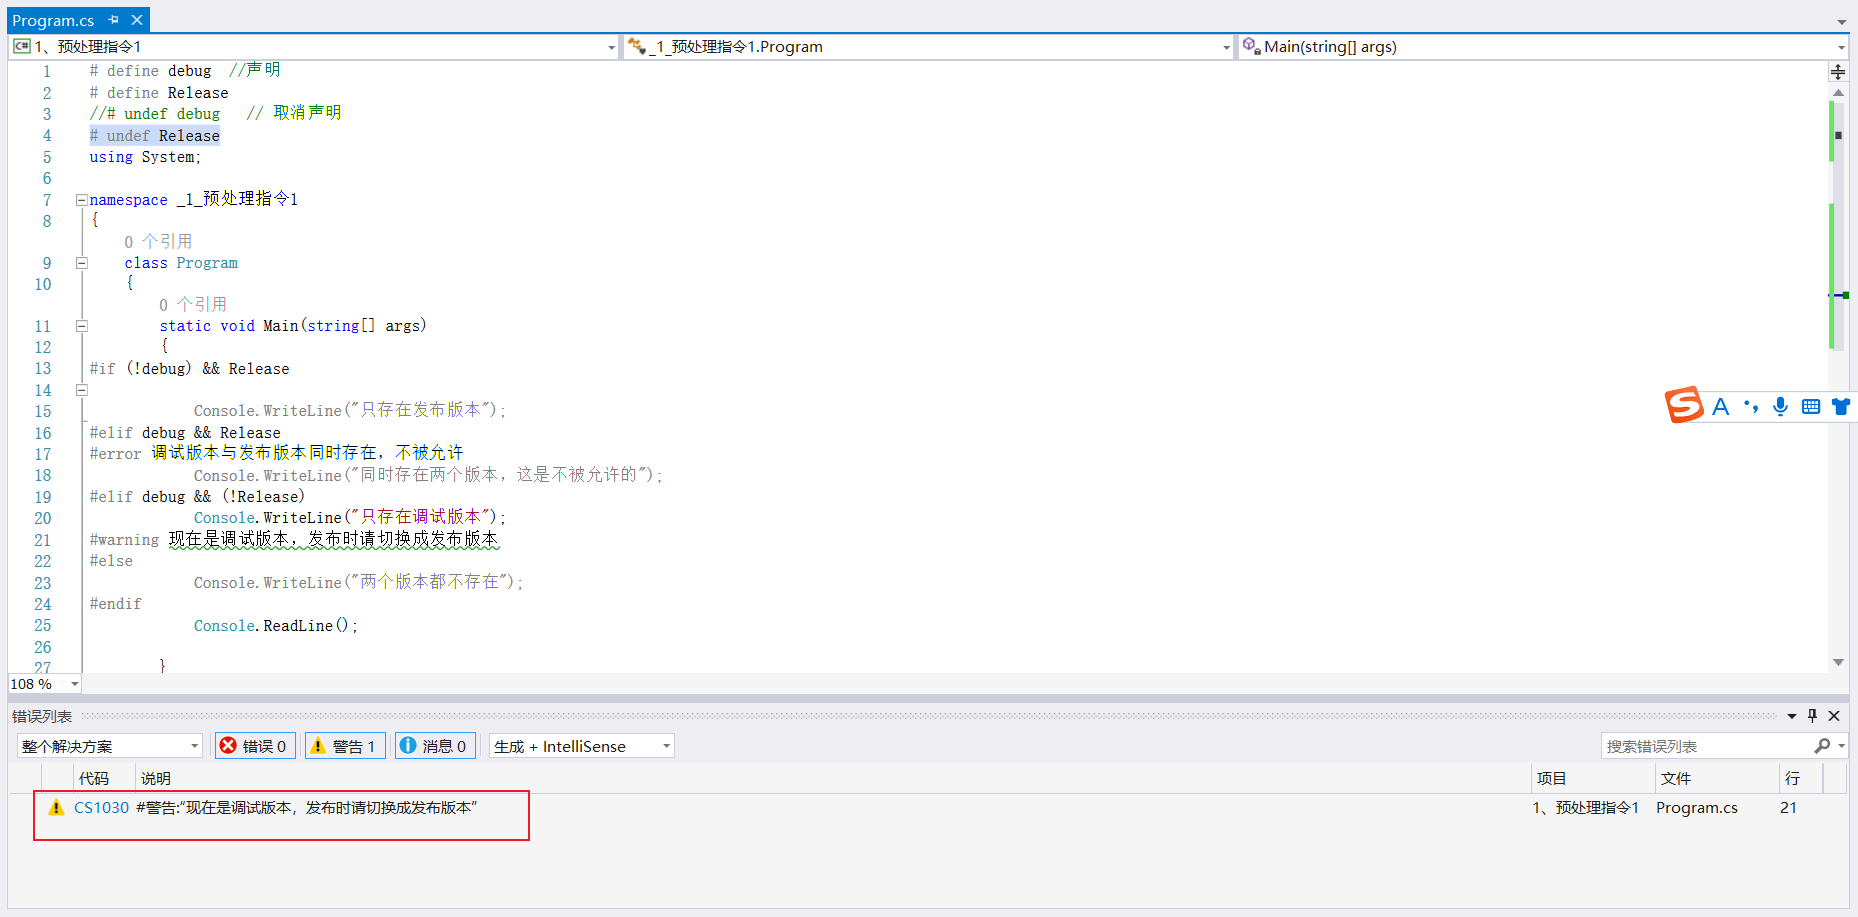
- #Warning and #error
Use these two instructions to check whether #defing is wrong, and use the #warning statement to remind yourself of what you have done
# define debug / / declaration
# define Release
//#undef debug / / cancel the declaration
# undef Release
using System;
namespace _1_Preprocessing instruction 1
{
class Program
{
static void Main(string[] args)
{
#if (!debug) && Release
Console.WriteLine("Only release versions exist");
#elif debug && Release
#error debug version and release version exist at the same time and are not allowed
Console.WriteLine("Two versions exist at the same time, which is not allowed");
#elif debug && (!Release)
Console.WriteLine("Only debug versions exist");
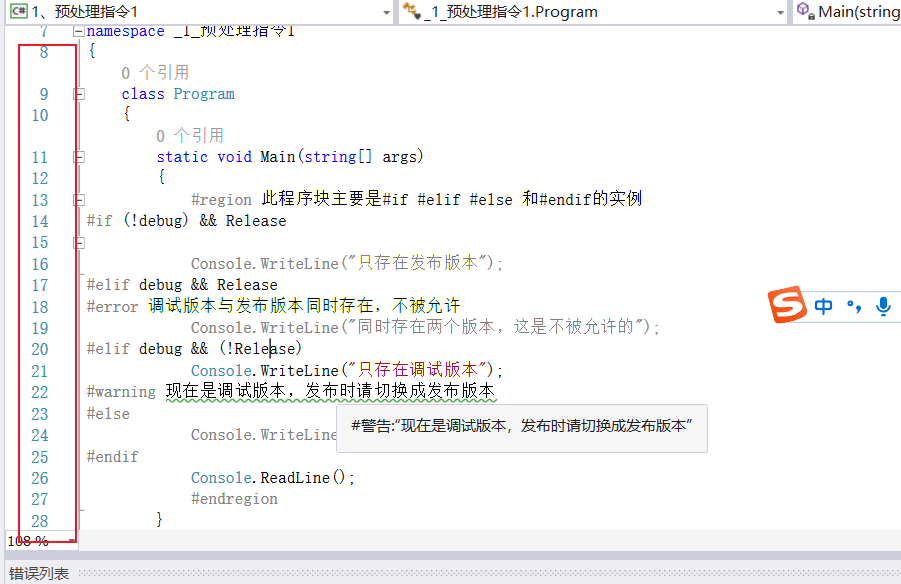
#warning is now a debug version. Please switch to the release version when publishing
#else
Console.WriteLine("Neither version exists");
#endif
Console.ReadLine();
}
}
}
-
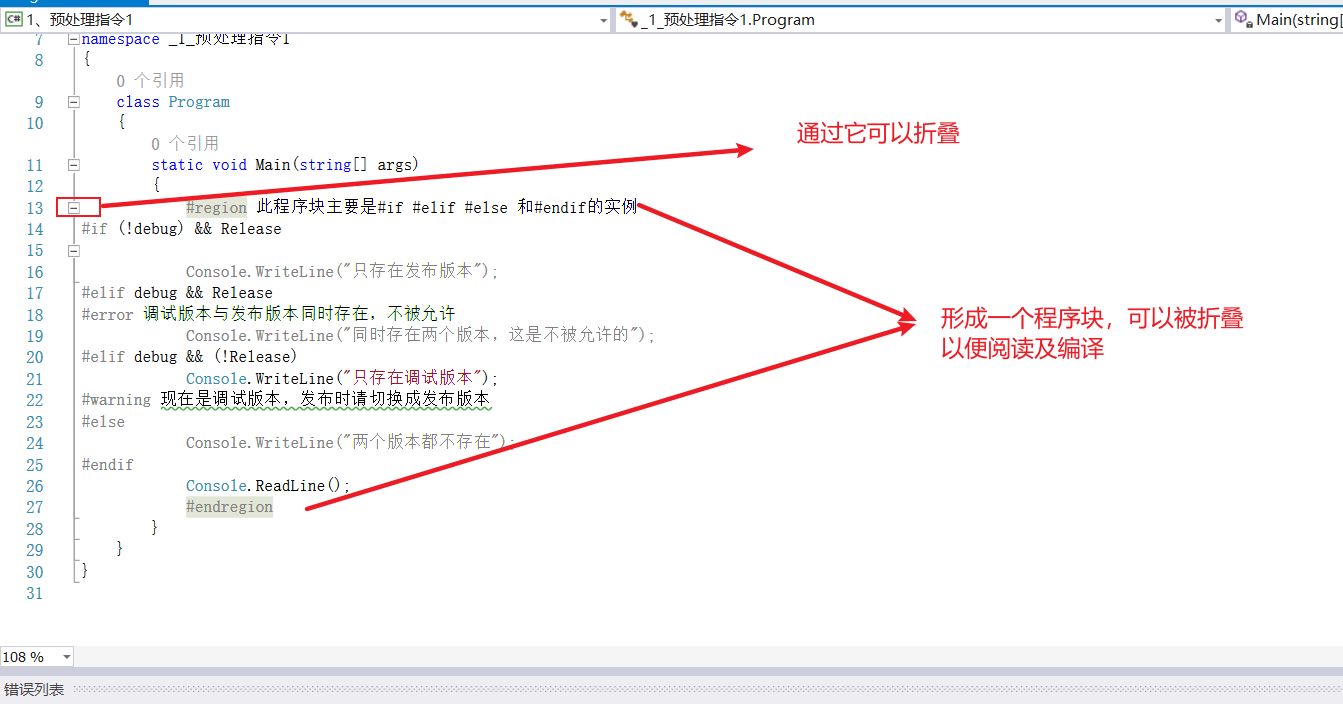
#region and #endregion
- Marking a piece of code to any specified block can be separated by the compiler, making the program more readable
- Marking a piece of code to any specified block can be separated by the compiler, making the program more readable
-
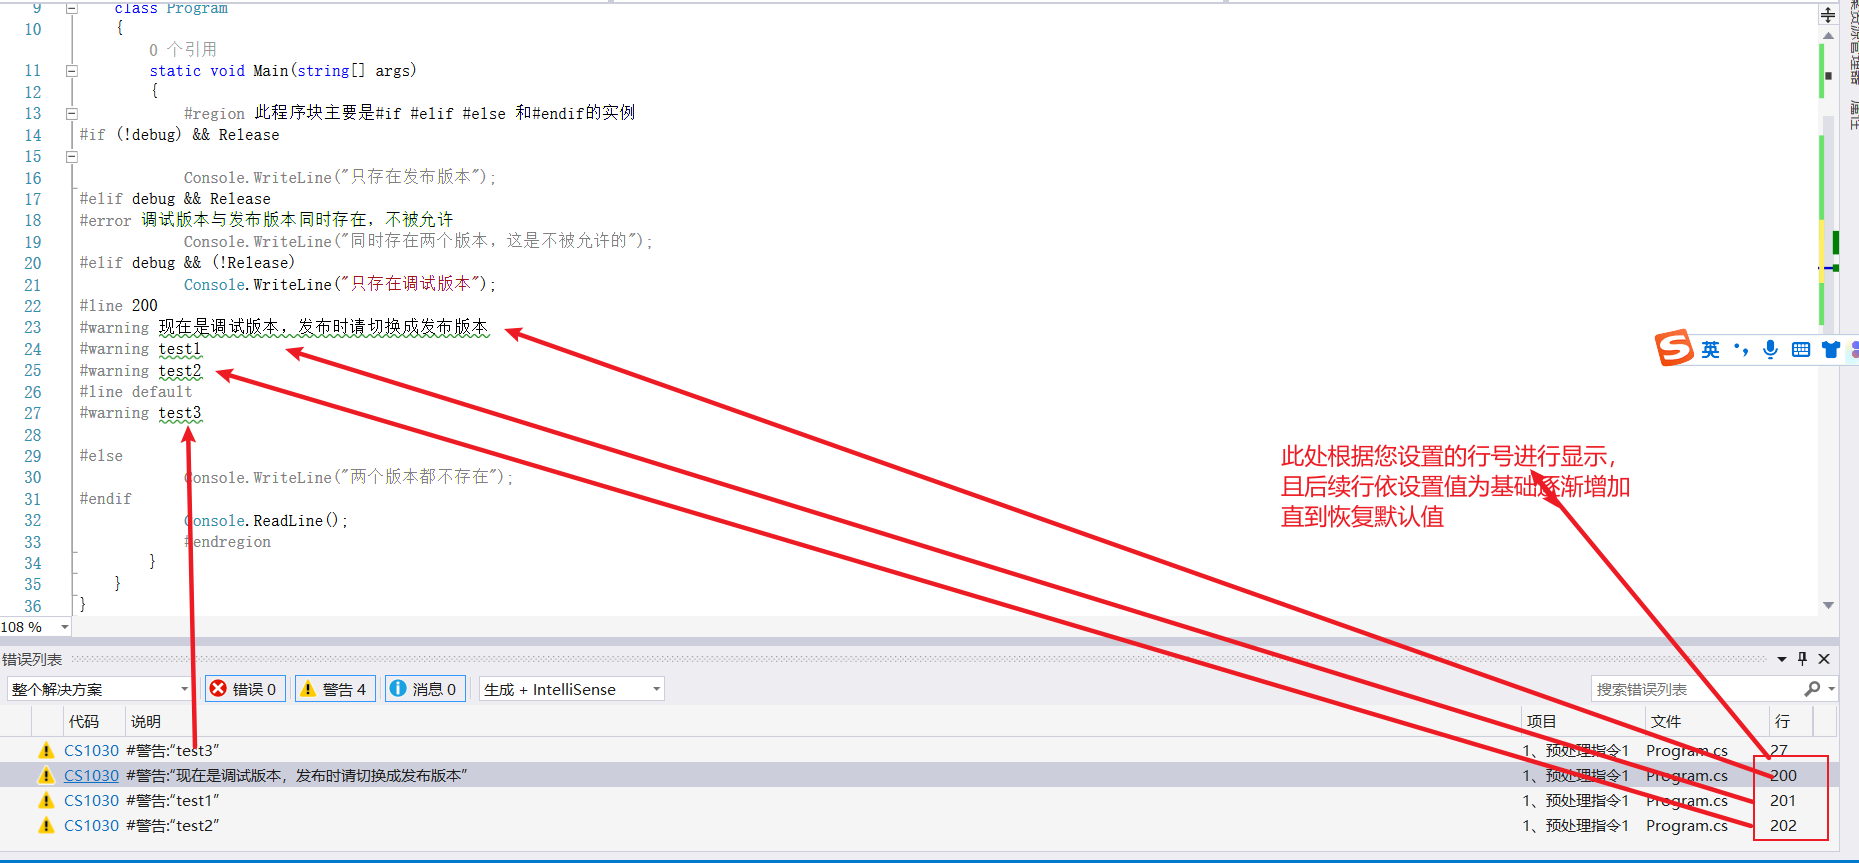
#line
- Used to change the file name and line number information displayed by the compiler in warning and error messages
- How to restore the default line number: # line default
# define debug / / declaration
# define Release
//#undef debug / / cancel the declaration
# undef Release
using System;

namespace _1_Preprocessing instruction 1
{
    class Program
    {
        static void Main(string[] args)
        {
            #region This block is mainly#if #elif #else and#Instance of endif
#if (!debug) && Release

            Console.WriteLine("Only release versions exist");
#elif debug && Release
#error debug version and release version exist at the same time and are not allowed
            Console.WriteLine("Two versions exist at the same time, which is not allowed");
#elif debug && (!Release)
            Console.WriteLine("Only debug versions exist");
#line 200
#warning is now a debug version. Please switch to the release version when publishing
#warning test1
#warning test2
#line default
#warning test3

#else
            Console.WriteLine("Neither version exists");
#endif
            Console.ReadLine();
            #endregion
        }
    }
}
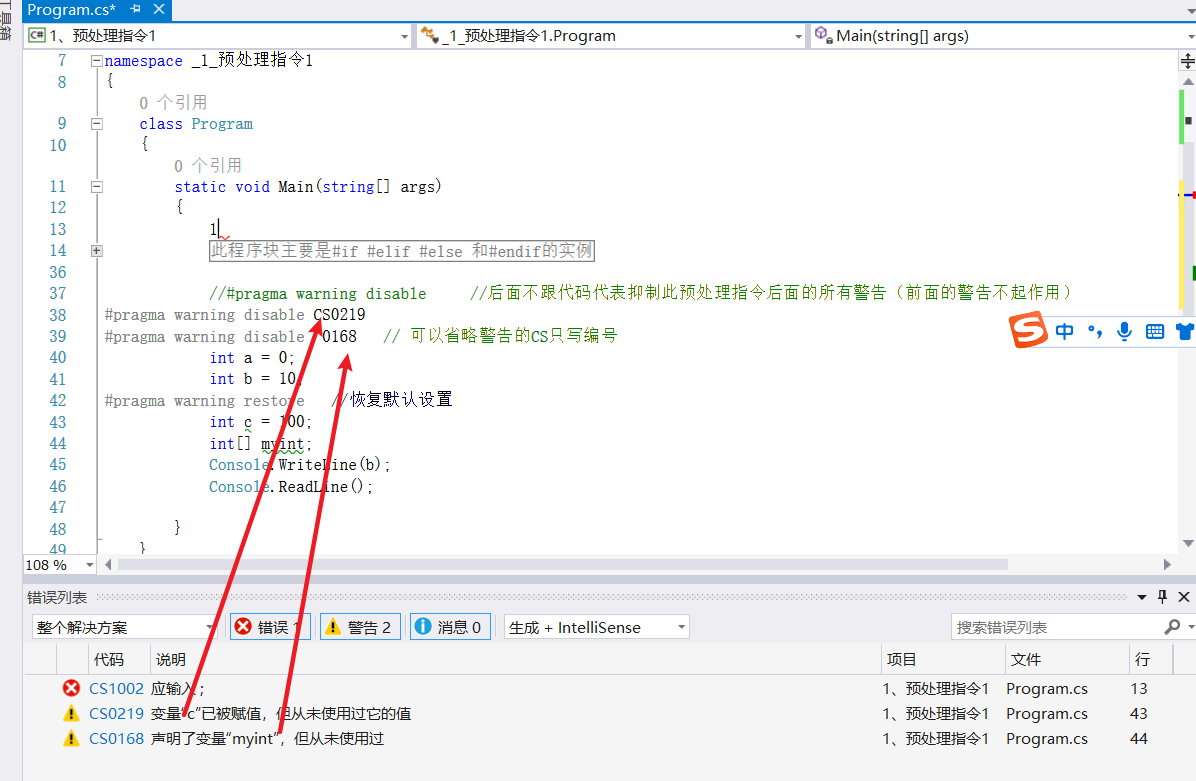
- #pragma
You can suppress or recover specified compilation warnings- disable: inhibit
- restore: restore
- CS can be omitted
# define debug / / declaration
# define Release
//#undef debug / / cancel the declaration
# undef Release
using System;

namespace _1_Preprocessing instruction 1
{
    class Program
    {
        static void Main(string[] args)
        {

            #region This block is mainly#if #elif #else and#Instance of endif
#pragma warning disable CS1030
#if (!debug) && Release

            Console.WriteLine("Only release versions exist");
#elif debug && Release
#error debug version and release version exist at the same time and are not allowed
            Console.WriteLine("Two versions exist at the same time, which is not allowed");
#elif debug && (!Release)
            Console.WriteLine("Only debug versions exist");
#line 200
#warning is now a debug version. Please switch to the release version when publishing
#warning test1
#warning test2
#line default
#warning test3

#else
            Console.WriteLine("Neither version exists");
#endif
            Console.ReadLine();
            #endregion

            //#pragma warning disable / / not followed by code means to suppress all warnings following this preprocessing instruction (the previous warnings do not work)
#pragma warning disable CS0219 / / error code with CS
#Pragma warning disable 0168 / / you can omit the CS of the warning and write only the number
            int a = 0;
            int b = 10;
#pragma warning restore / / restore the default settings
            int c = 100;
            int[] myint;
            Console.WriteLine(b);
            Console.ReadLine();

        }
    }
}
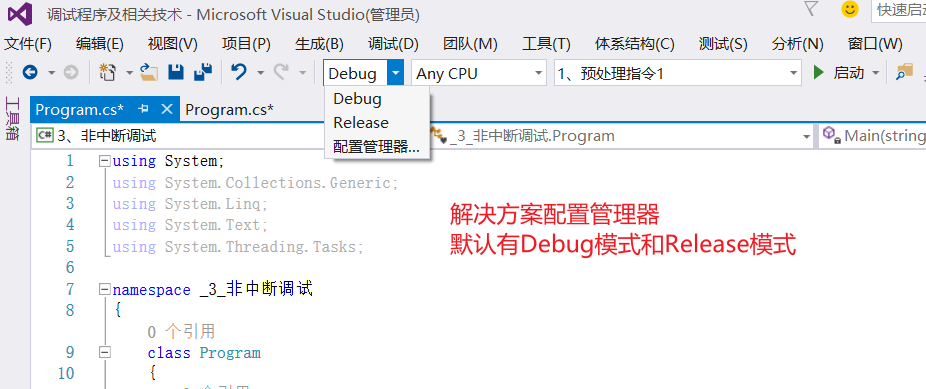
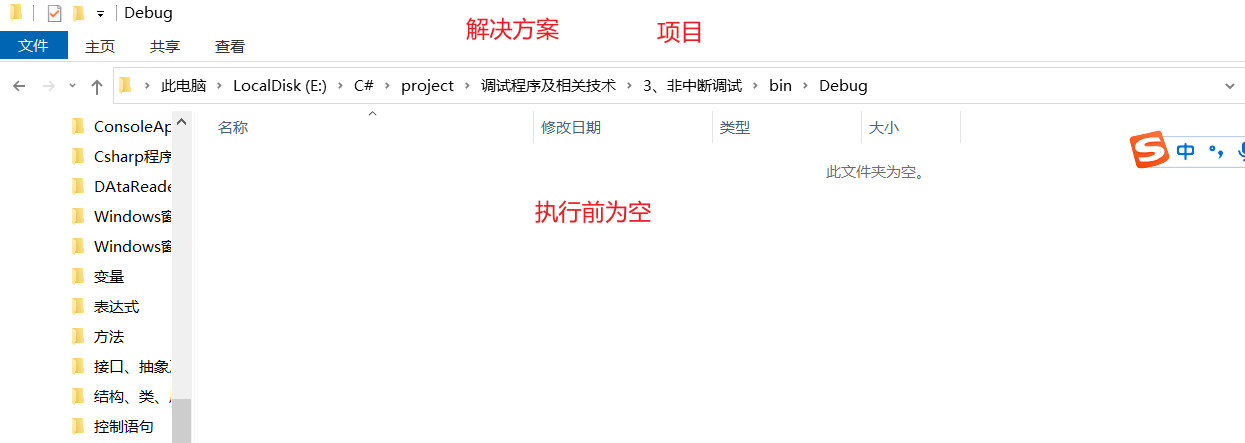
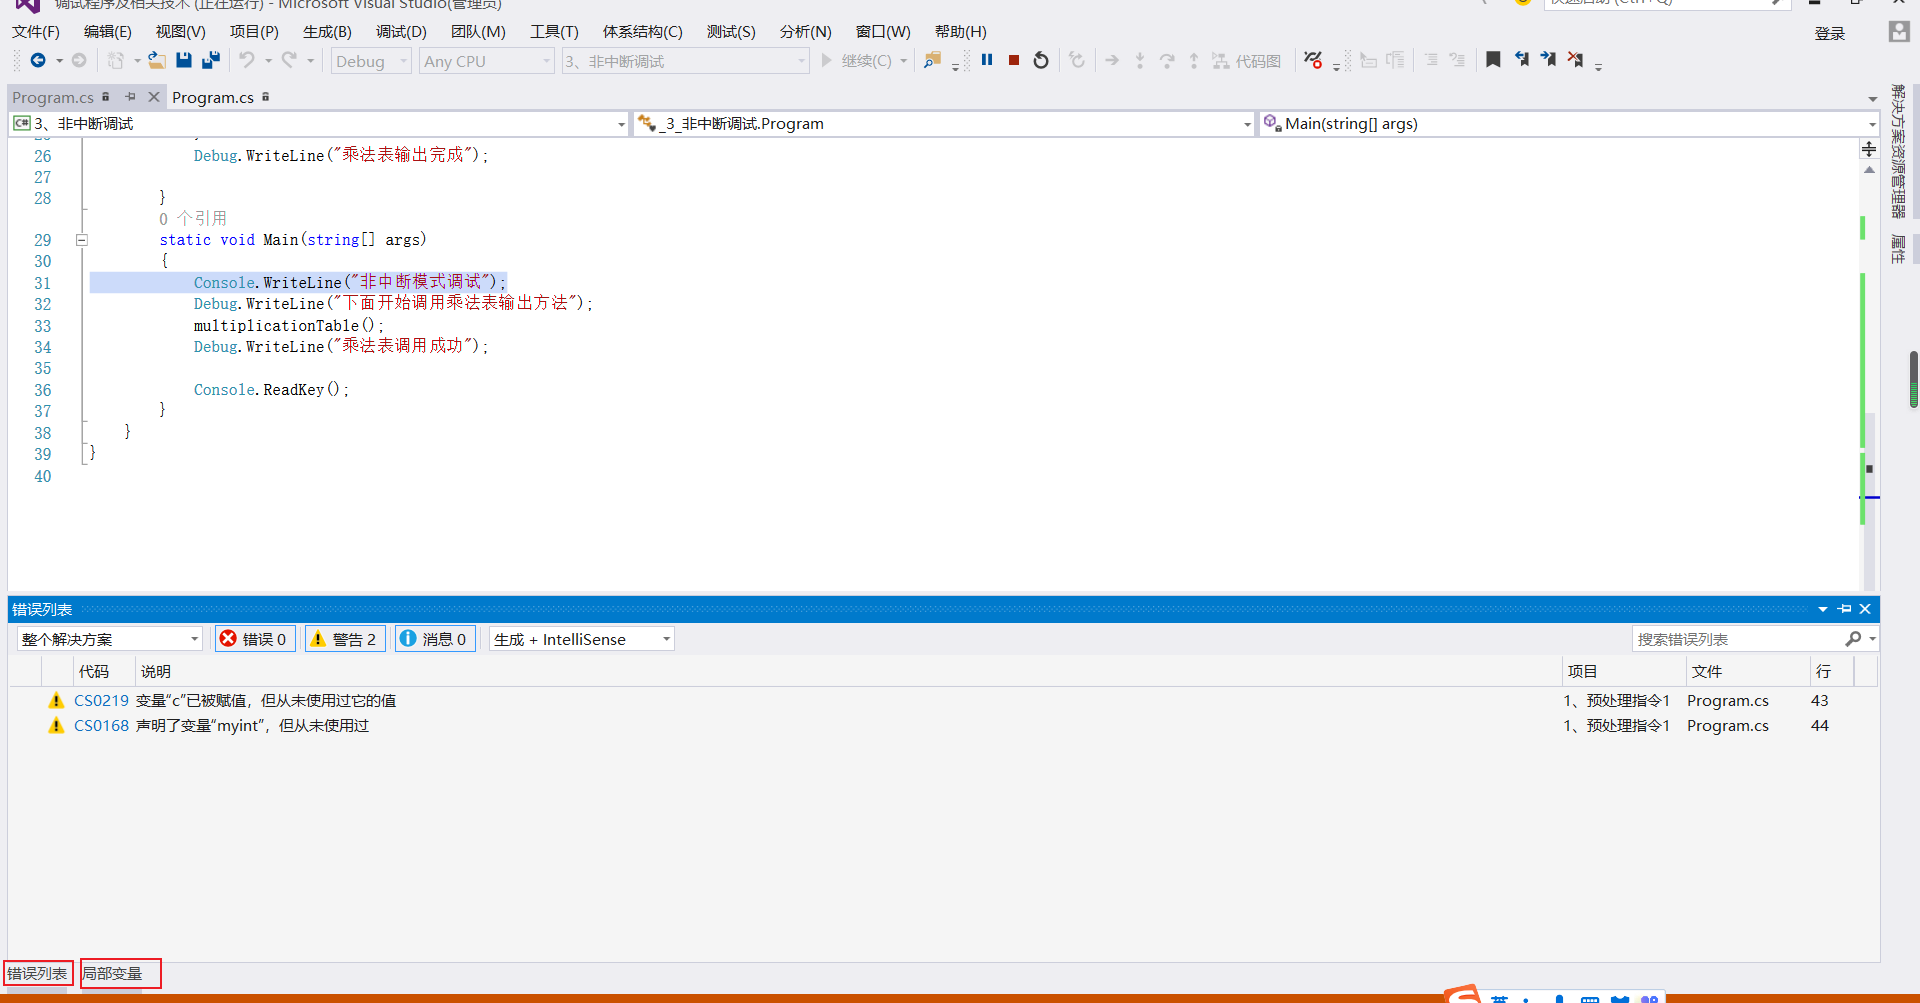
Non disruptive debugging
When building applications, there are two configurations of solutions
- Debug (default)
- Release
- Generating an application under the debug configuration is not only to run the written code, but also the debugger contains the symbol information of the application. VS knows what happens when executing each line of code. Symbolic information can match existing values in compiled machine code applications that contain information read by people. Such information is contained in pdb files, which are located in the debug directory of the computer.
Debug and Release modes
- Debug
- Output debugging information to IDE
- View the values of variables within the scope during the execution of the application
- Pause program and restart program
- Automatically pause the execution of the program at a certain position in the code
- Execute one line of code in the program at a time
- See changes in variables
- Modify the contents of variables
- Call of test function
- In the Release configuration, the compiler will optimize the application code without performing these operations. At the same time, the Release version runs faster. After the application development is completed, the Release version should generally be provided to the user, because the Release version does not need the symbol information contained in the debug version
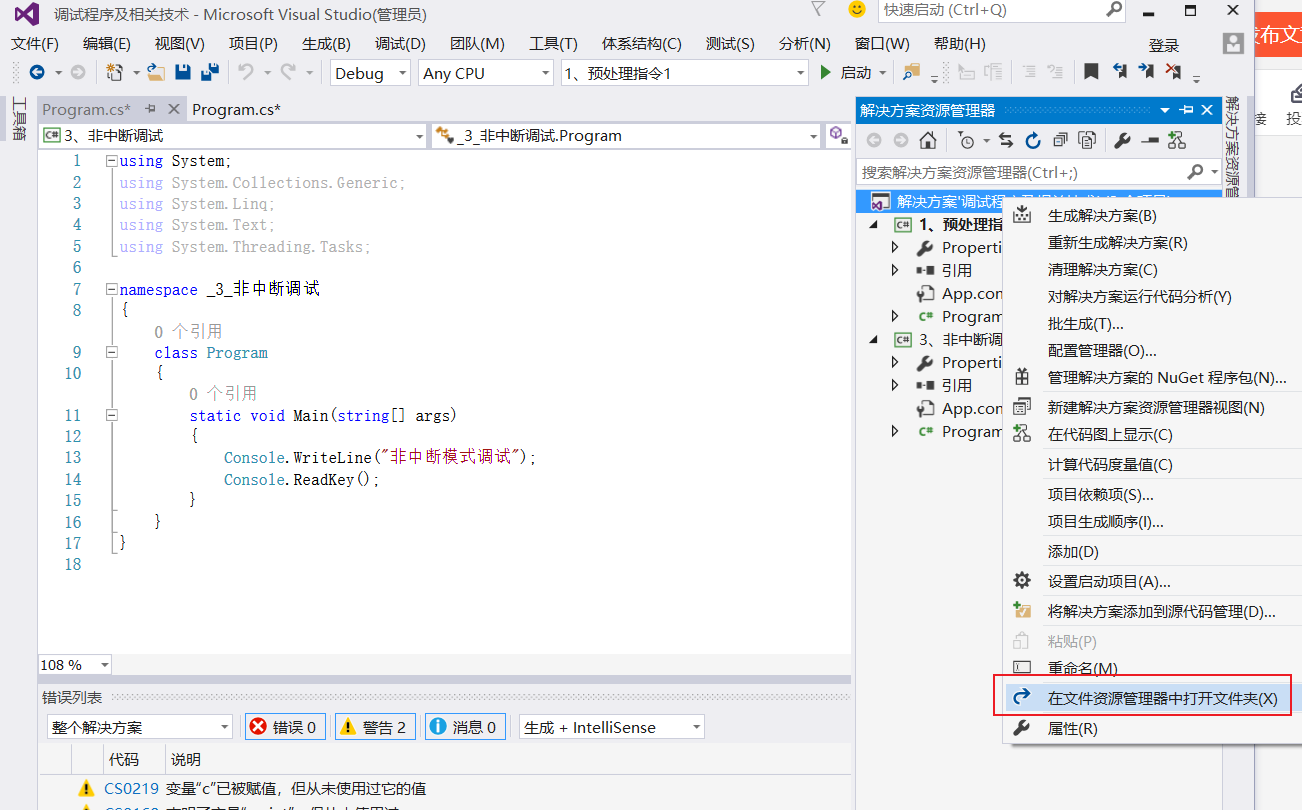
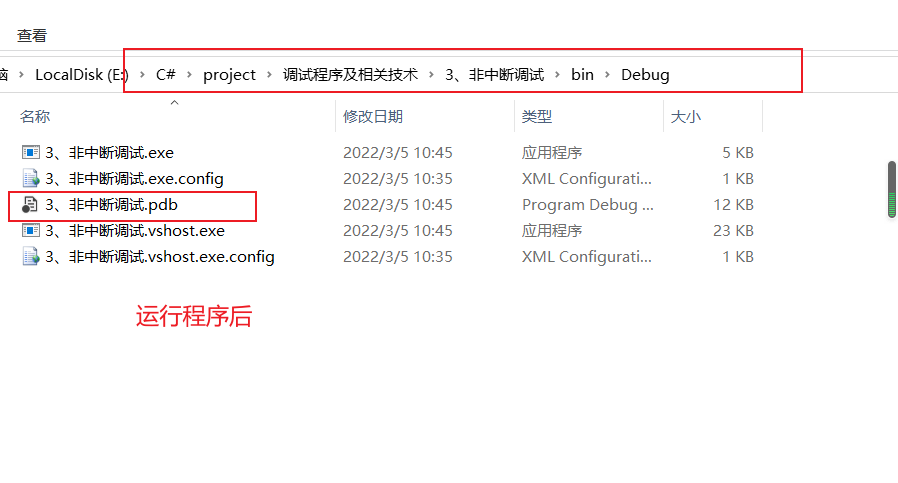
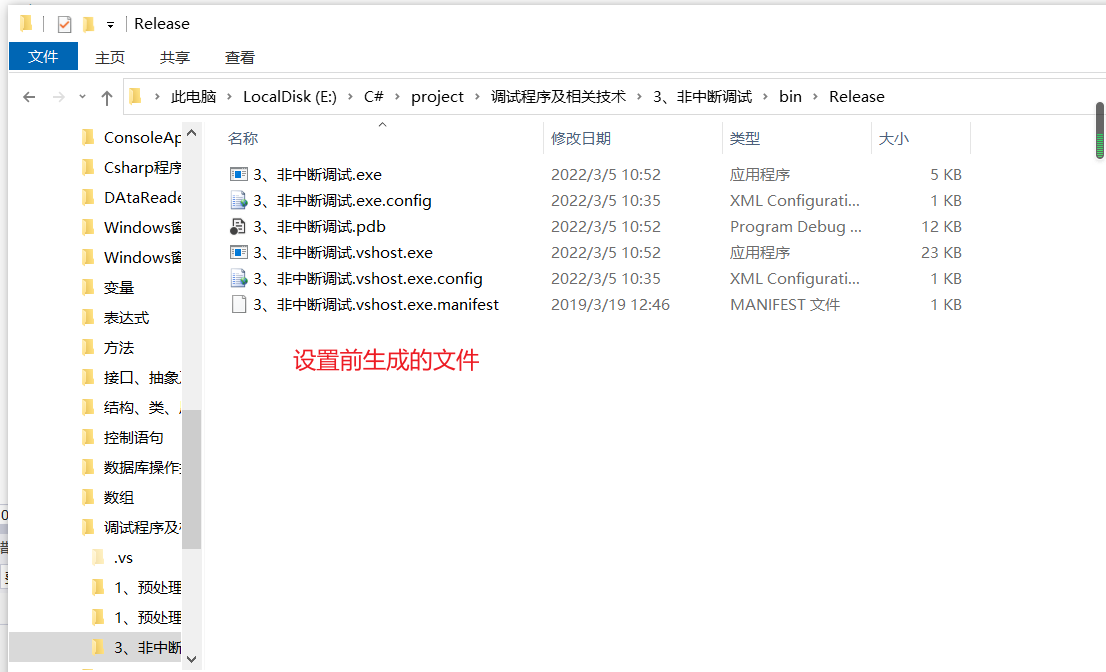
- Even if Release is selected, the extension will be generated vshost.exe and pdb files
*.vshost.exe and * pdb
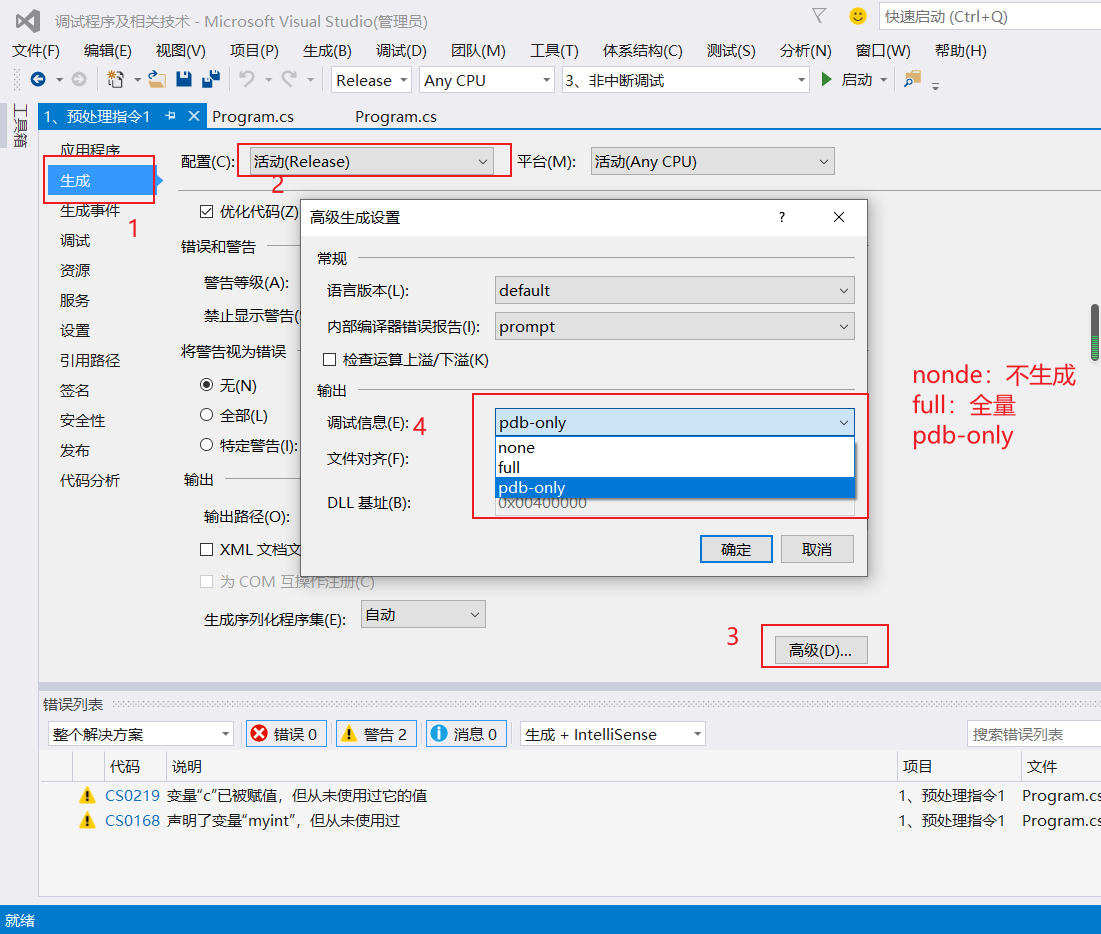
- . pdb file: under the default setting of Program Database File:
- The PDB of Debug is full, which saves debugging and project status information. There are assertions, stack checks and other codes, which can incrementally link the debugging configuration of the program.
- The PDB of Release is formulated as PDB only, which saves what errors have occurred in the program and what lines of errors have occurred
- .vshost.exe file VS host process file is a function in visual studio, which is mainly used to improve debugging performance. It's best to delete it during Release.
- .vshost.exe.manifest file:
- It's a good idea The XML file with the suffix of manifest is used for binding and activating COM classes, interfaces and libraries because the organization and description of applications and parallel components are separated. In the past, these information was stored in the registry
- Manifests also specifies the files of component assemblies and Windows classes. It is also best to delete them during Release.
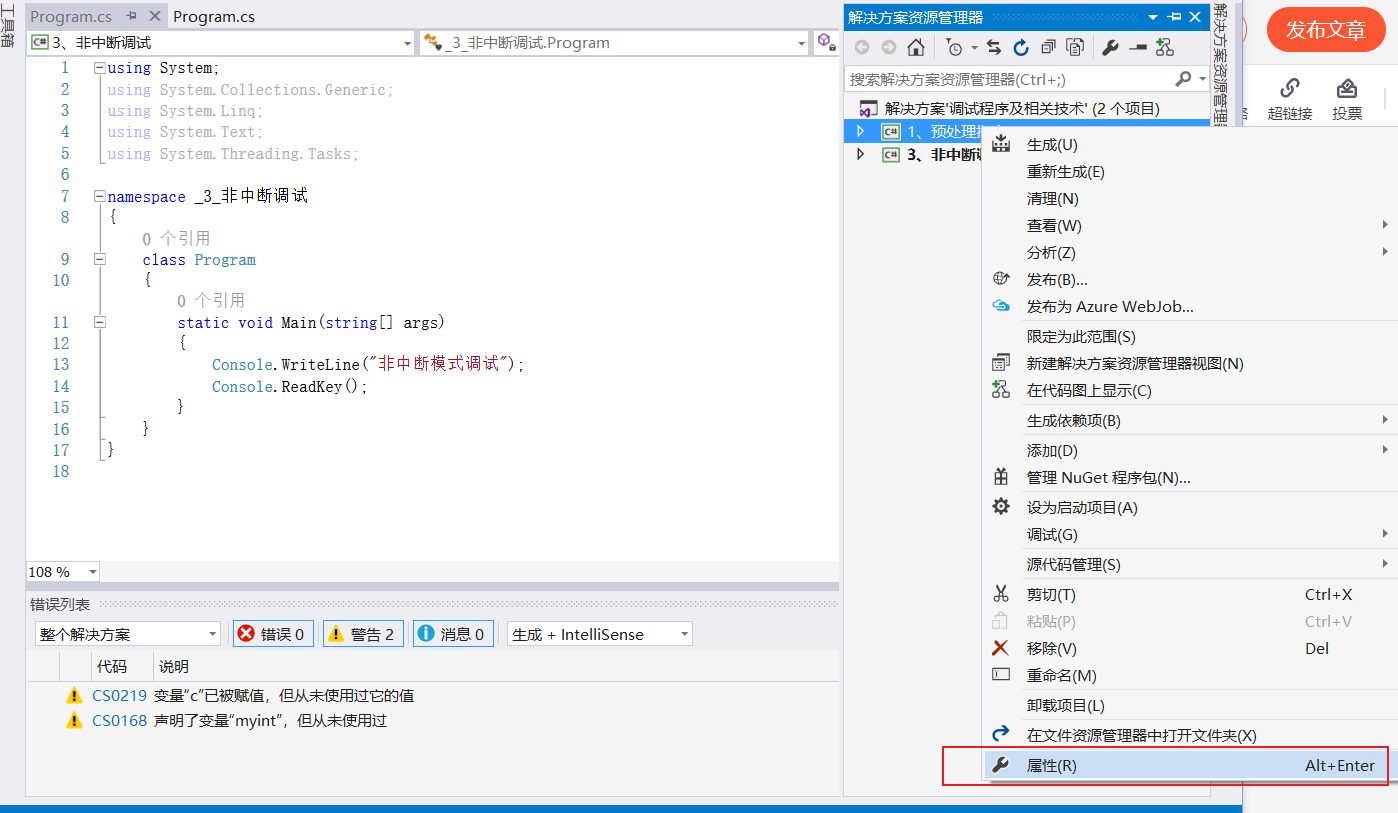
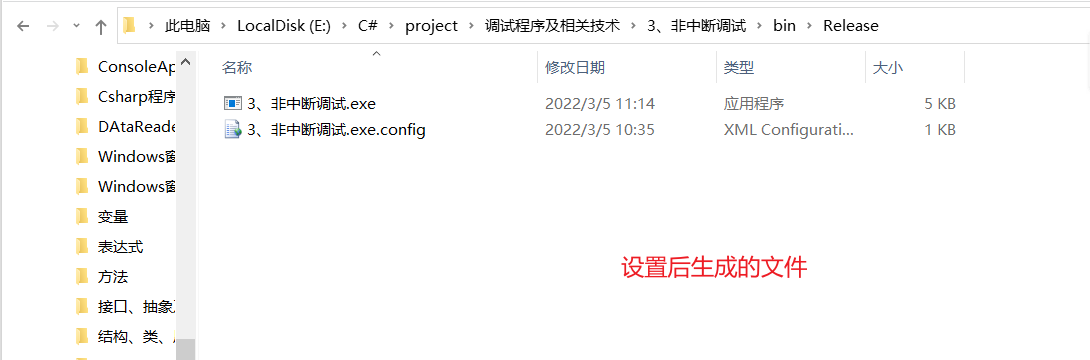
Do not generate * pdb and * vshost.exe method
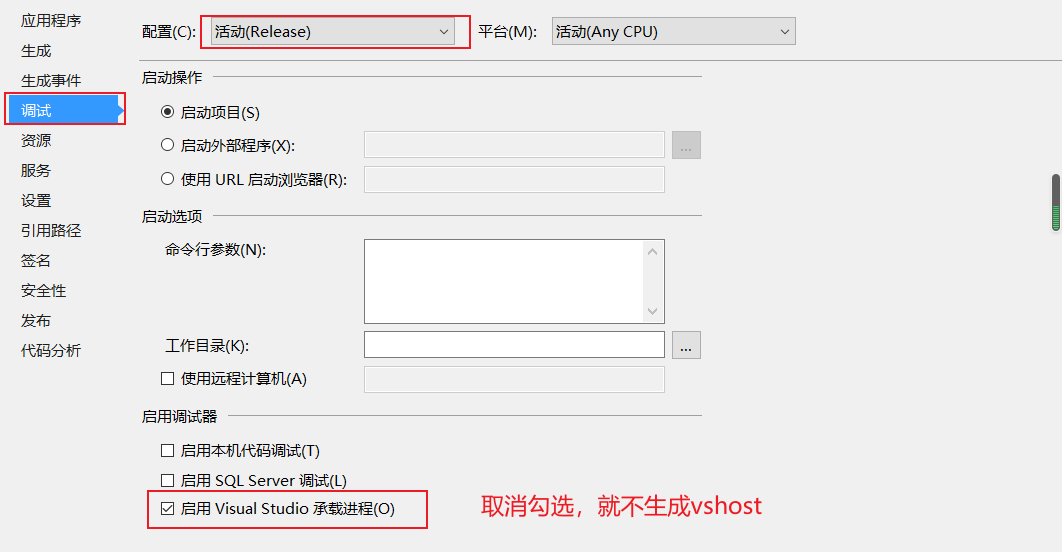
The output window has two modes
Debugging: debug
Build: build
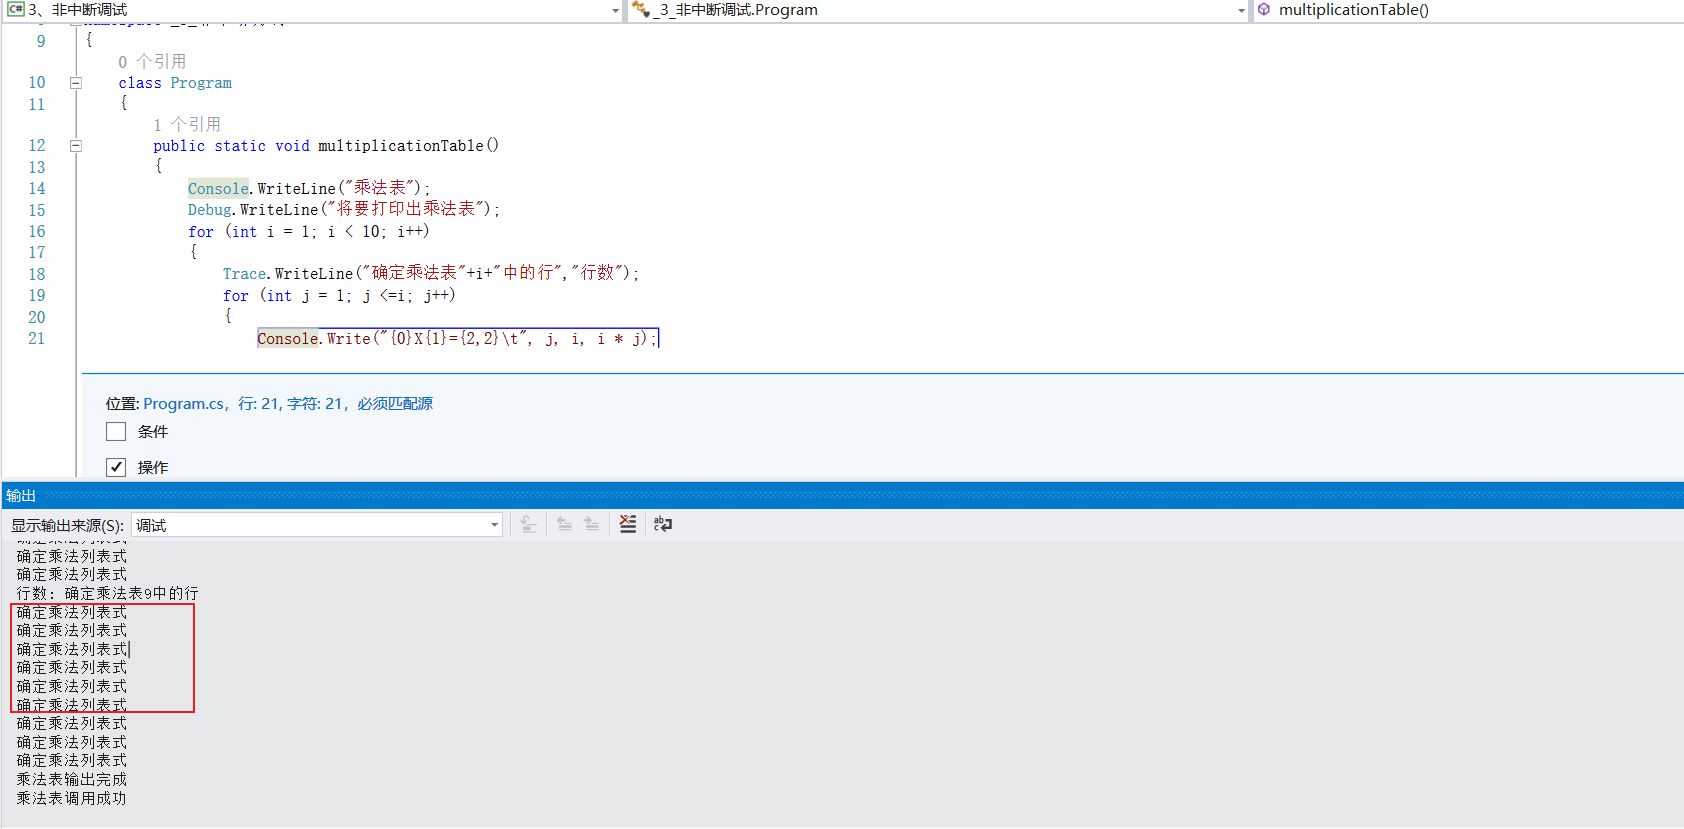
Debug.WriteLine(),Trace.WriteLine() needs to introduce namespace: using system Diagnostics;
Debug.WriteLine(),Trace.WriteLine() and console Writeline() difference
- Debug.WriteLine () runs in debug mode and cannot even be compiled into a releasable program. It will not be executed in the Release version
- Trance.WrtieLine() can also be used to Release programs. It can be executed in both Release and Debug modes
- Console.WriteLine(): output on the console, while the above two are output in the output window,
- Debug.WriteLine() and console Writeline () is used exactly the same, except for different output methods.
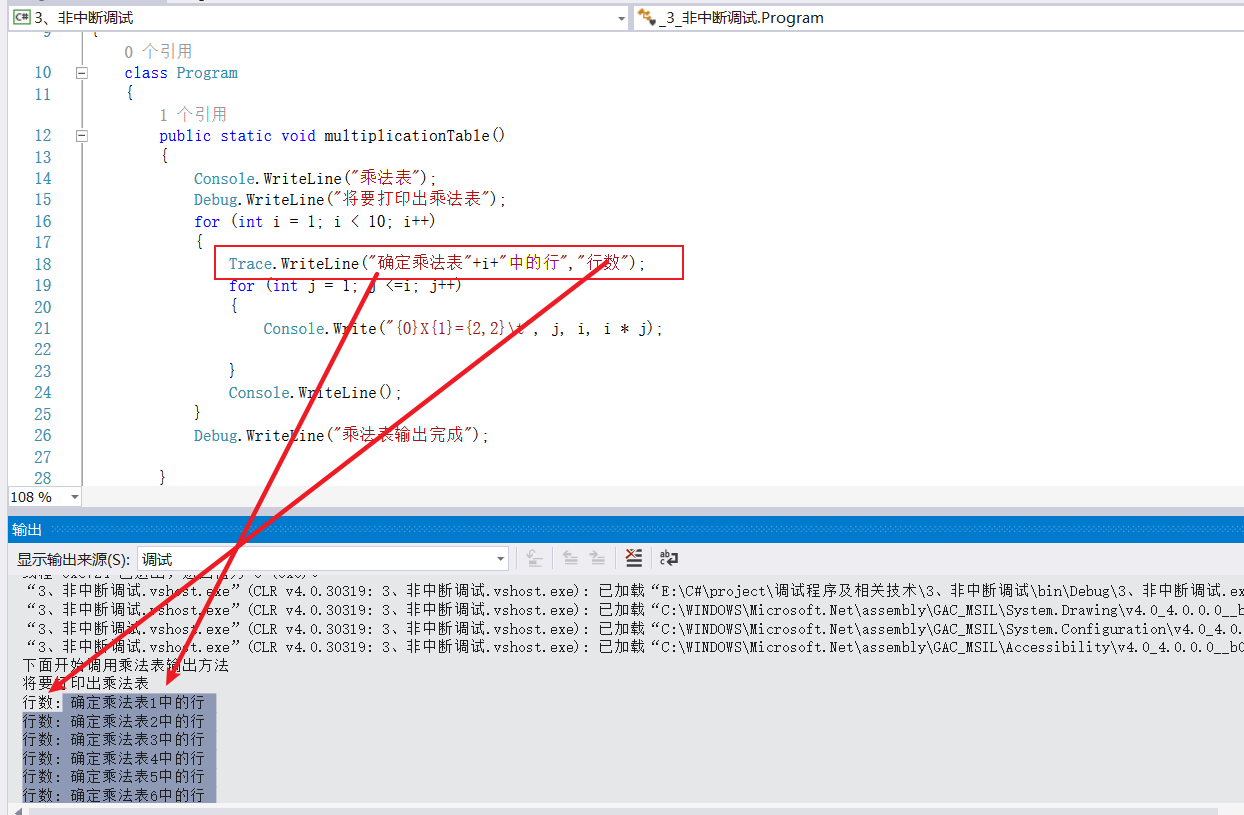
- Trance.WriteLine() can only use string splicing Writeline ("string 1" + i + "string 2"), you cannot use TranceWriteLine ("string 1 {0} string 2", i)
- Trance.WriteLine() can also use trance Writeline ("string 1" + i + "string 2", "number of lines")
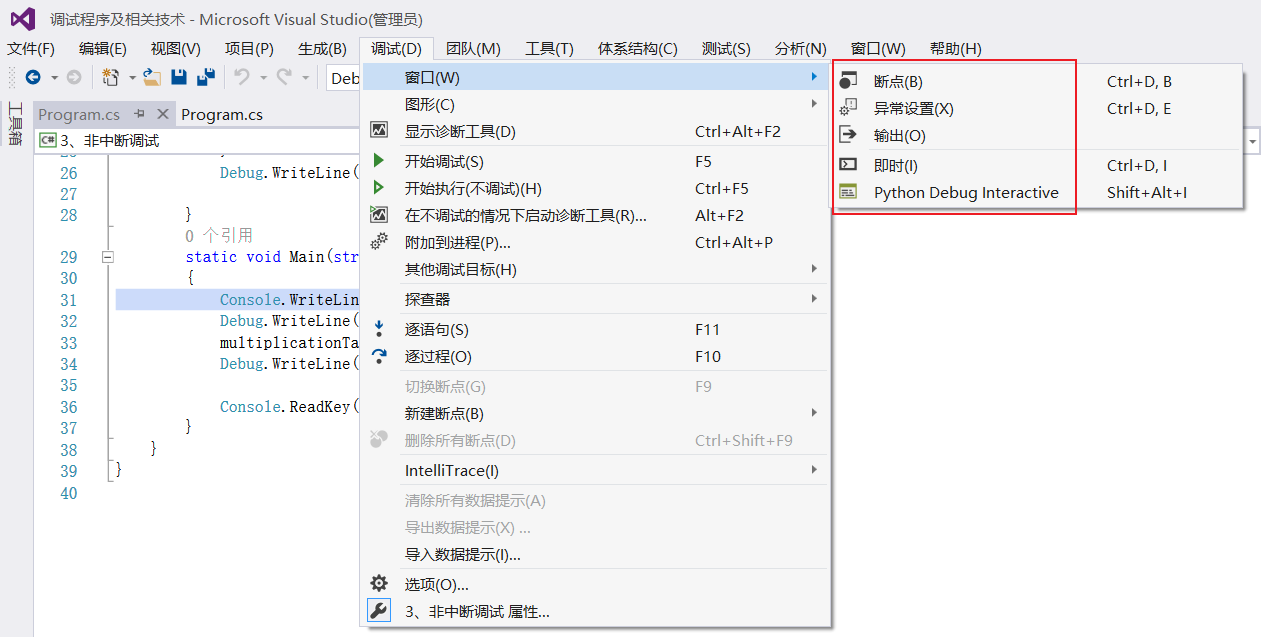

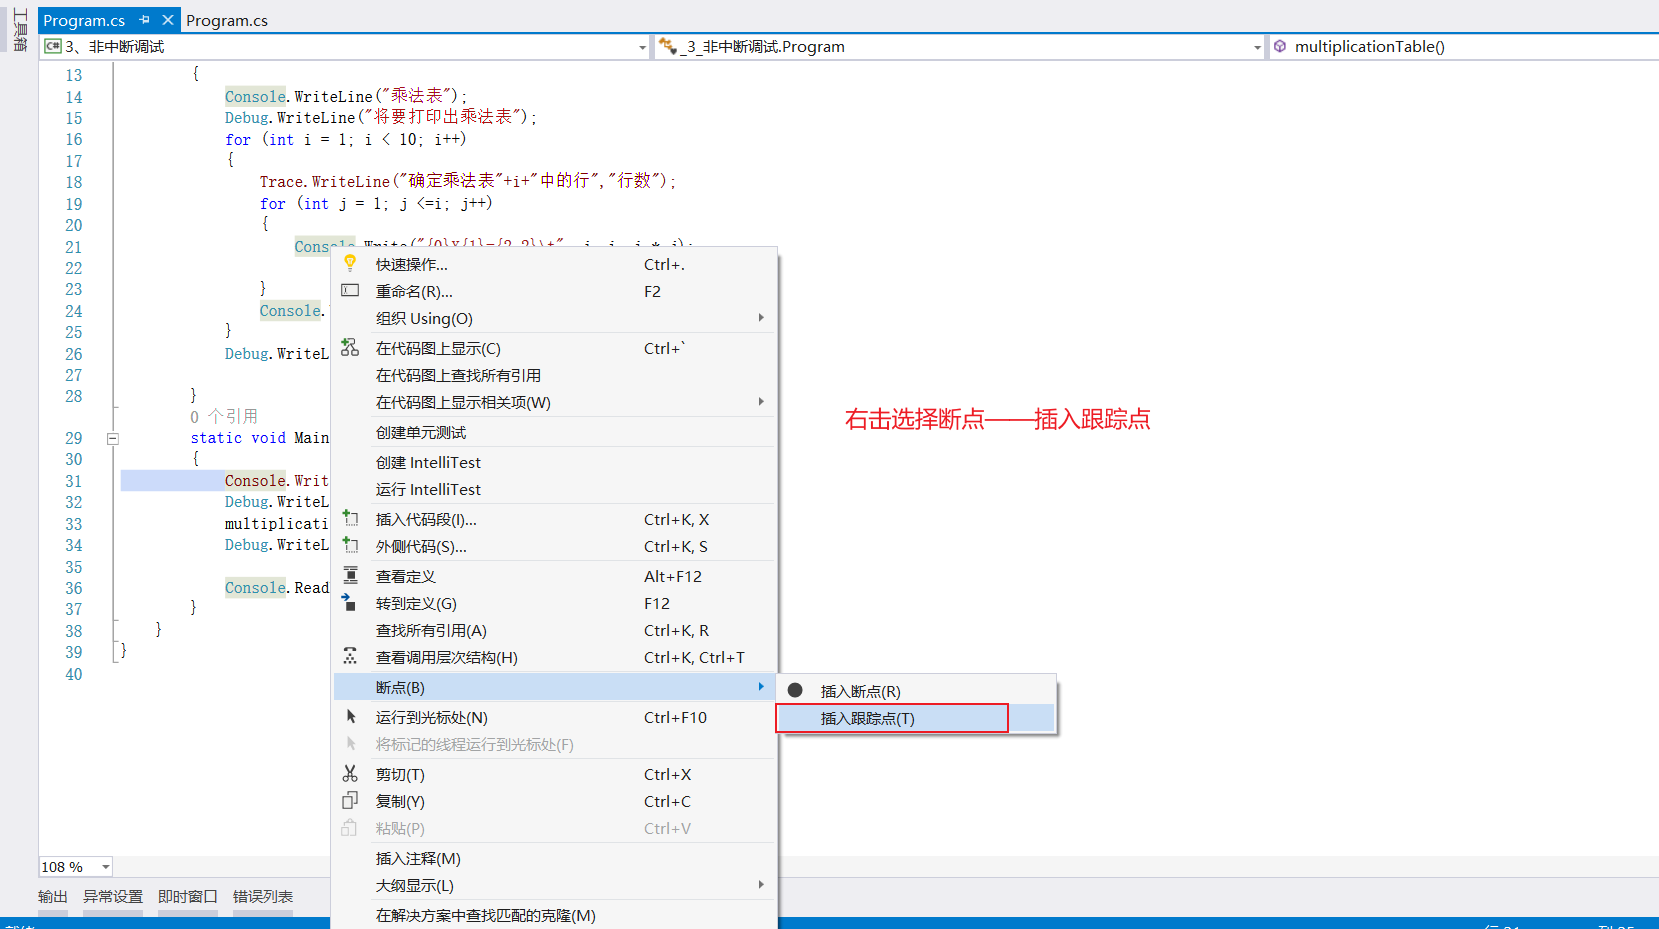
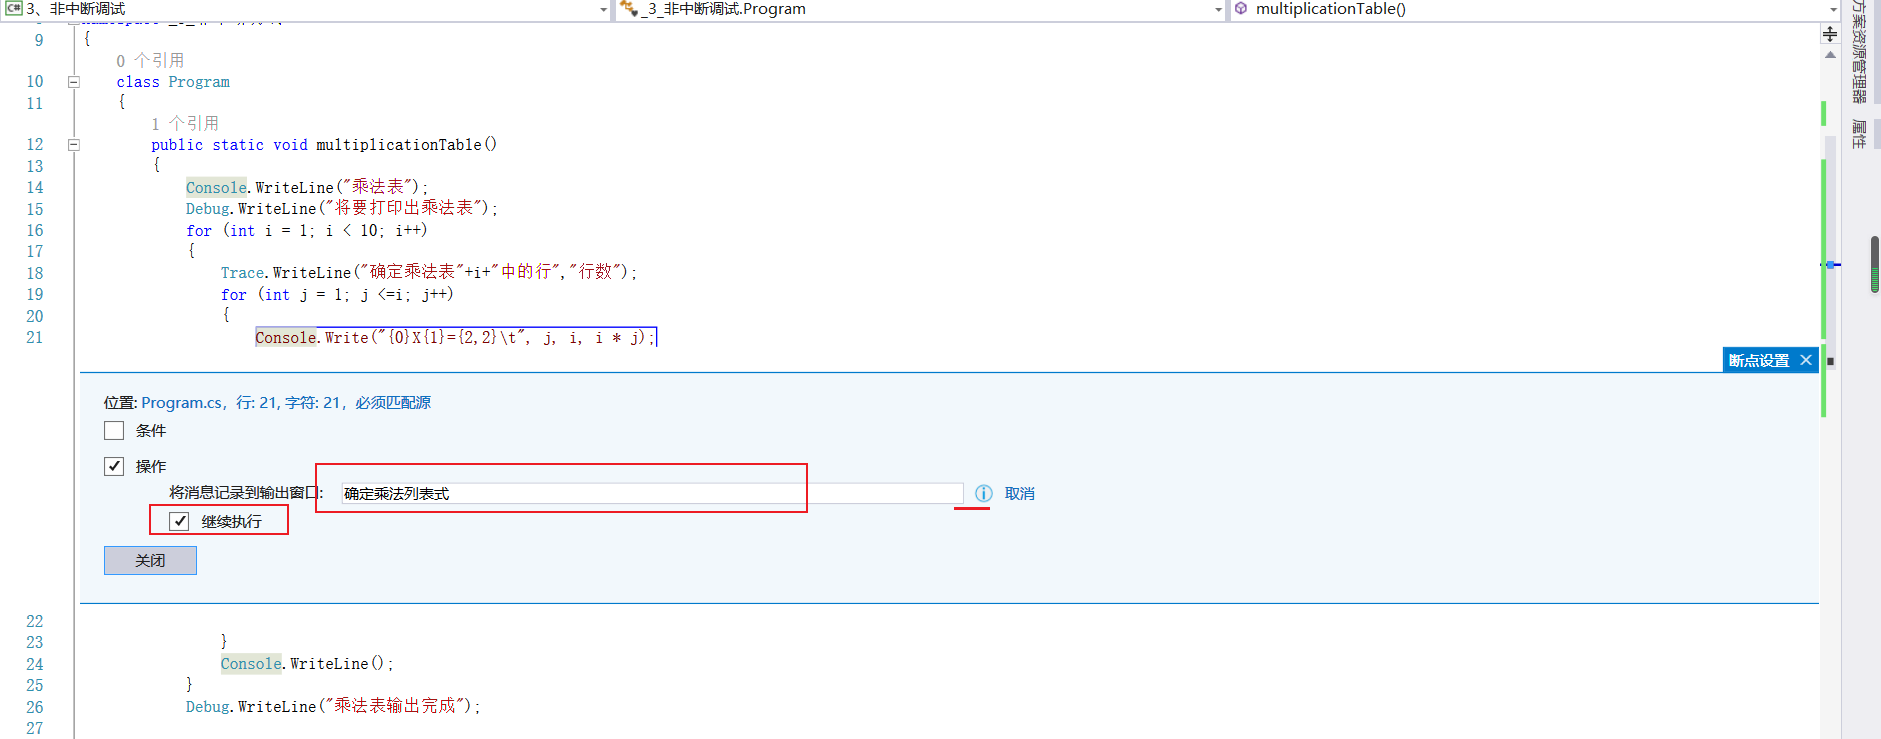
- Insert trace point
Visual Studio debugger Guide - breakpoints and trace points
breakpoint debugging
After the application is written, it can be executed in two ways: debugging mode and non debugging mode
The difference between debug mode (stop at breakpoint) and non debug mode (ignore breakpoint and continue execution)
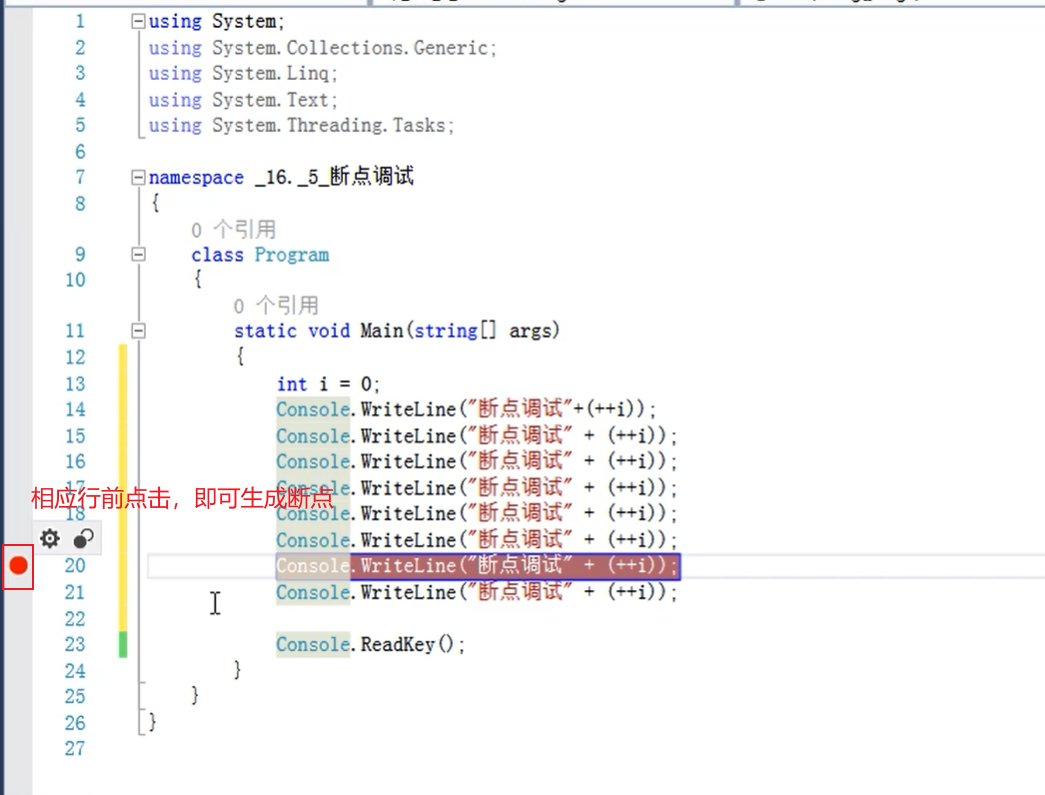
A breakpoint is a code location set by the debugger. When the program runs to the breakpoint, the program interrupts execution and returns to the debugger. Breakpoints are the most commonly used technique. When debugging, only the breakpoints are set and the program is returned to the debugger, then the program can be debugged online.
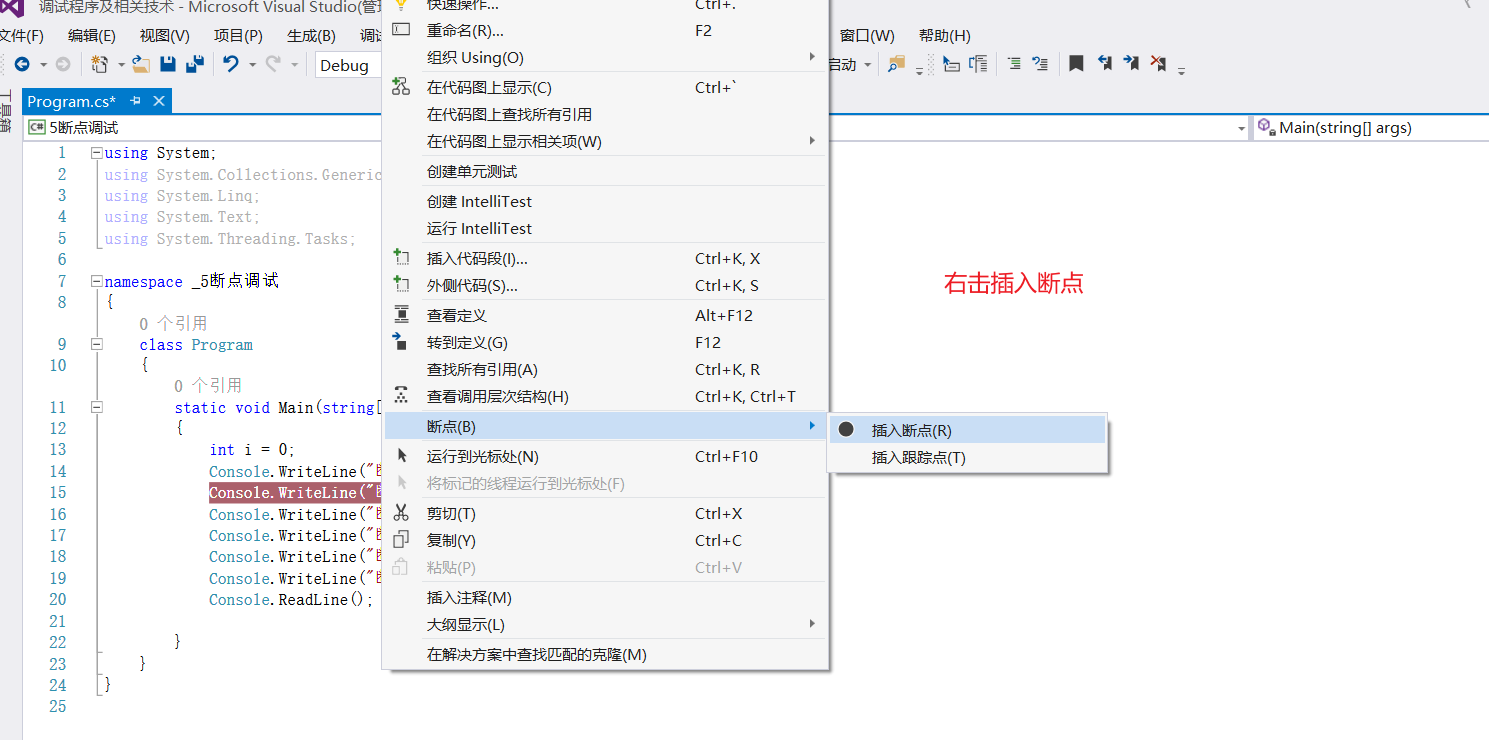
Set breakpoint: mouse, shortcut menu, shortcut (F9), conditional breakpoint
Start debugging:
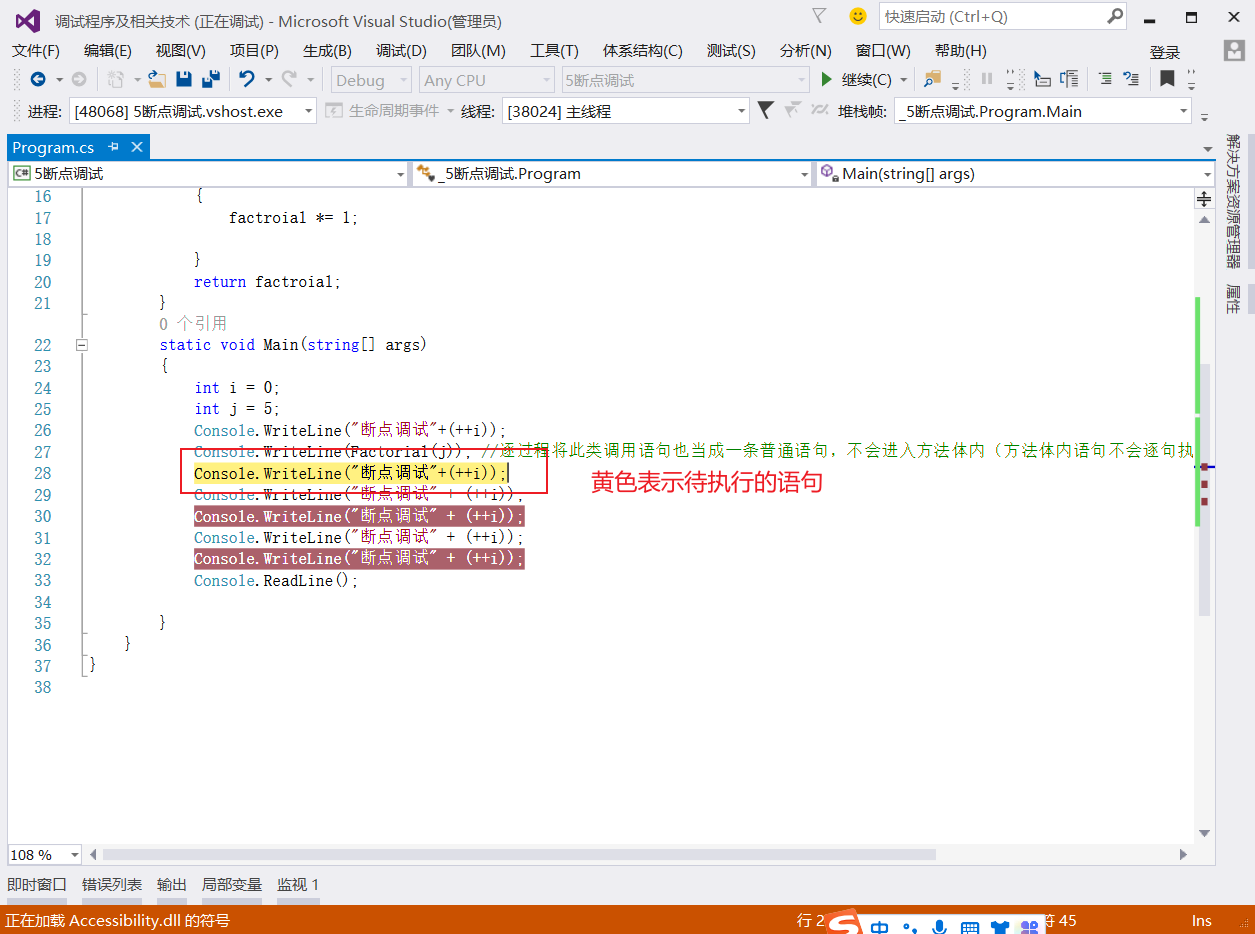
Commissioning mode:
- Procedure by procedure (F10): procedure by procedure statement treats the procedure call statement as an ordinary statement and will not enter the method body (the statements in the method body will not be executed sentence by sentence)
- Sentence by sentence (F11): if you press F11 directly, it will execute sentence by sentence from the Main method (program entry point), and one sentence will be executed every time you press F11. If you press the start button, the program will stop after running to the breakpoint, and then press F11, without pressing once to execute a statement
- Jump out (Shift+F11)
- Continue (F5): jump to the next breakpoint
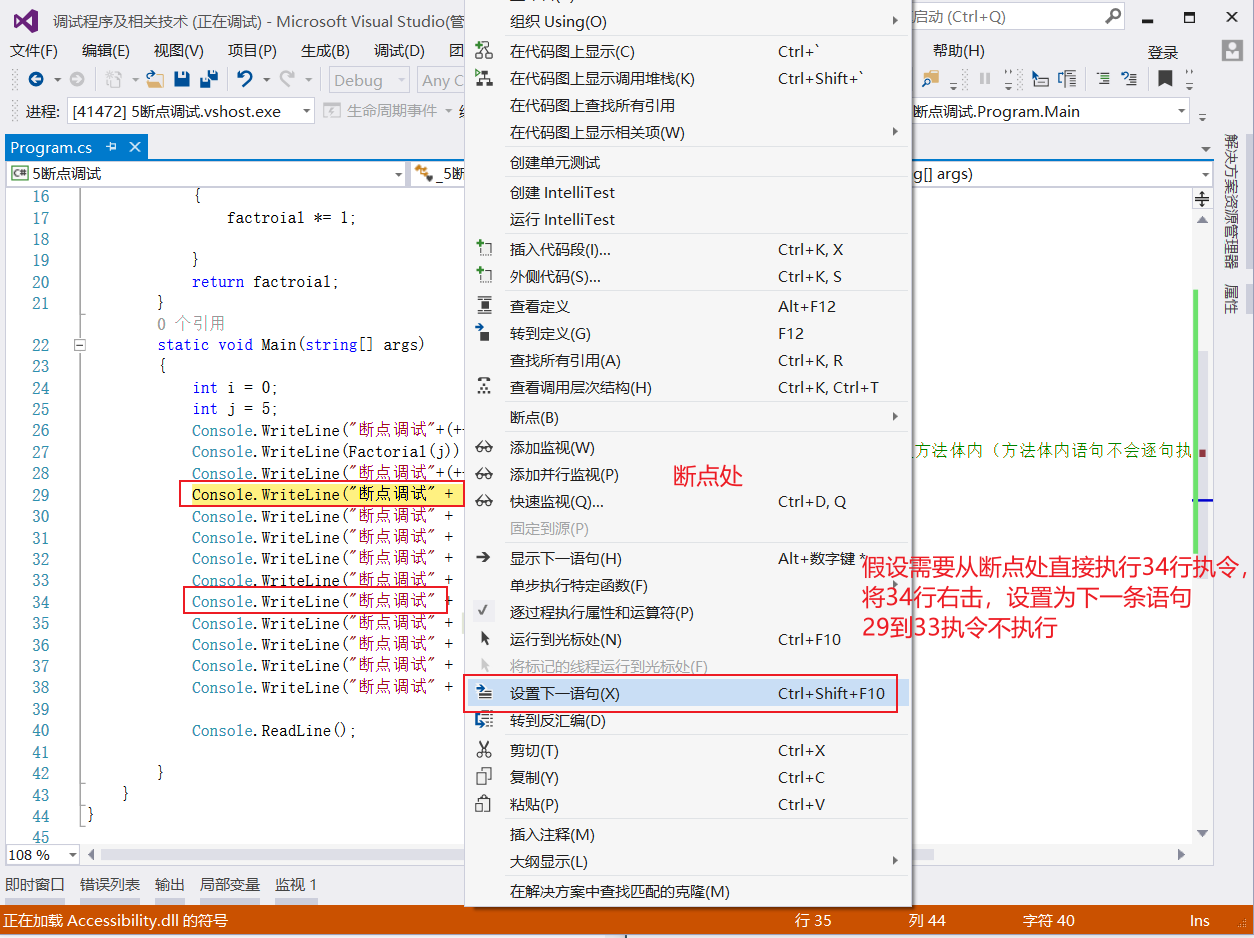
- Set next statement (Ctrl+Shift+F10): the program stops after running to the breakpoint. If you need to skip some statements and execute directly to the specified statement, you need to set the next statement.
- Show next sentence (Alt + *)
Stop of breakpoint debugging
stop it:
- Interrupt all (Ctrl+Alt+Break): you can stop the loop, jump out of the loop, and execute the next statement of the loop
- Stop program execution (Shift+F5): stop program execution and completely interrupt the program
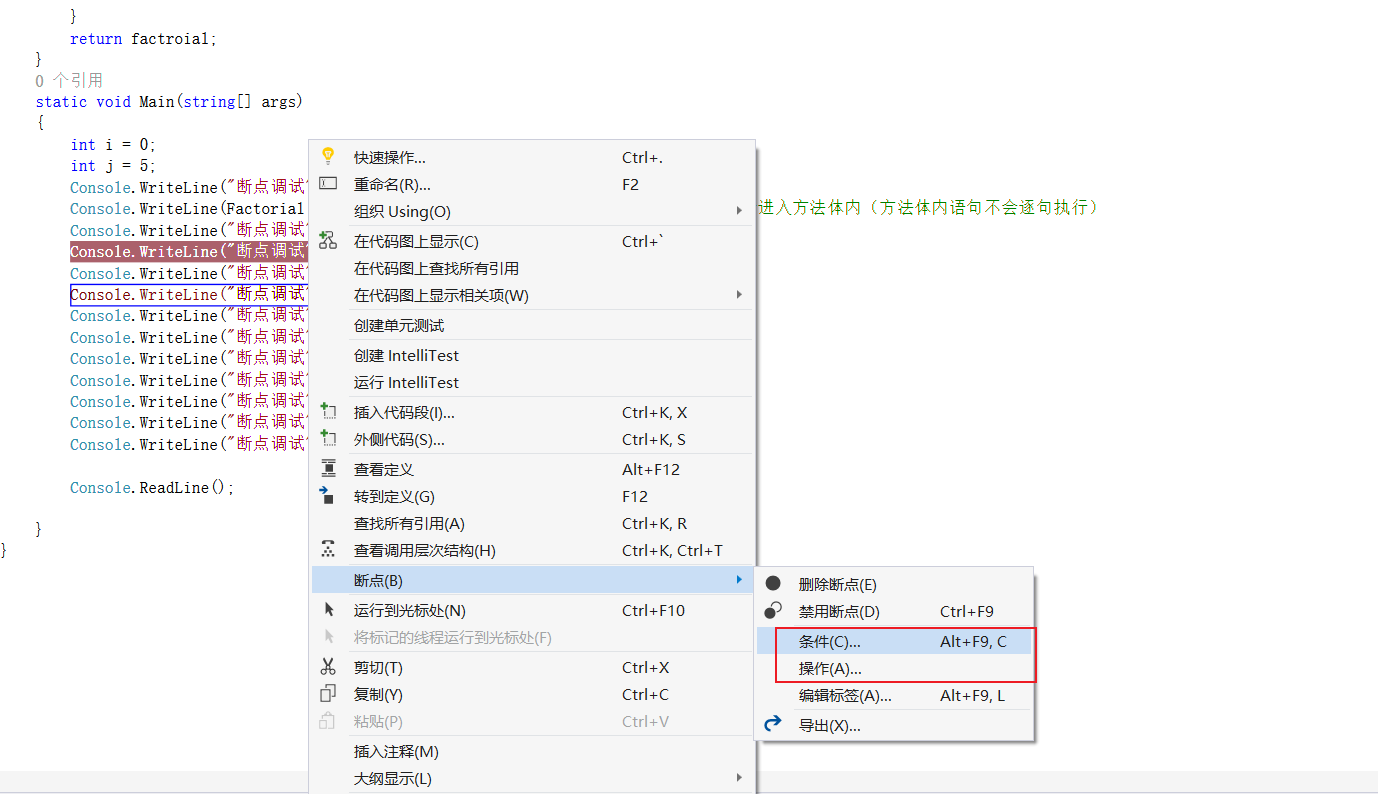
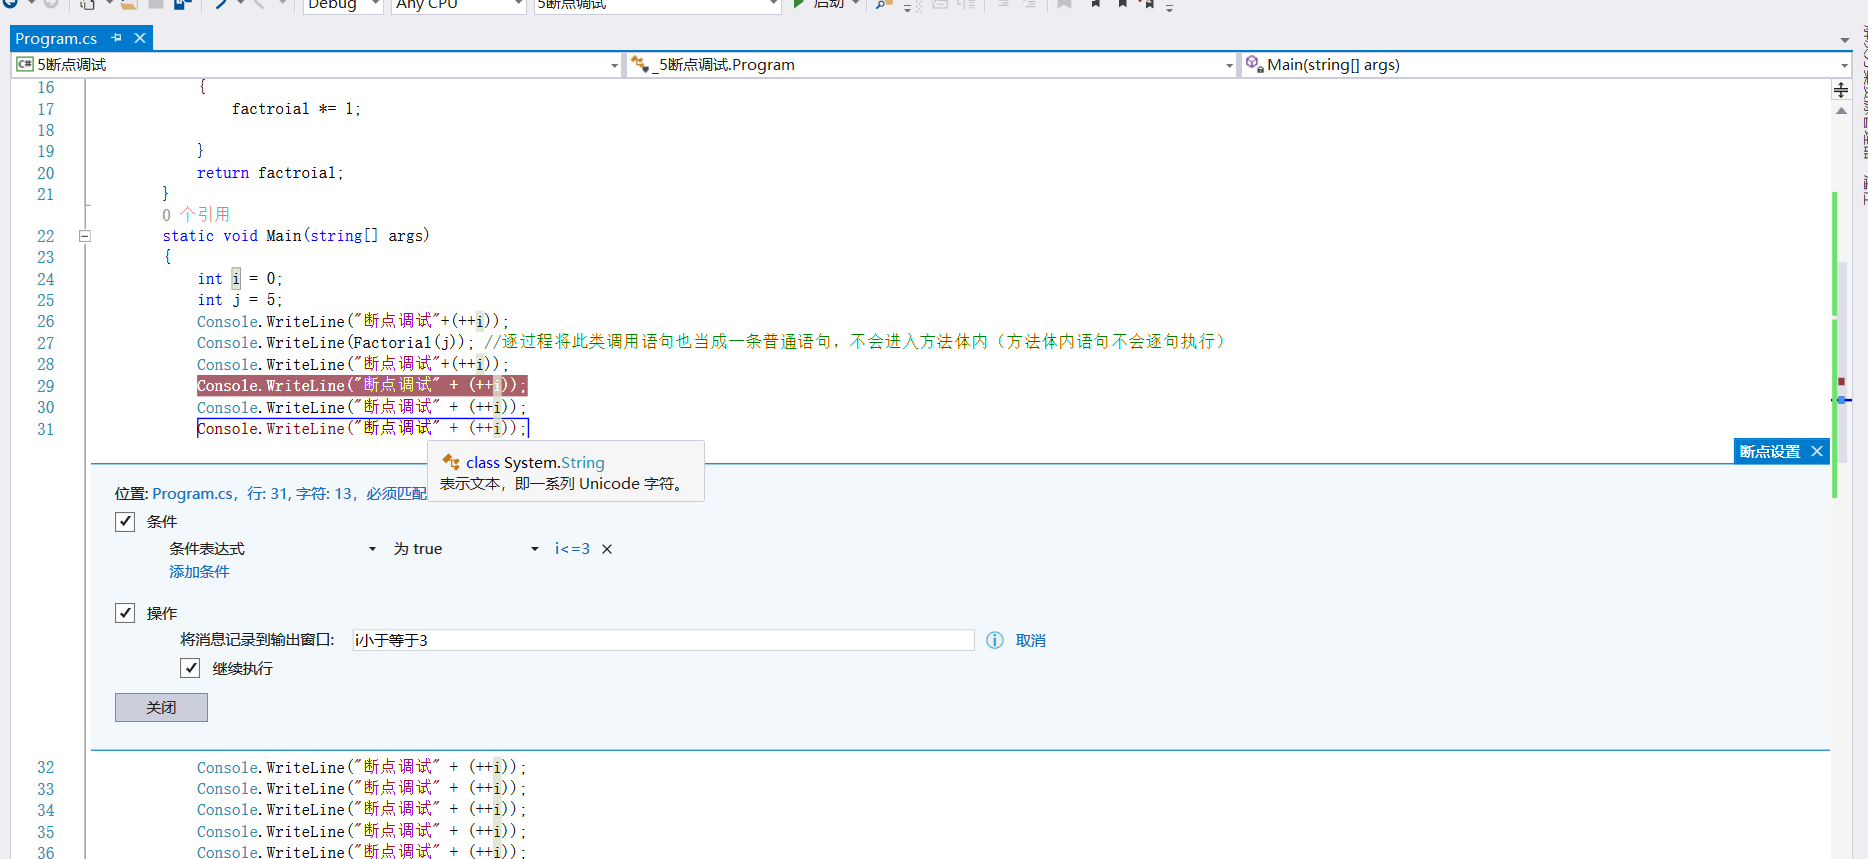
Conditional breakpoint:
- condition
- operation
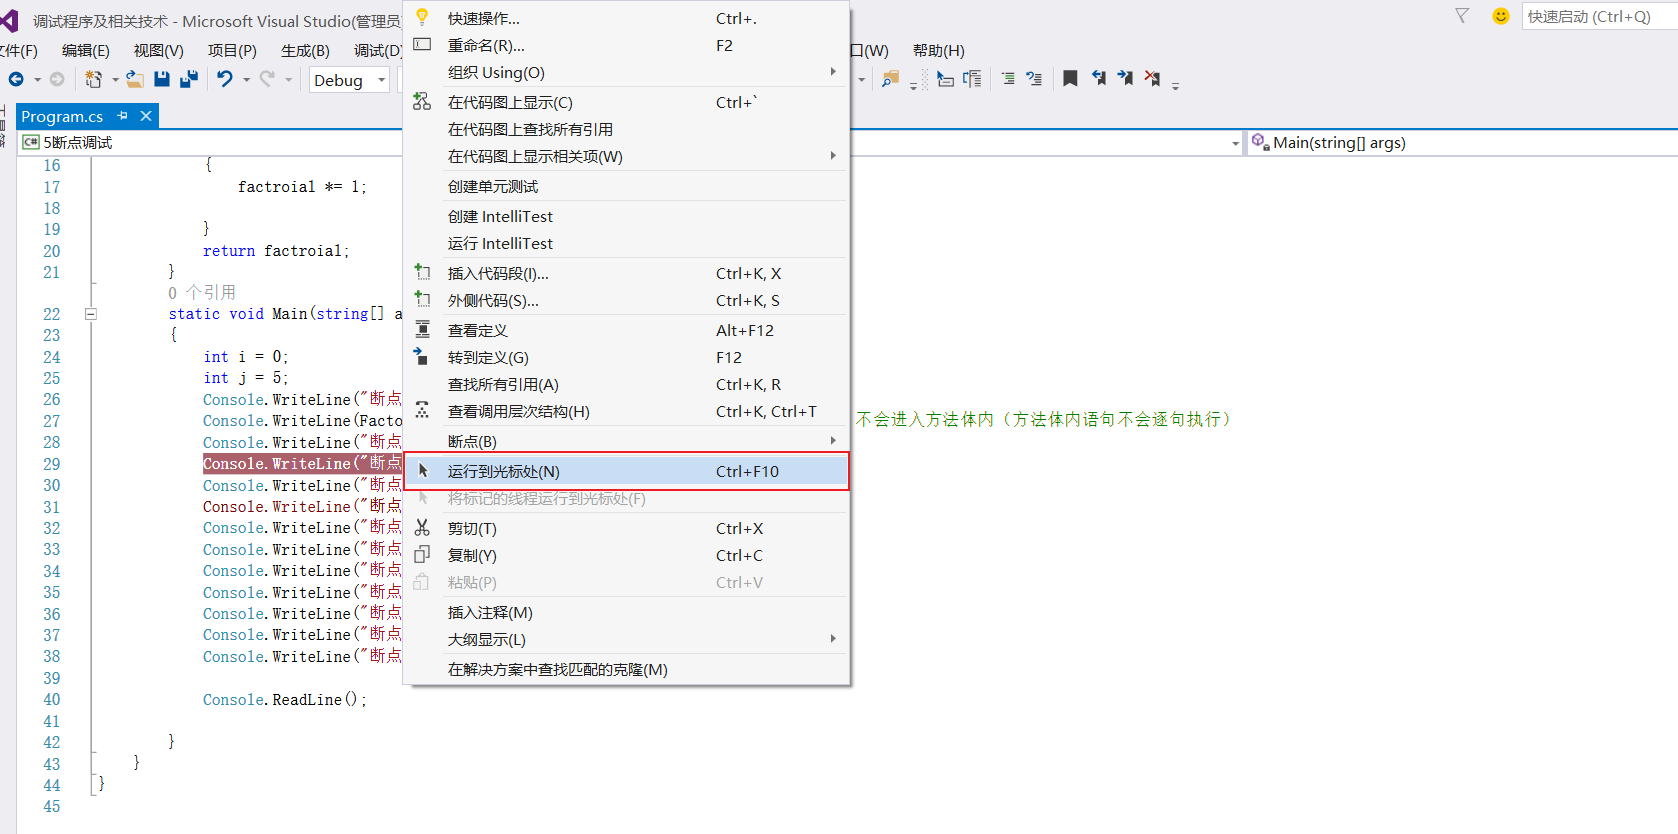
Run to the specified location
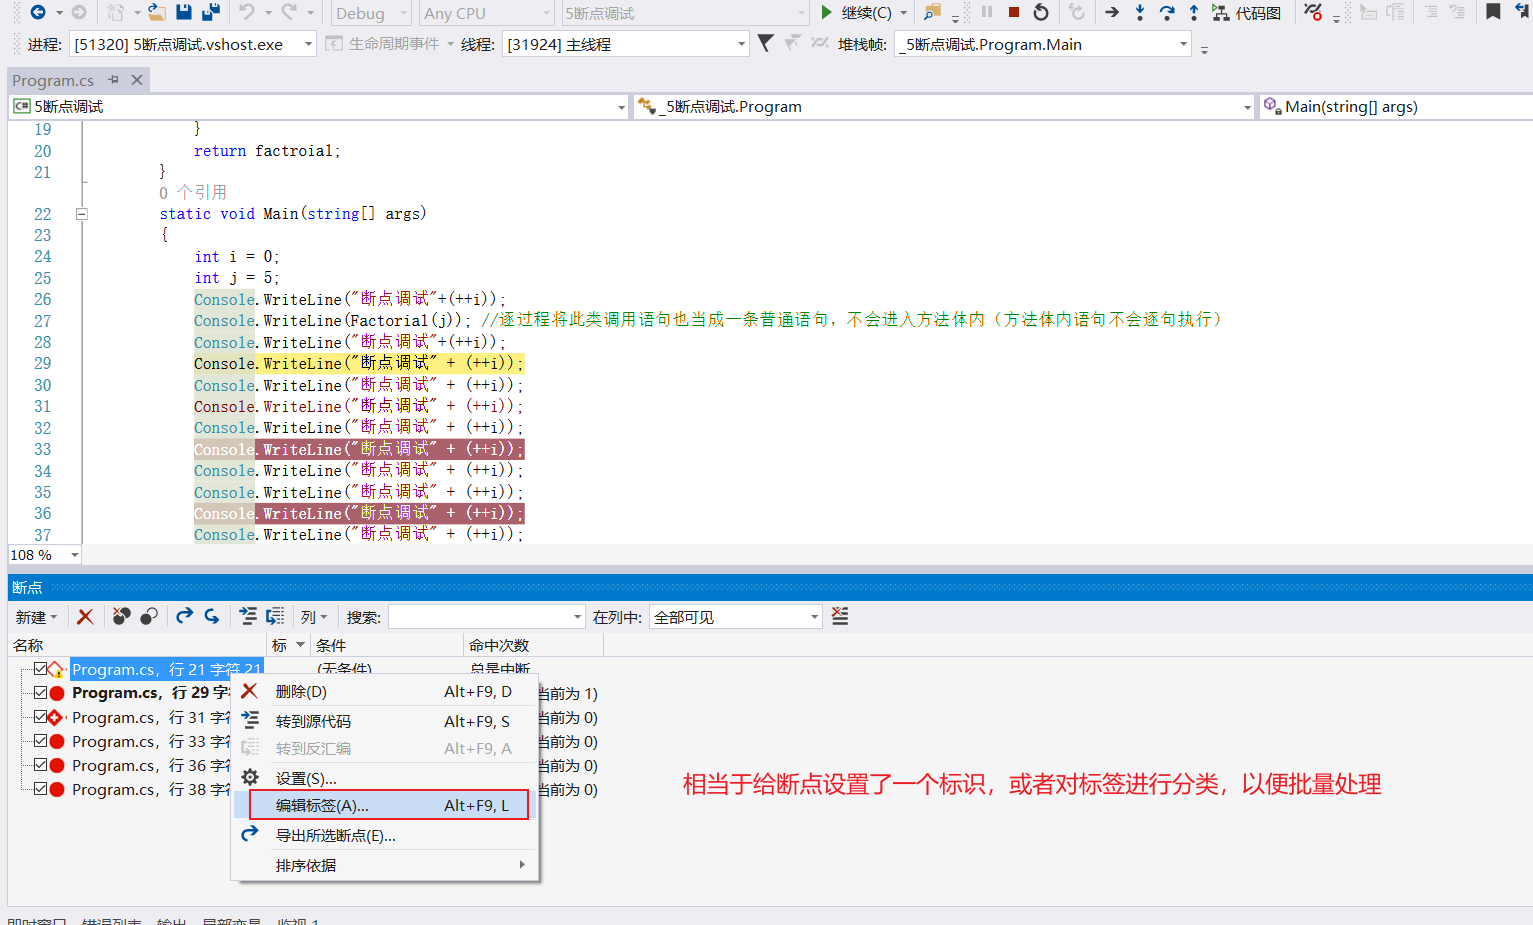
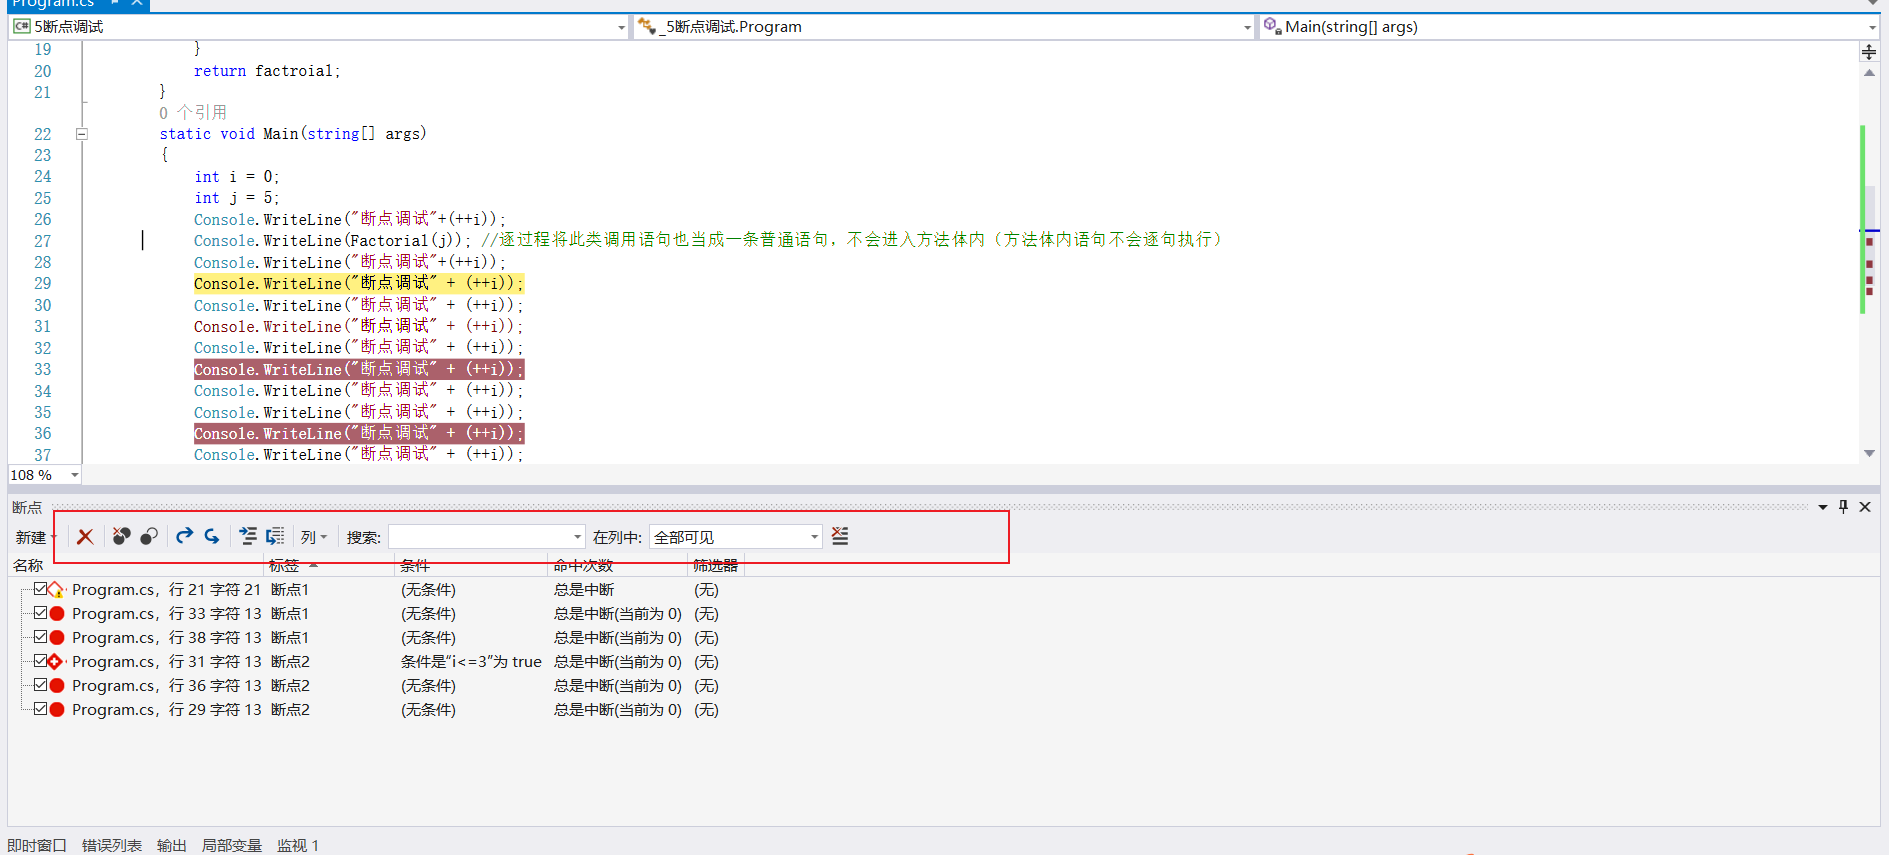
Breakpoint Labels
Breakpoint
Breakpoint window
Function: set breakpoints in batch and set in search
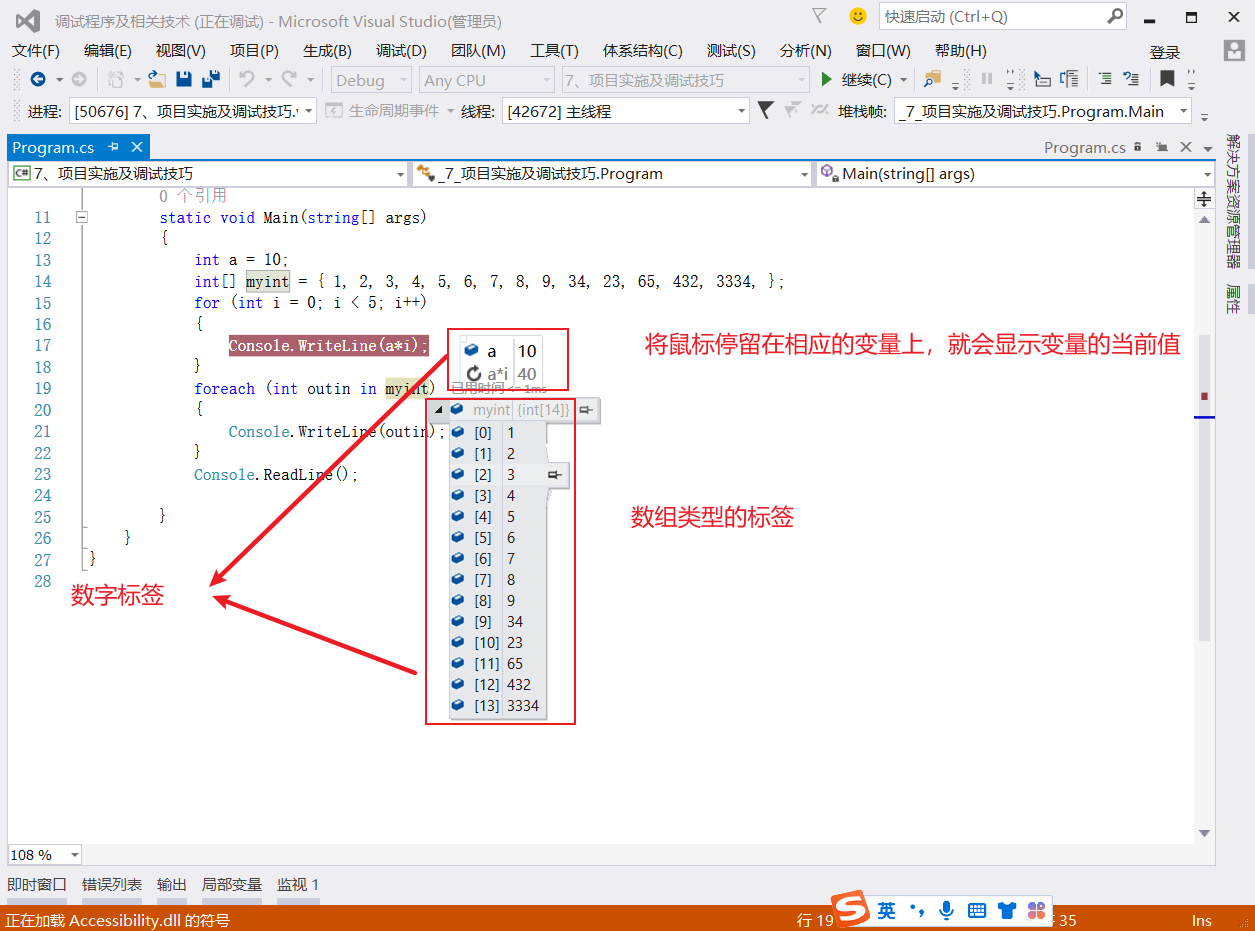
Data note
Data note is an advanced note message used to view objects and variables during application debugging. When the debugger runs to a breakpoint, move the mouse over an object or variable and you will see their current value.
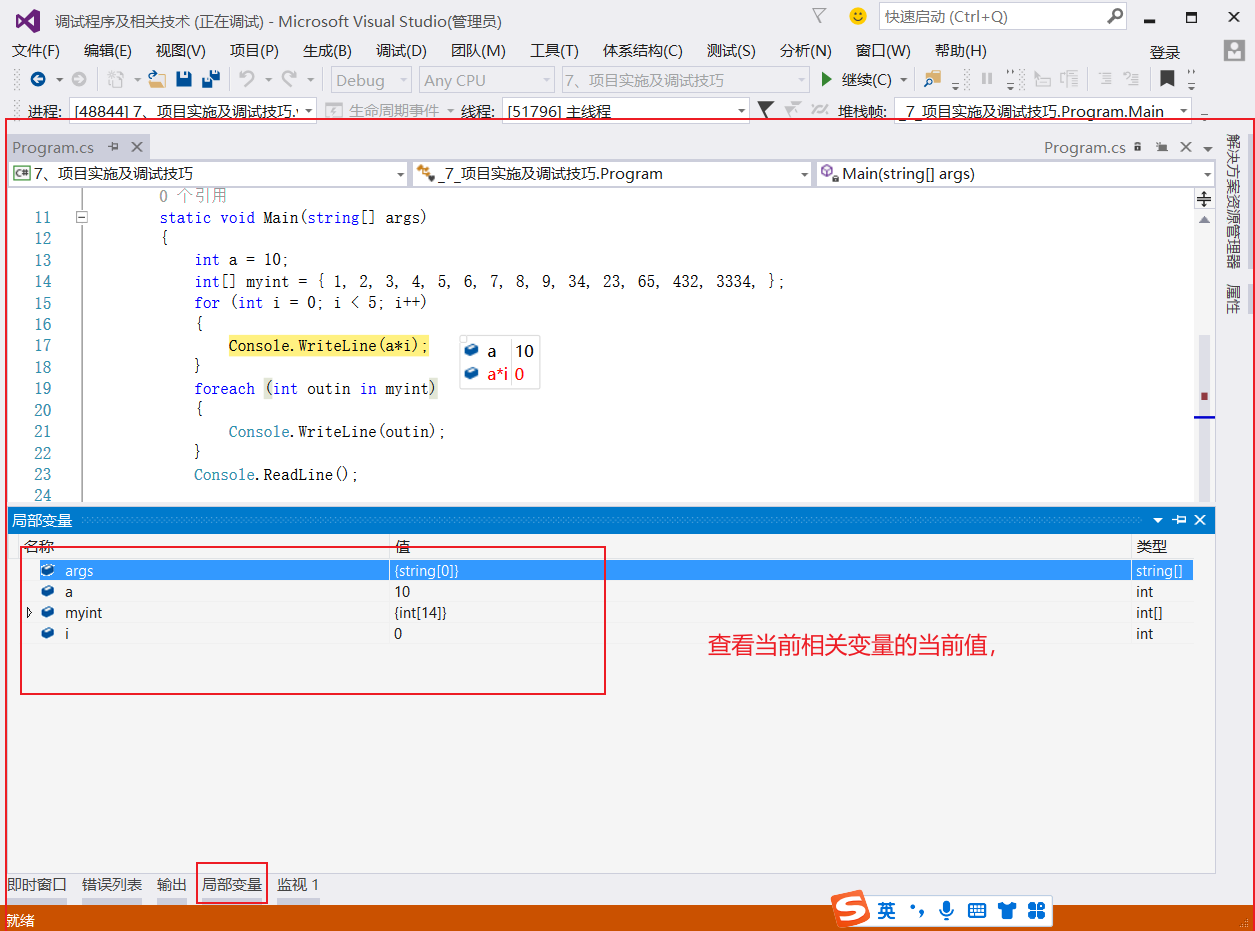
Local variable window
Invalid local variables are not displayed
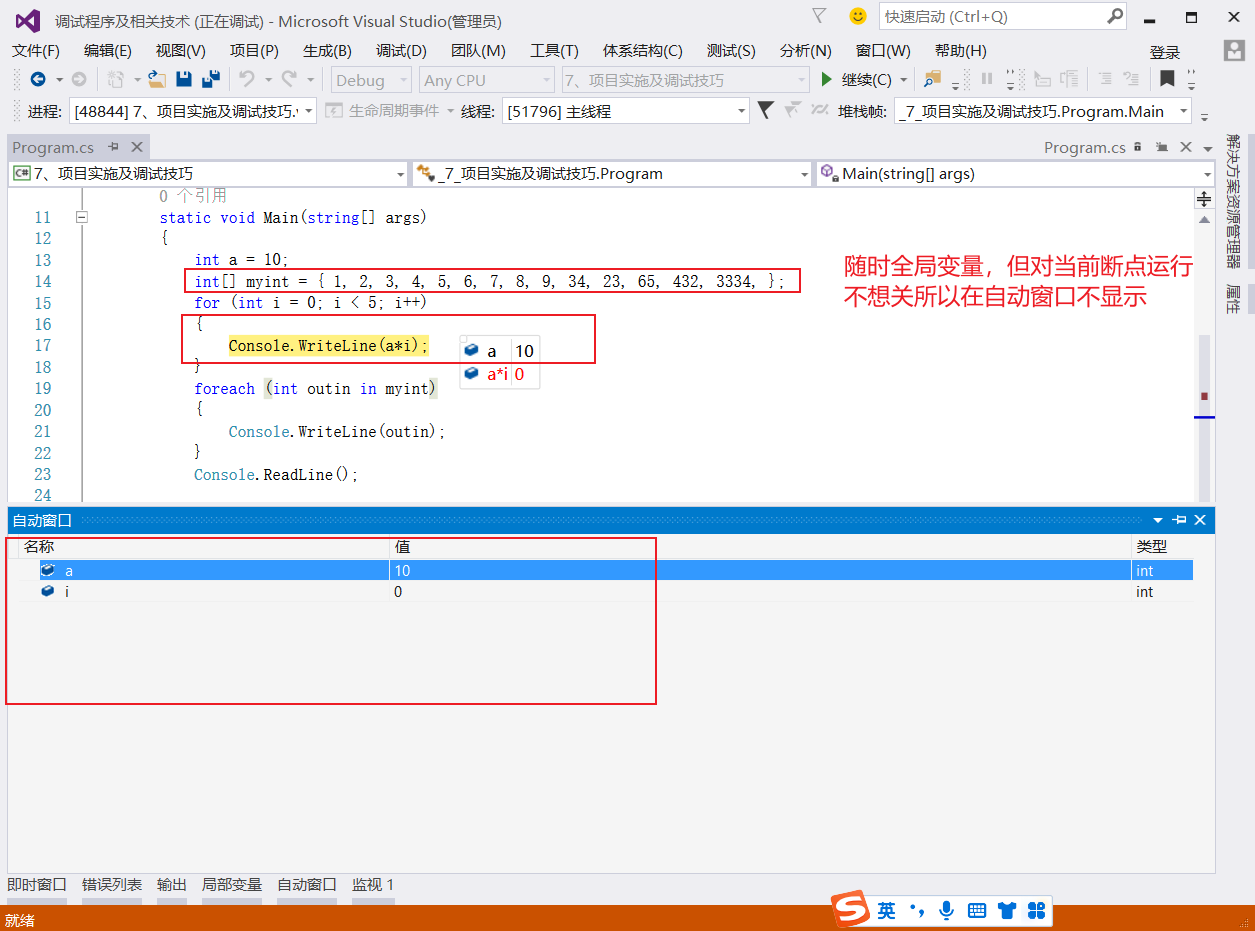
Automatic window
Only the variables related to the running place of the current breakpoint program are displayed. Even if the global variable is given to the current breakpoint, it will not be displayed if you don't want to close it.
Local variables window: displays all valid variables of the currently running program. Because global variables are always valid, global variables will always be displayed. After local variable operation fails, it will not be displayed in the local variable window.
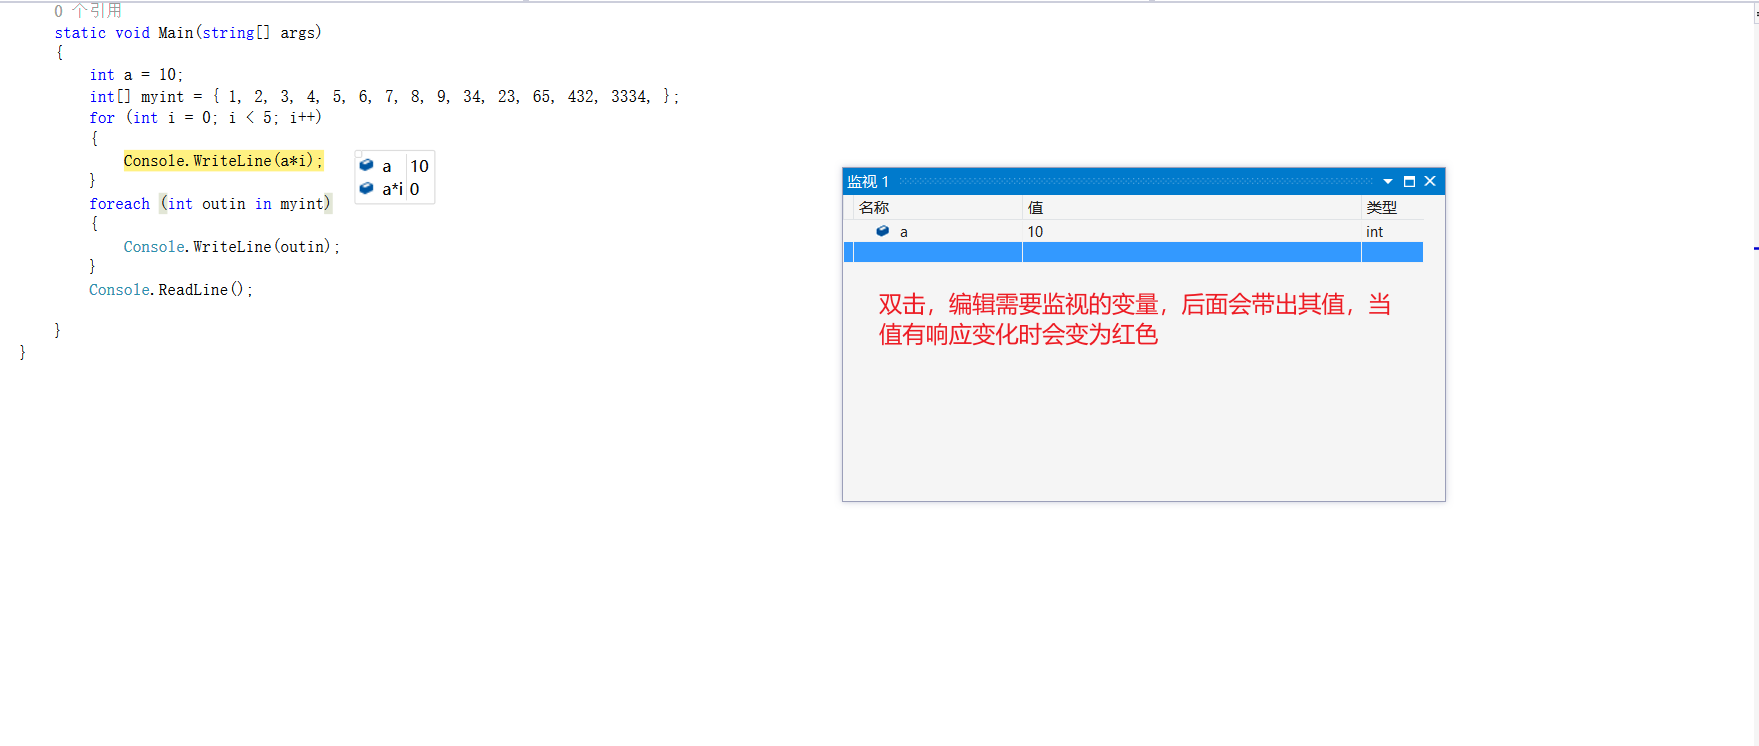
Monitor window
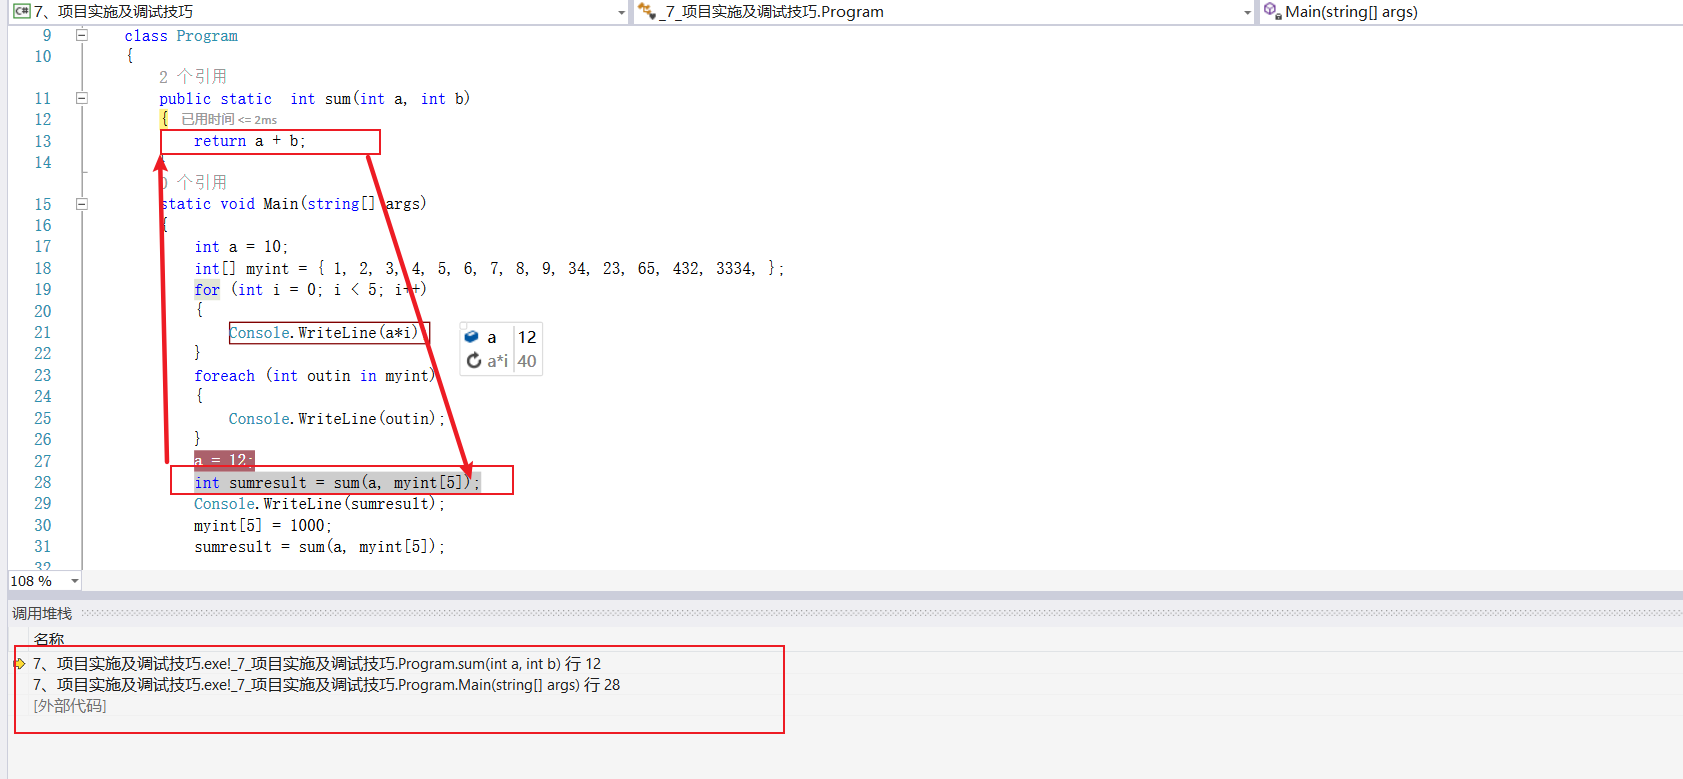
call Stack
Monitor methods invoked
View definition (F12)
Position the mouse over the related function method and press F12
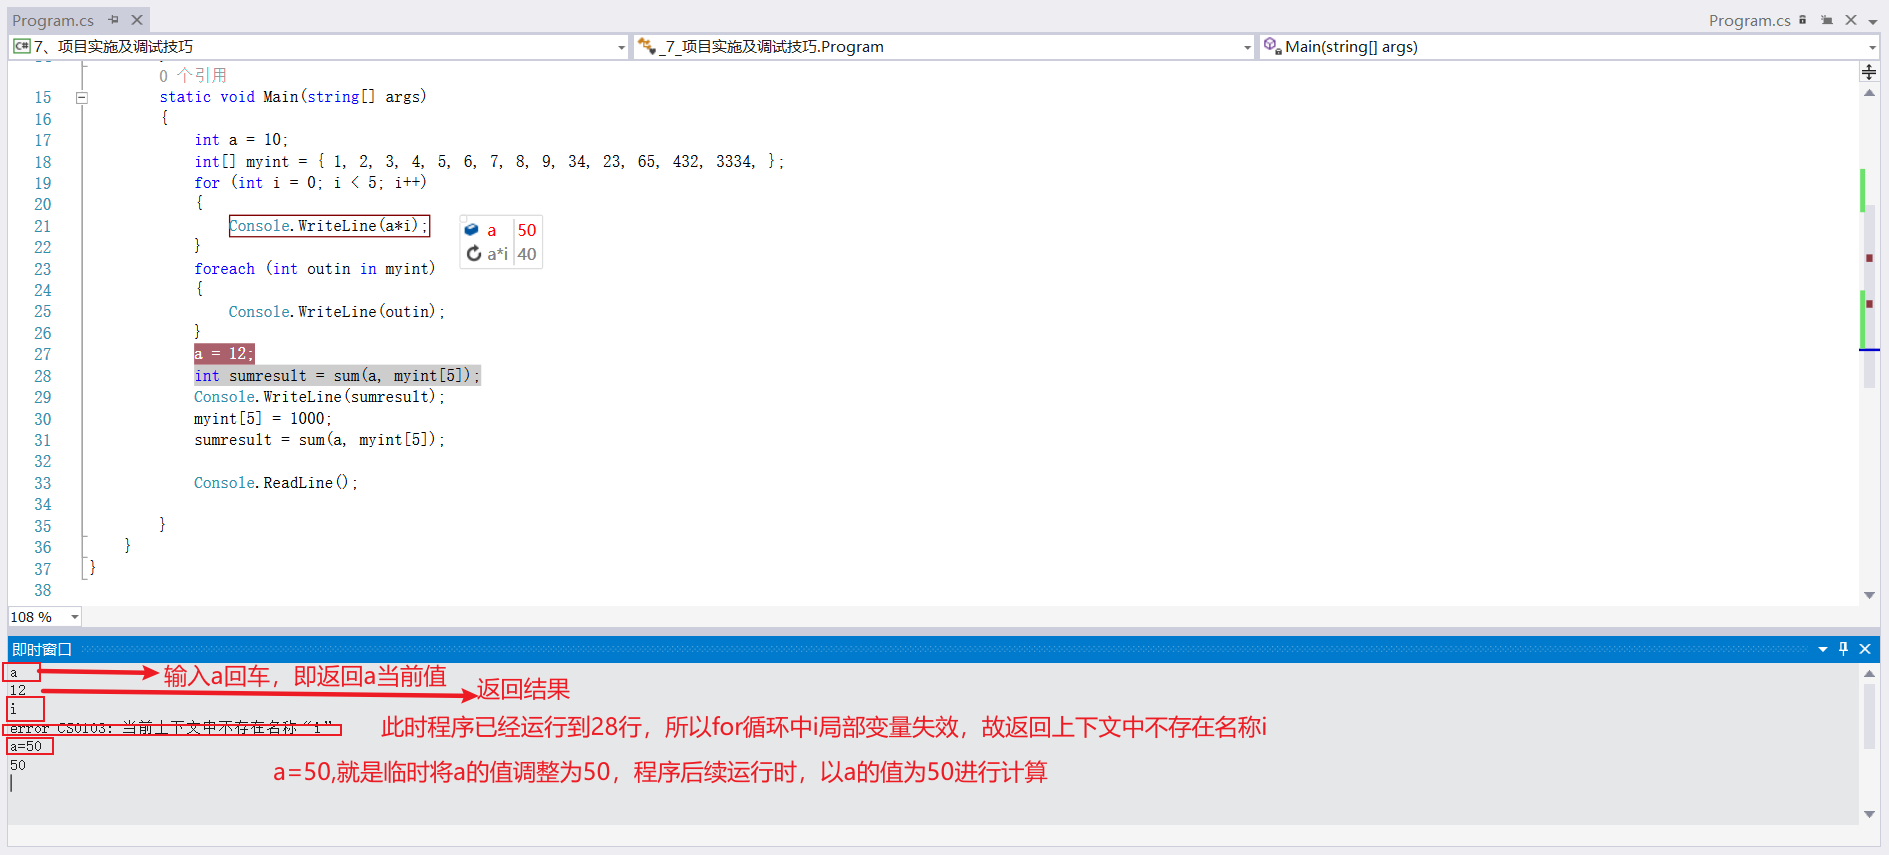
Instant window
It can be used to view the current value of the corresponding variable or temporarily adjust the value of the variable response