Mail alarm configuration
If there is no error page, what do you think
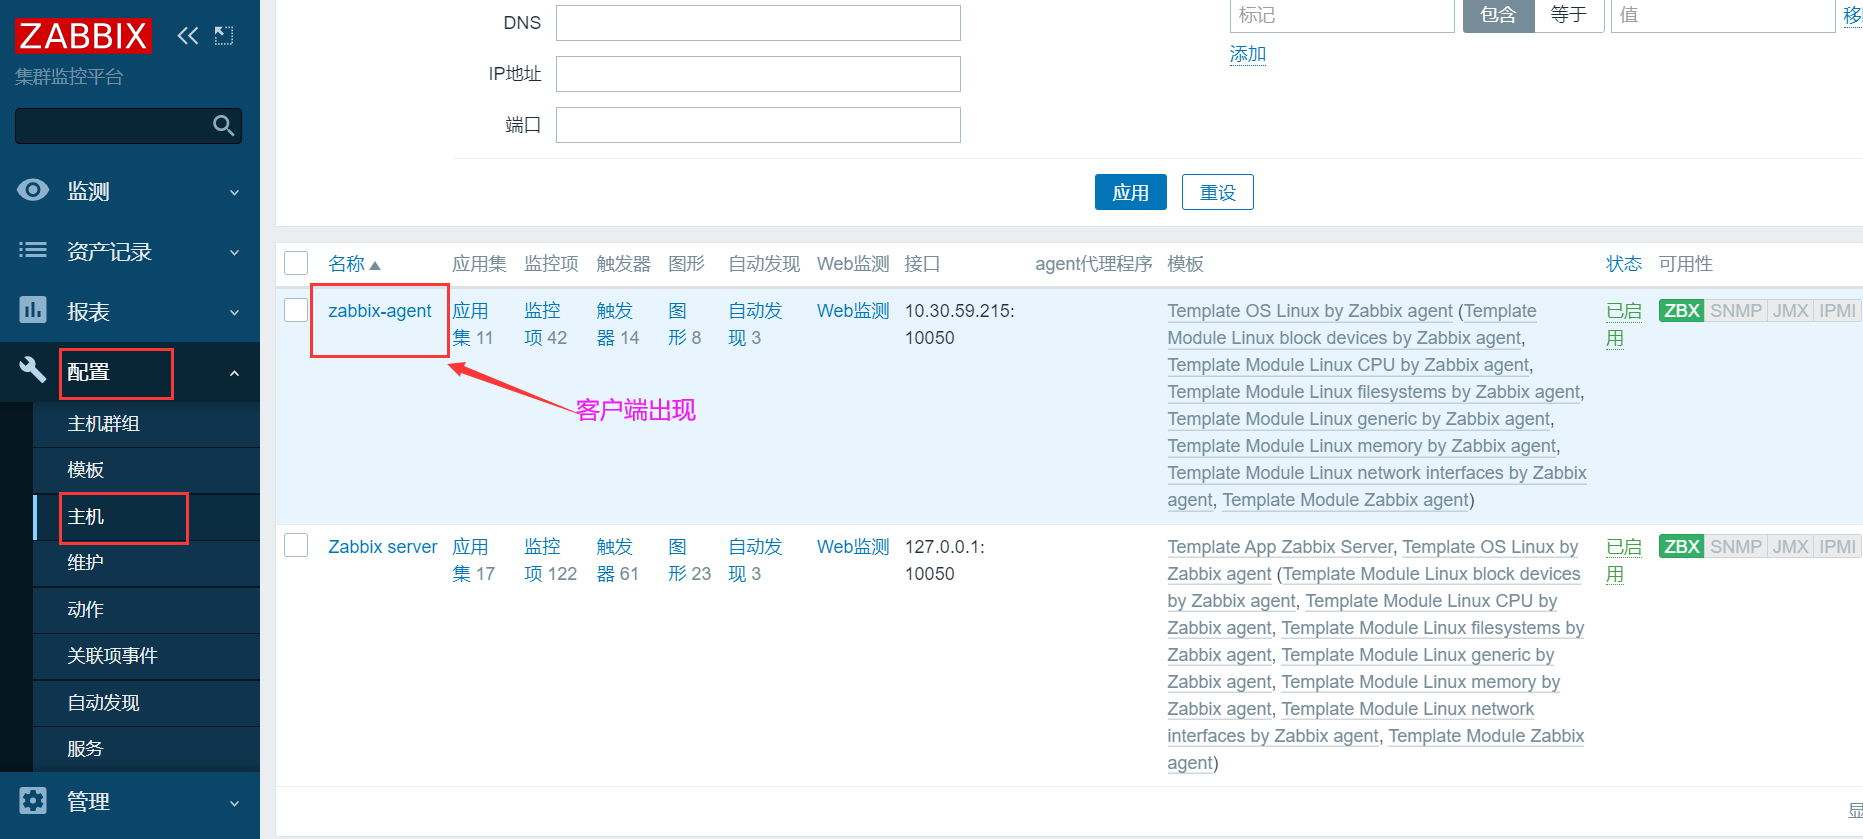
Configuration - host

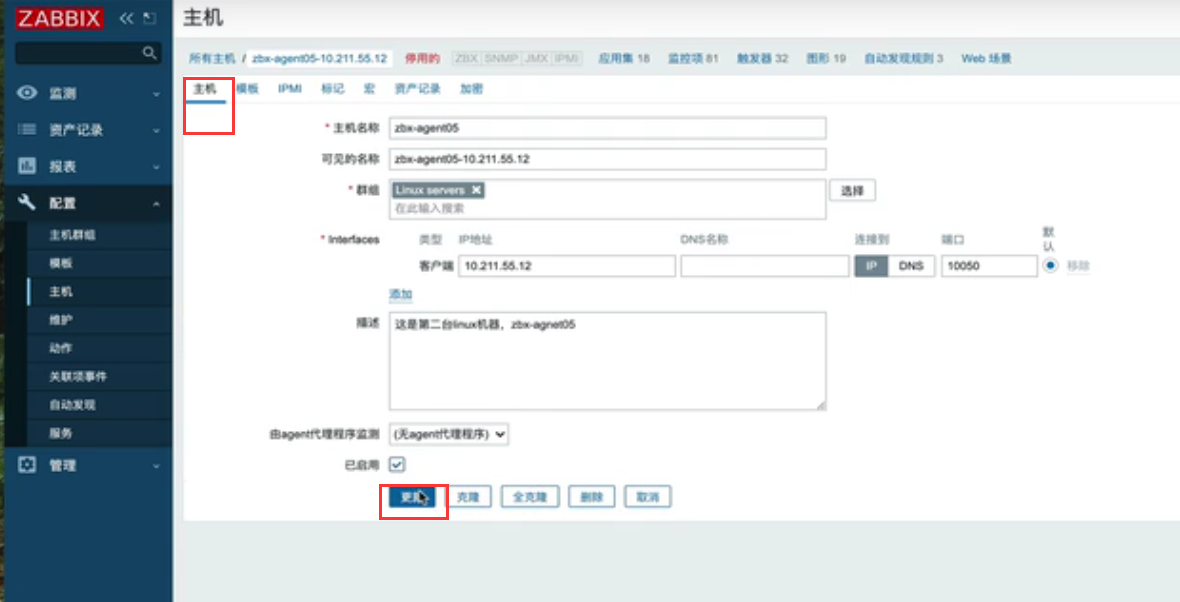
Click zabbix-agent-10.0.59.215 - Host - Update
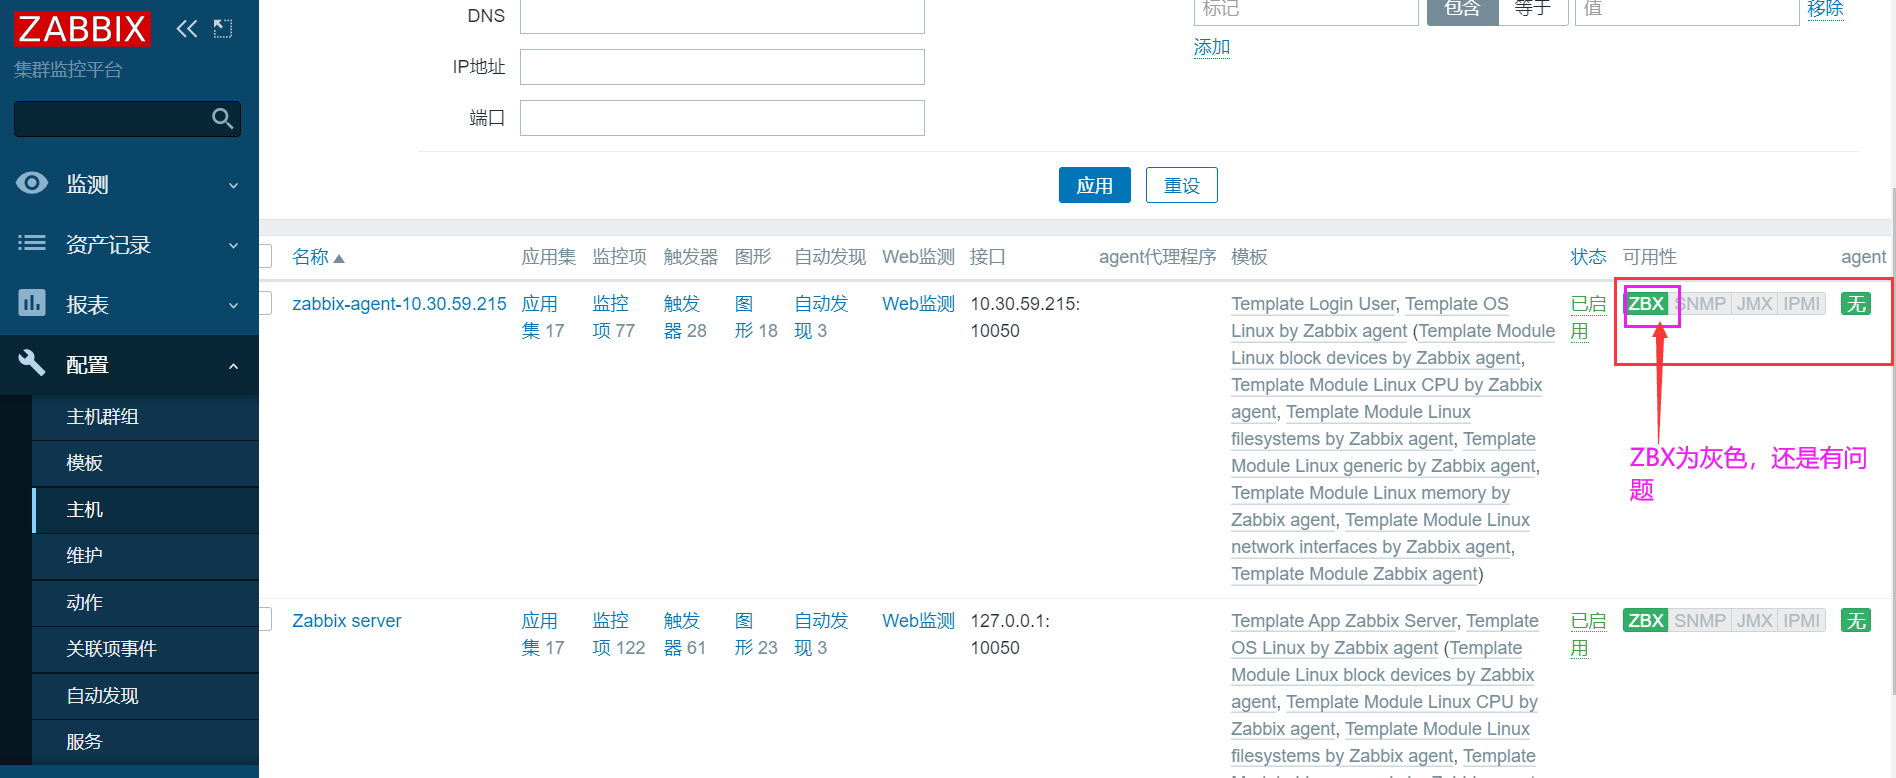
ZABBIX agent-10.0.59.215 --- started --- ZBX is gray
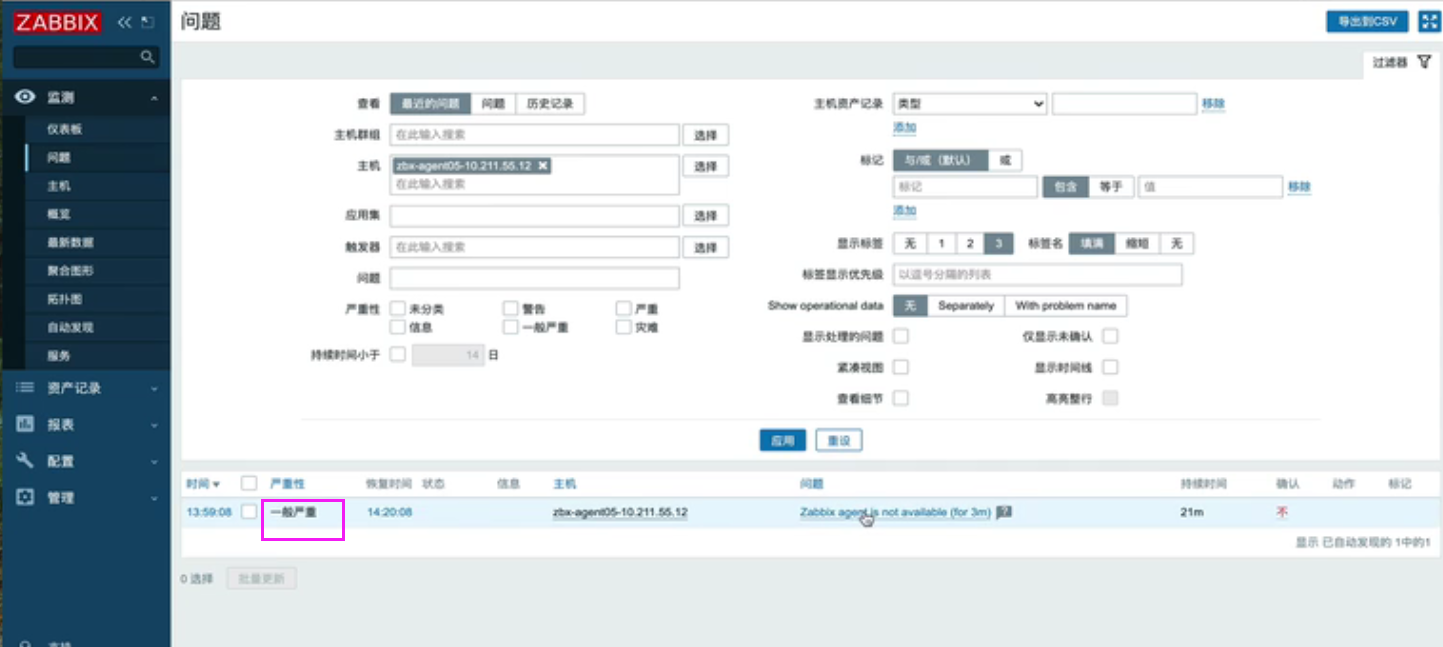
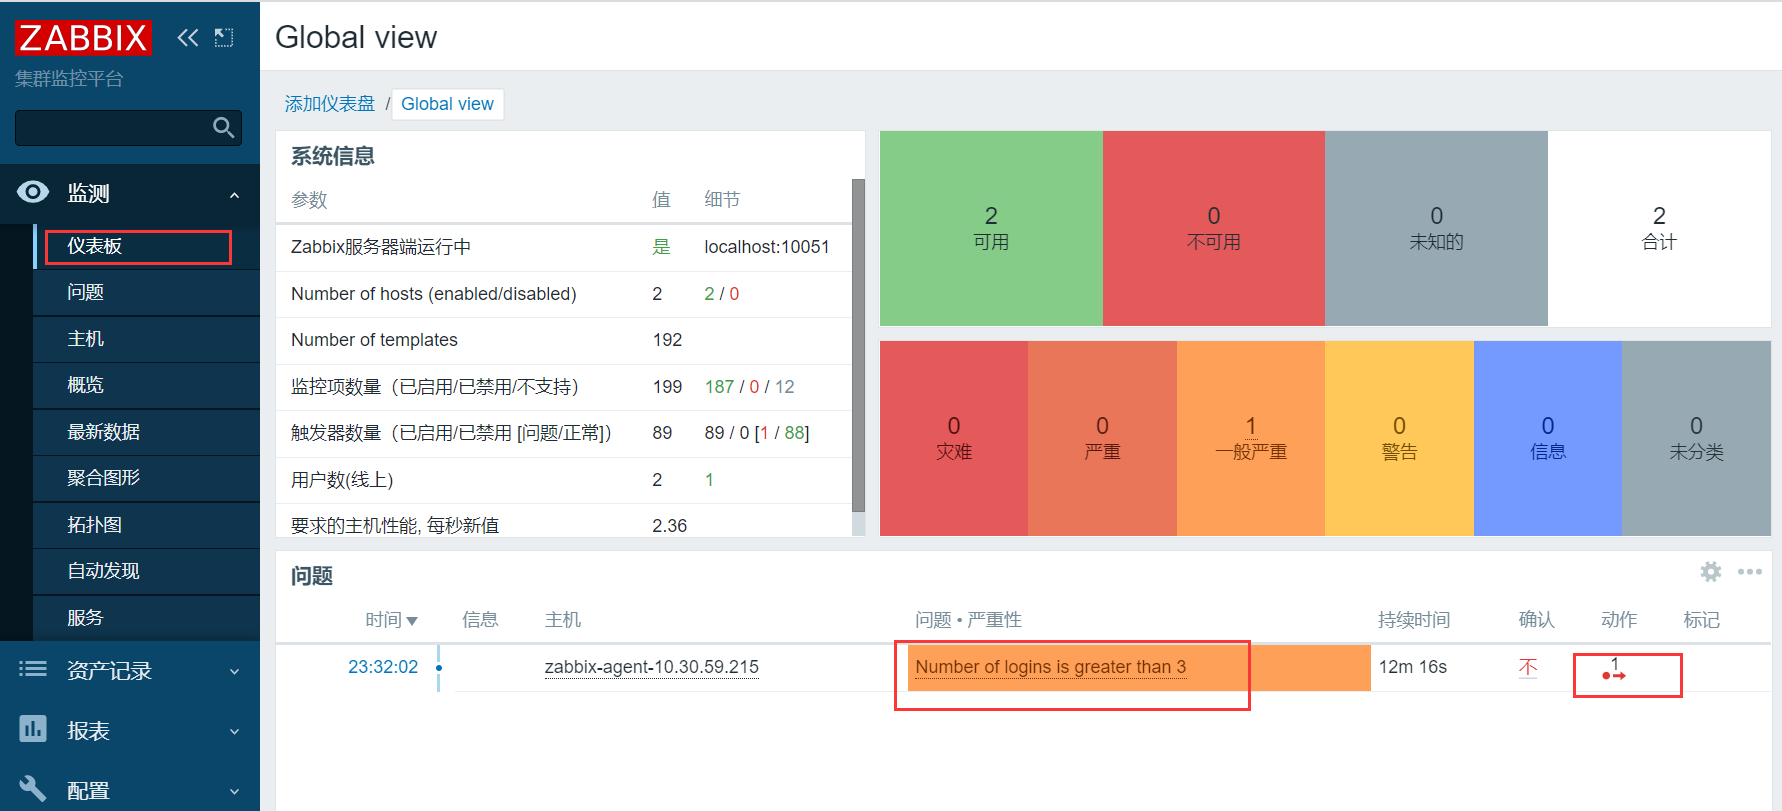
There is still an error message in the instrument cluster, the refresh disappears, and the problem (monitoring)
ZBX in monitoring - Host - client is gray
Configuration -- host -- ZBX is red in client
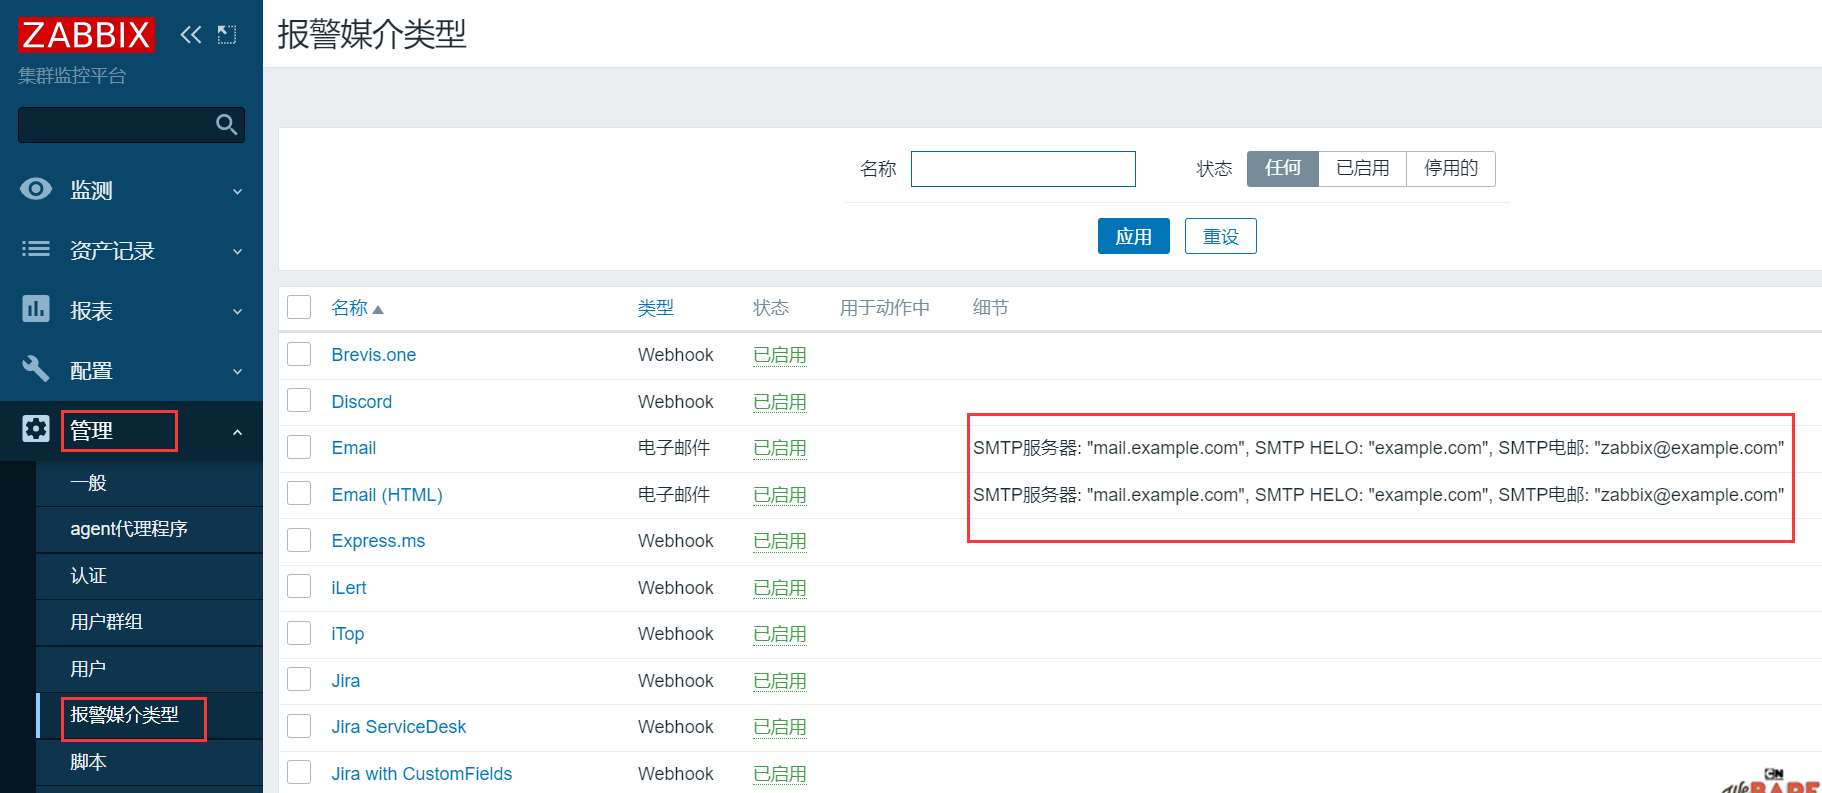
Management - alarm media type
Create media type - add (password is authorization code)
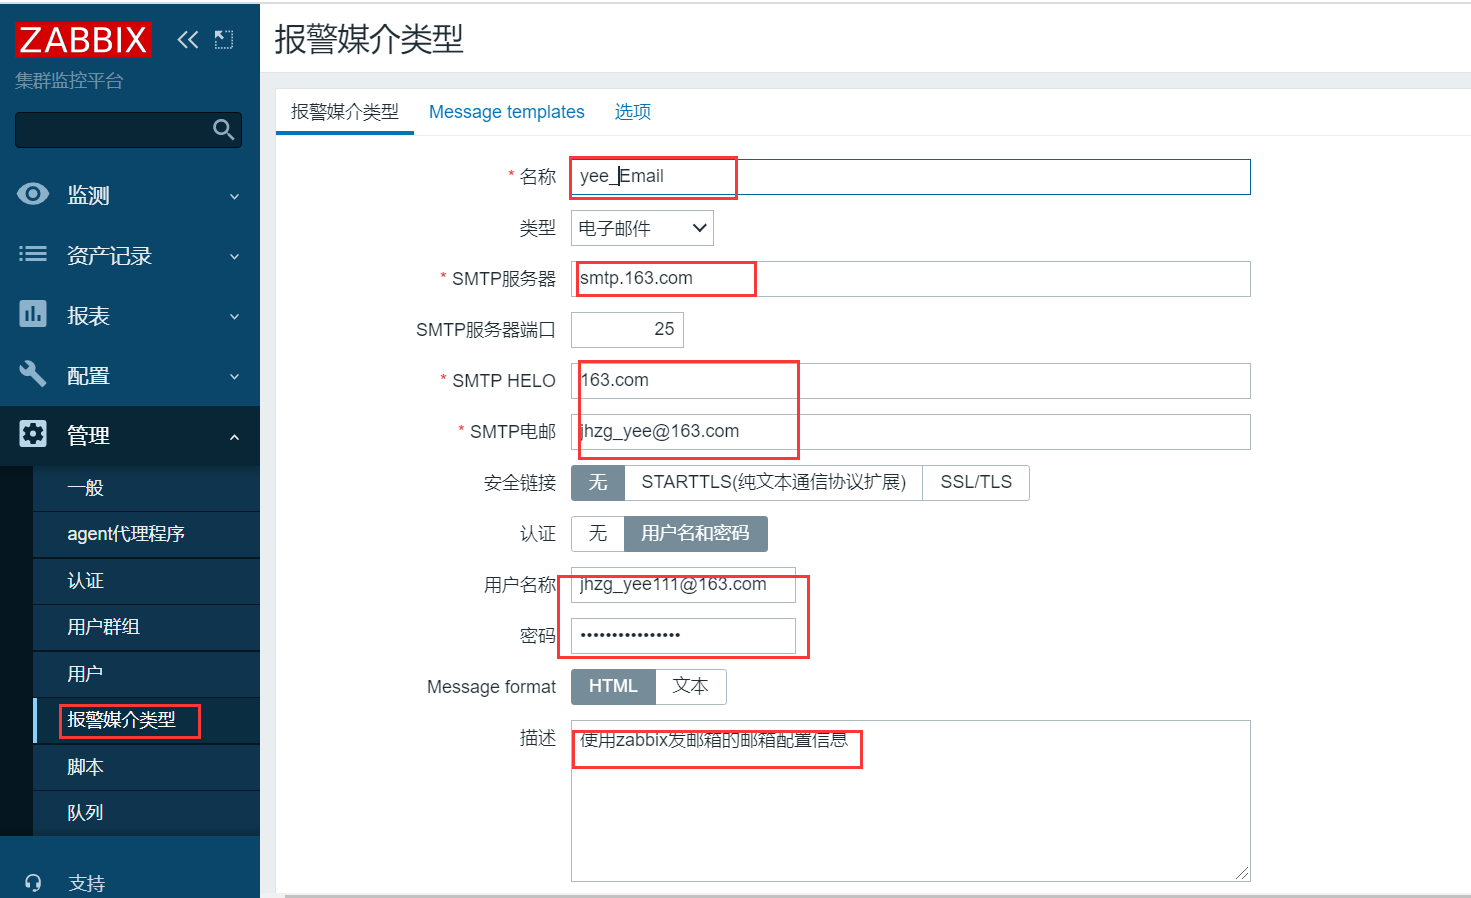
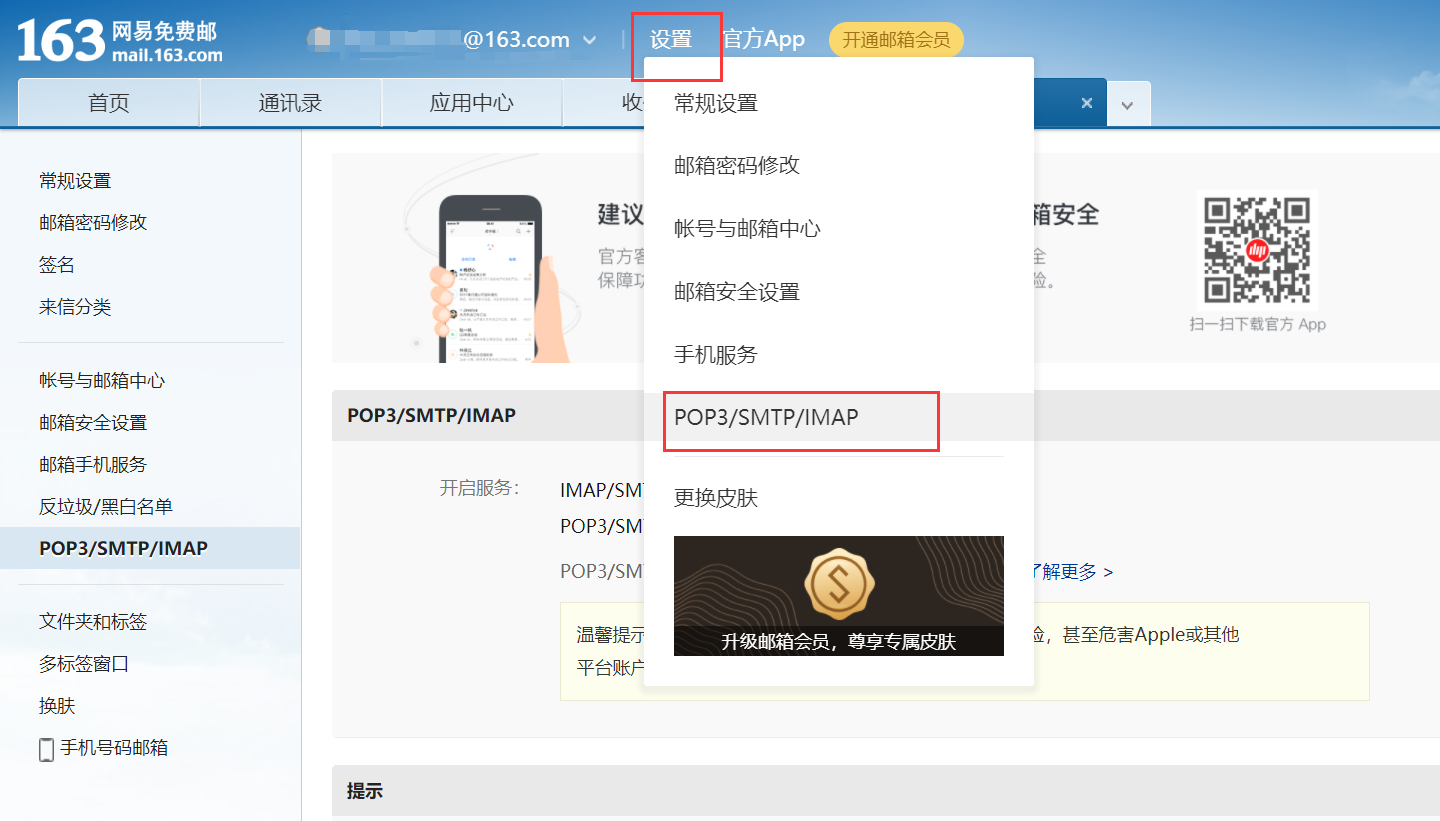
Email authorization code
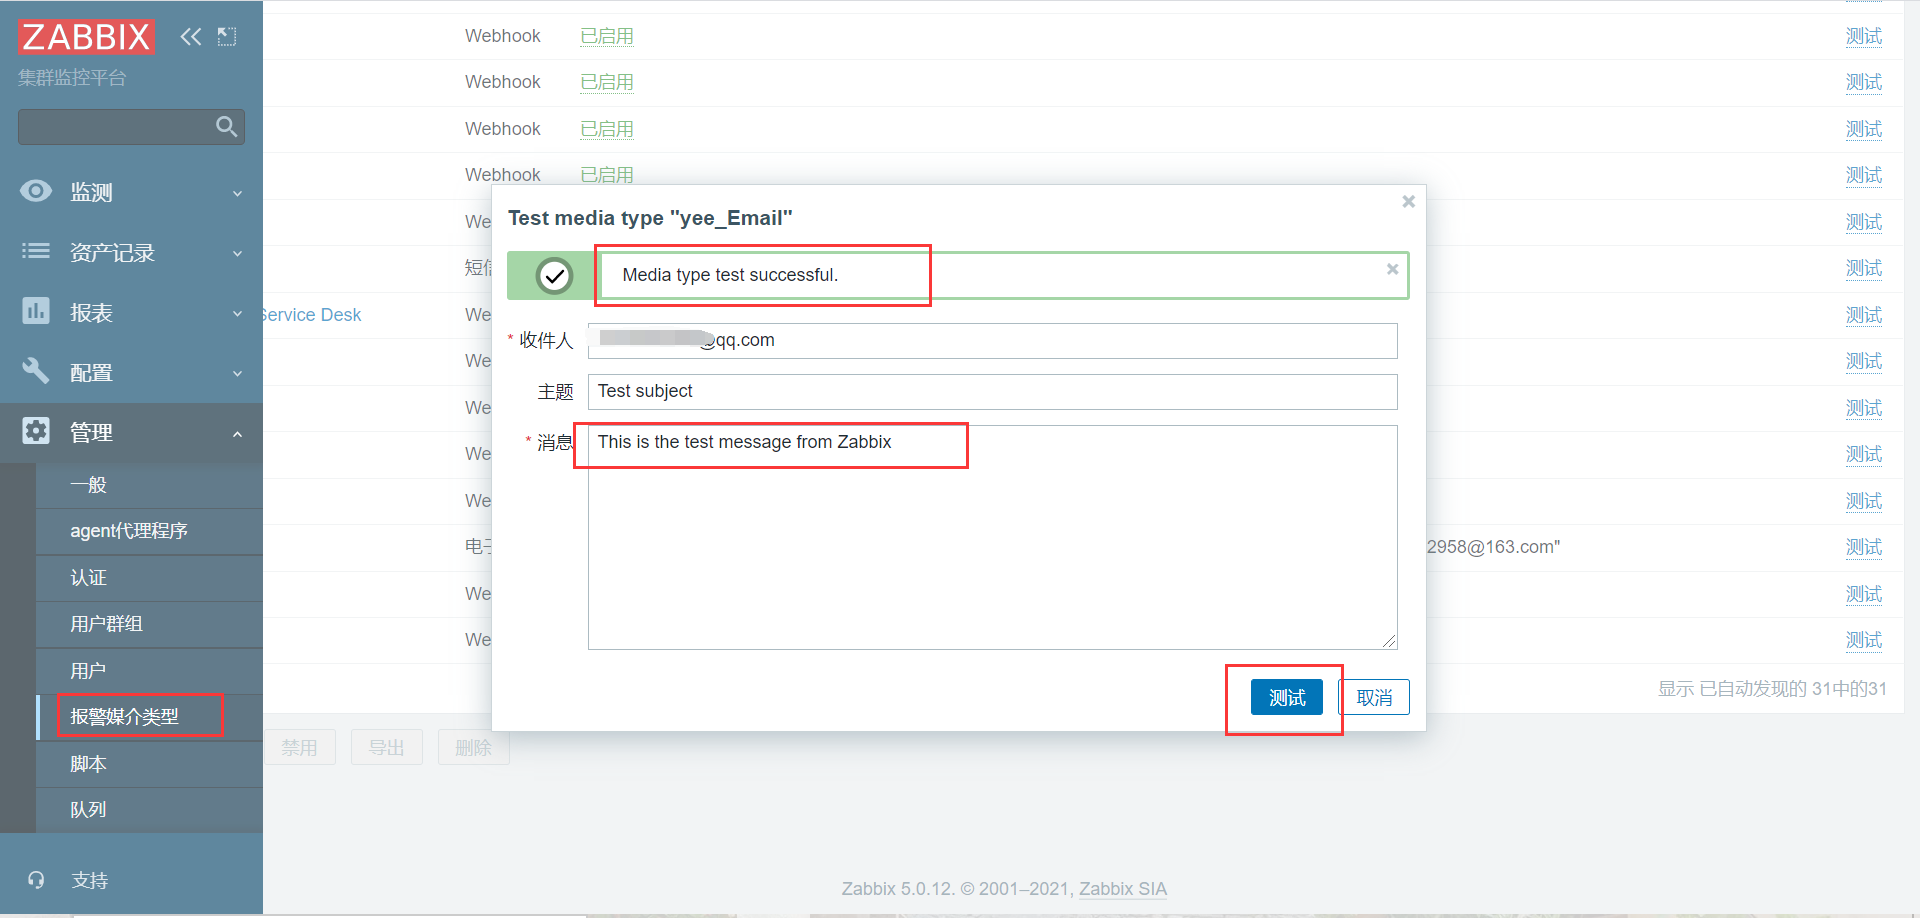
Already have yee_Email - click test

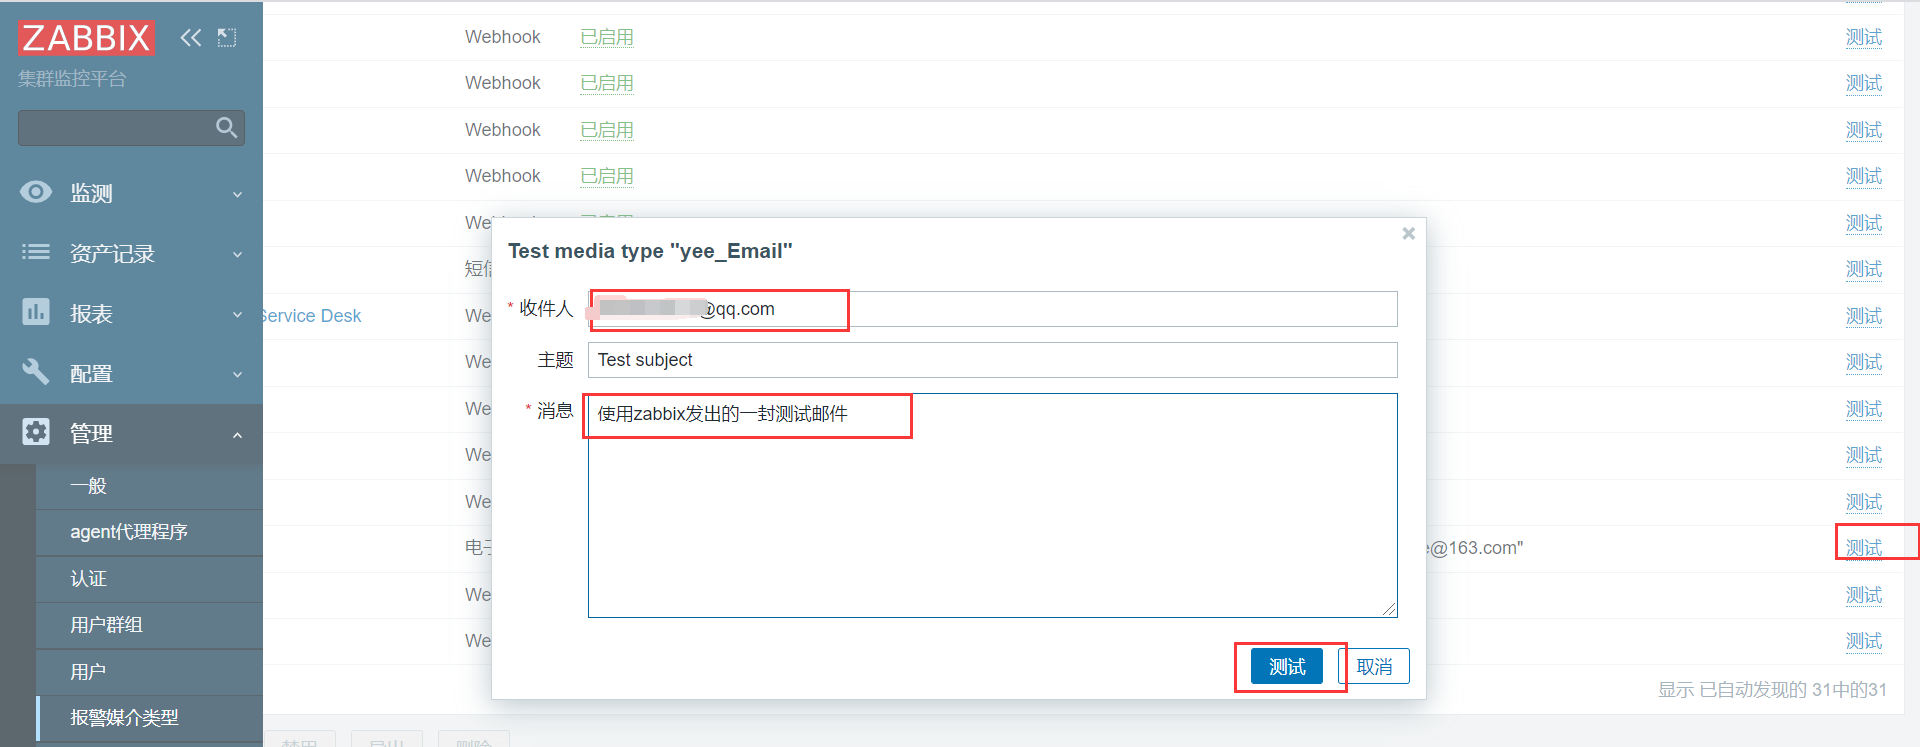
Mail test sent successfully
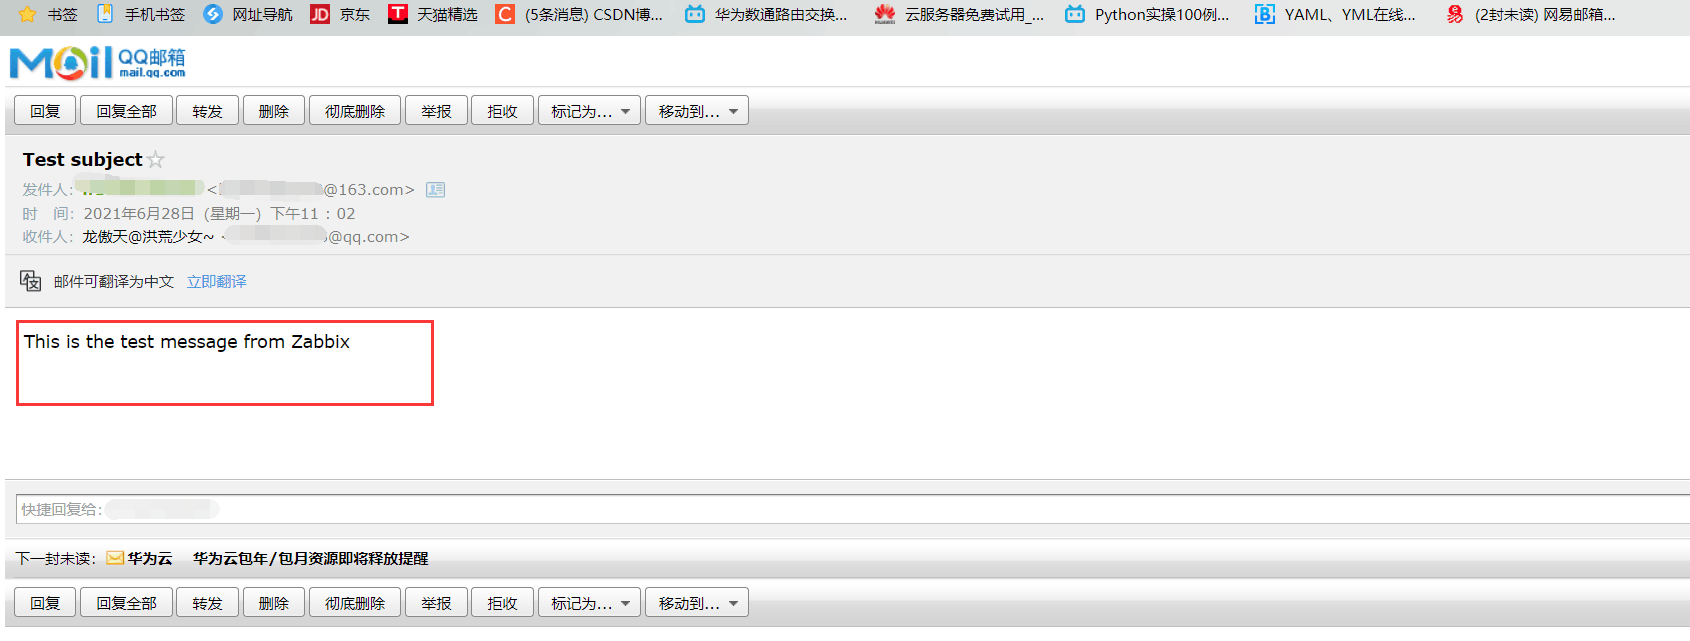
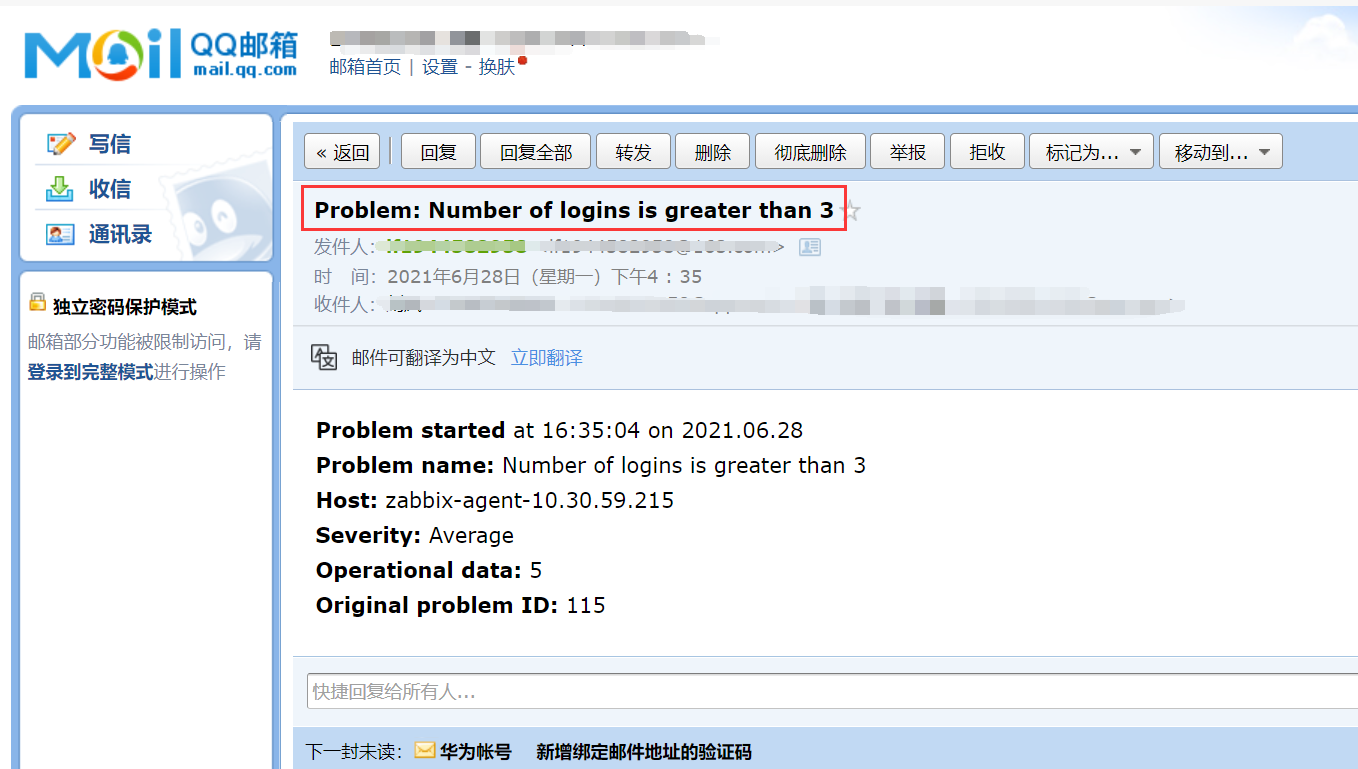
QQ email can see
Alarm media type - create media type - Message templates - click Add
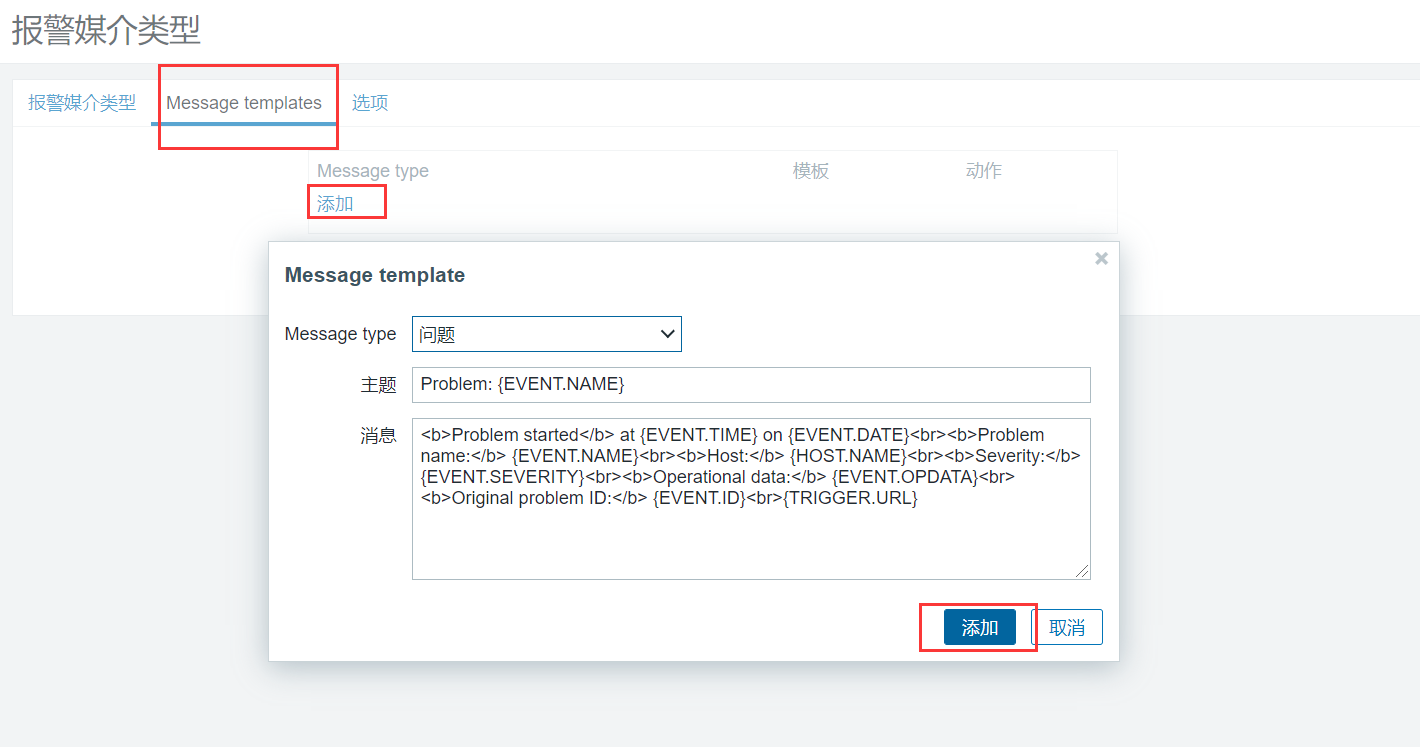
Alarm media ------ click Add
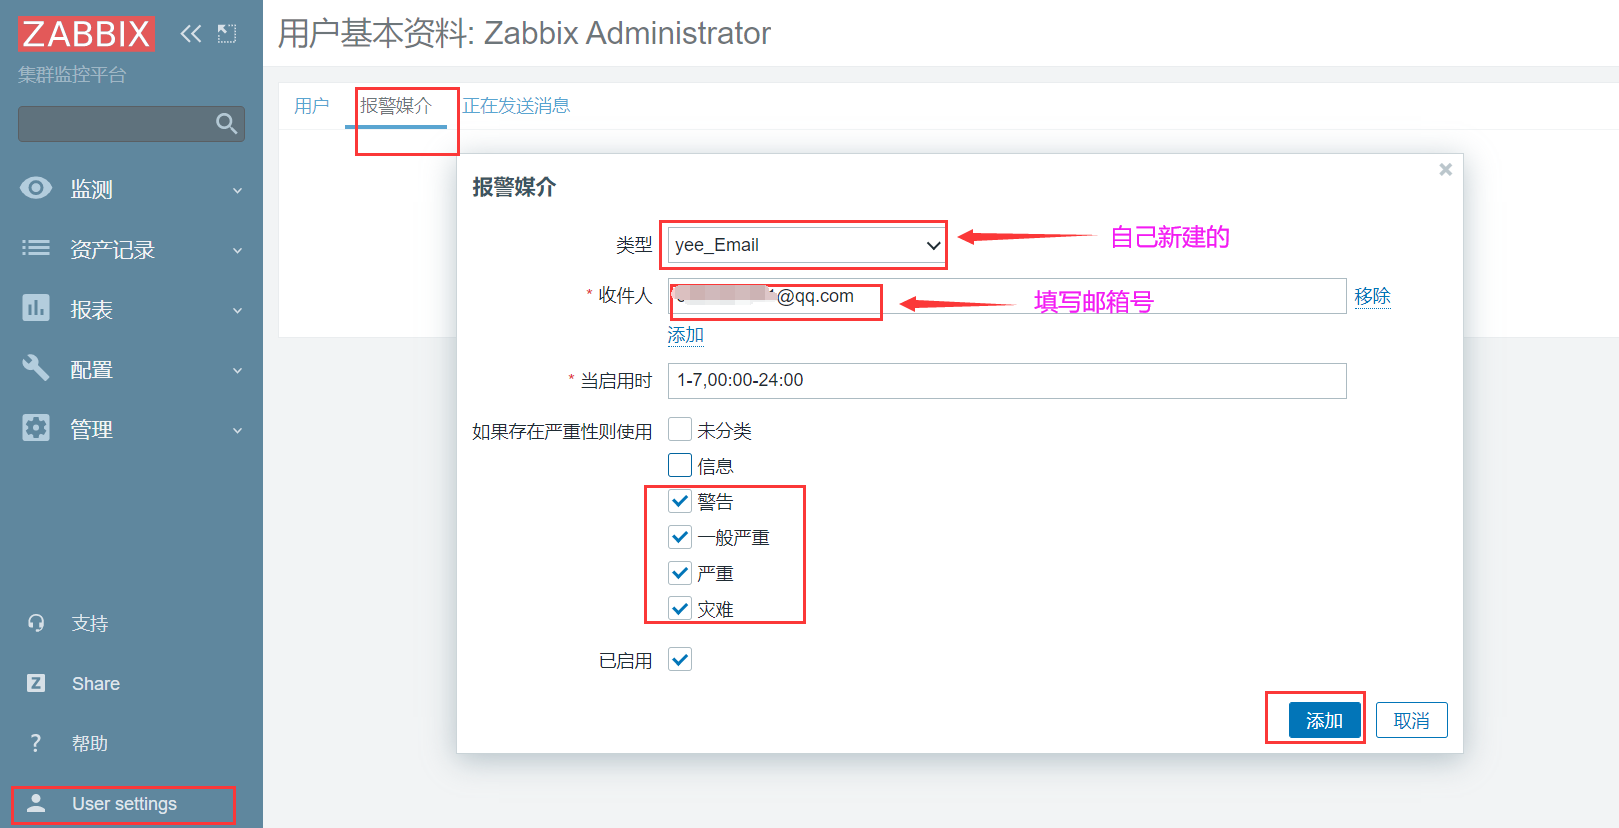
Add unclassified and information

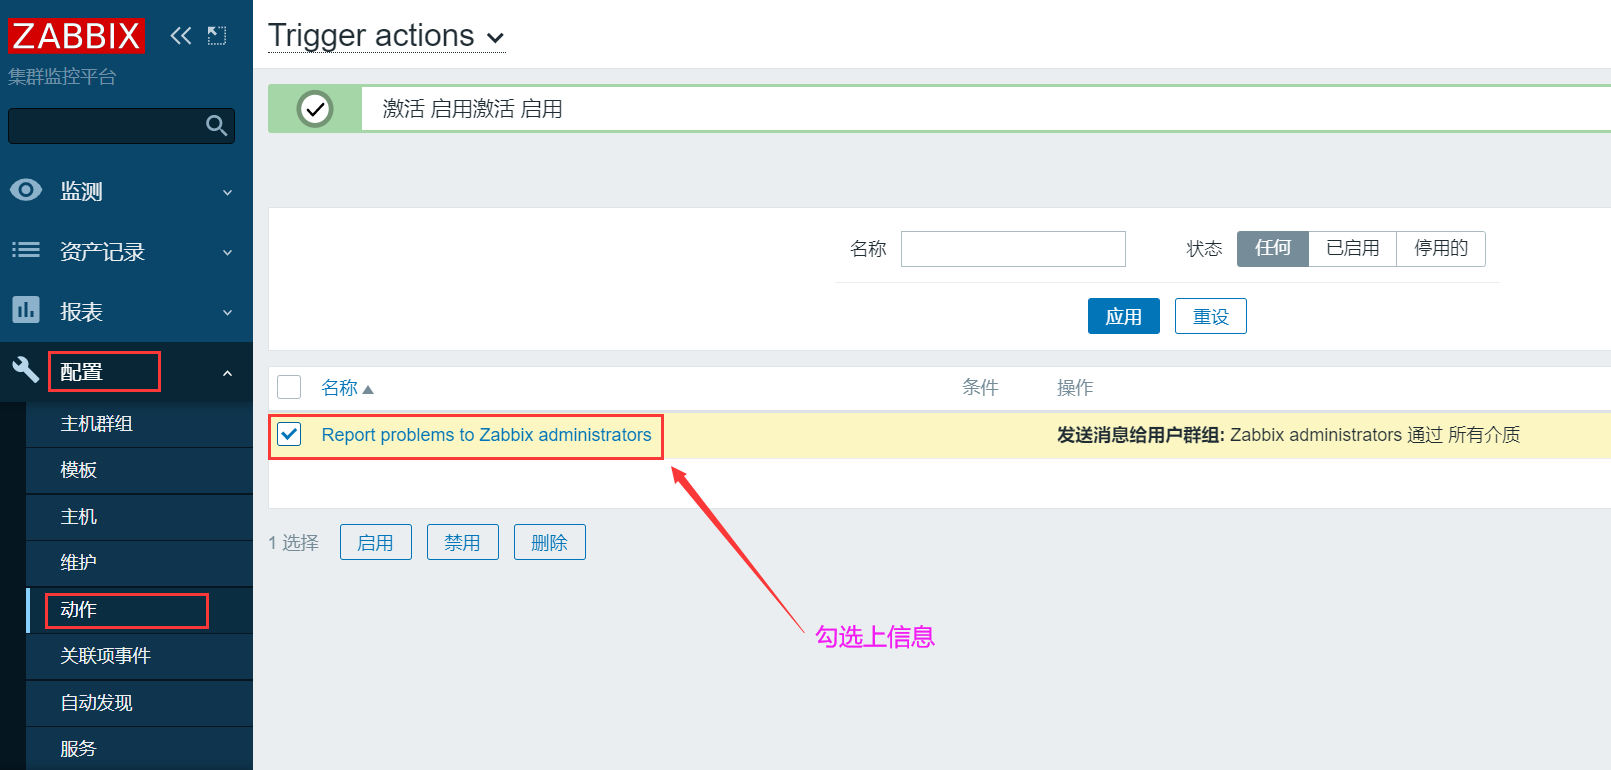
Configuration - Host - action
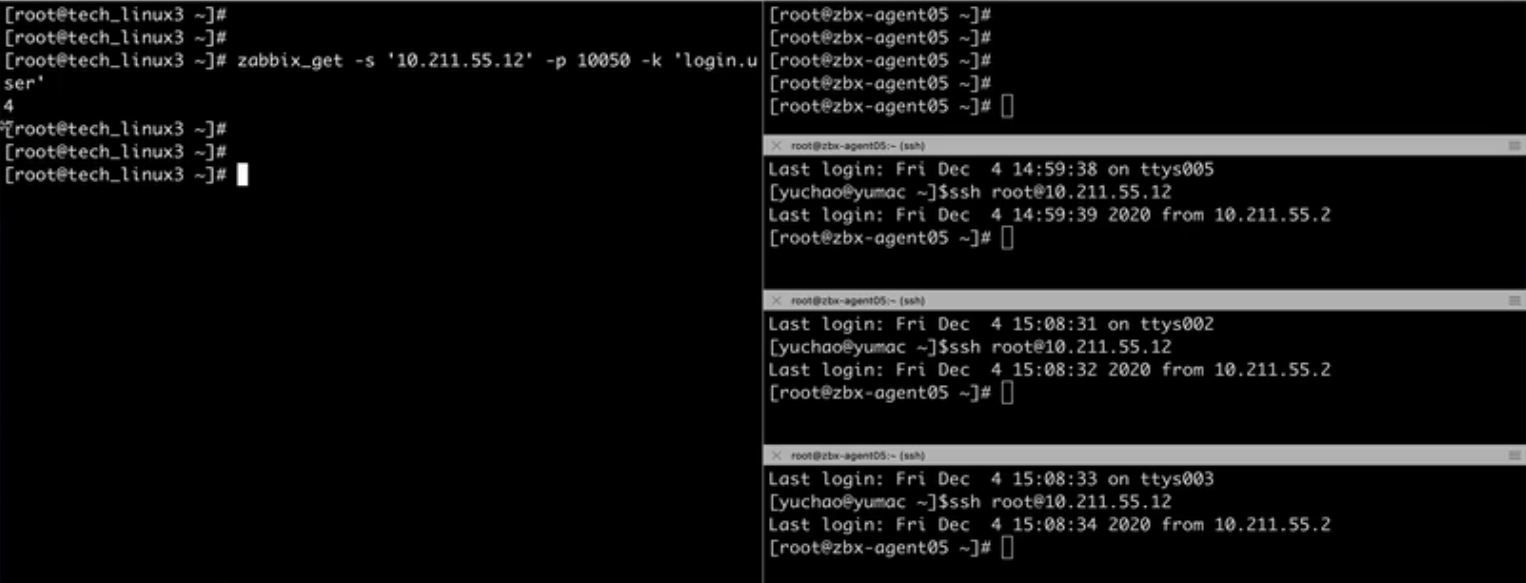
Multiple machines log in to ZABBIX server
View action
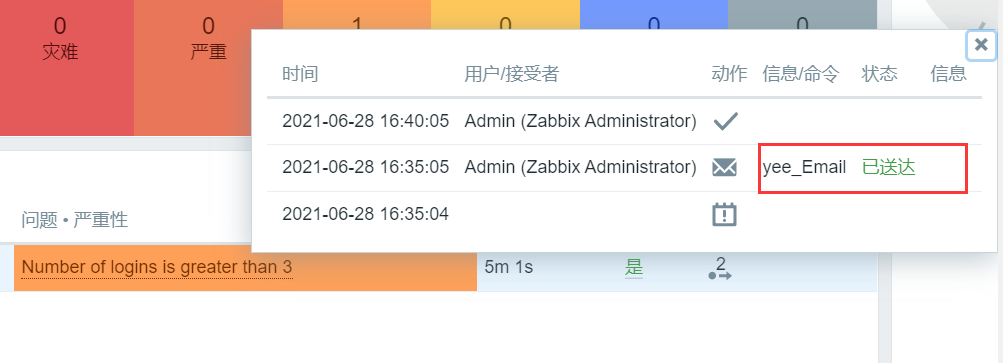
Send mail
https://www.cnblogs.com/operationhome/p/11072205.html
The following problems are reported: (please refer to the blog above)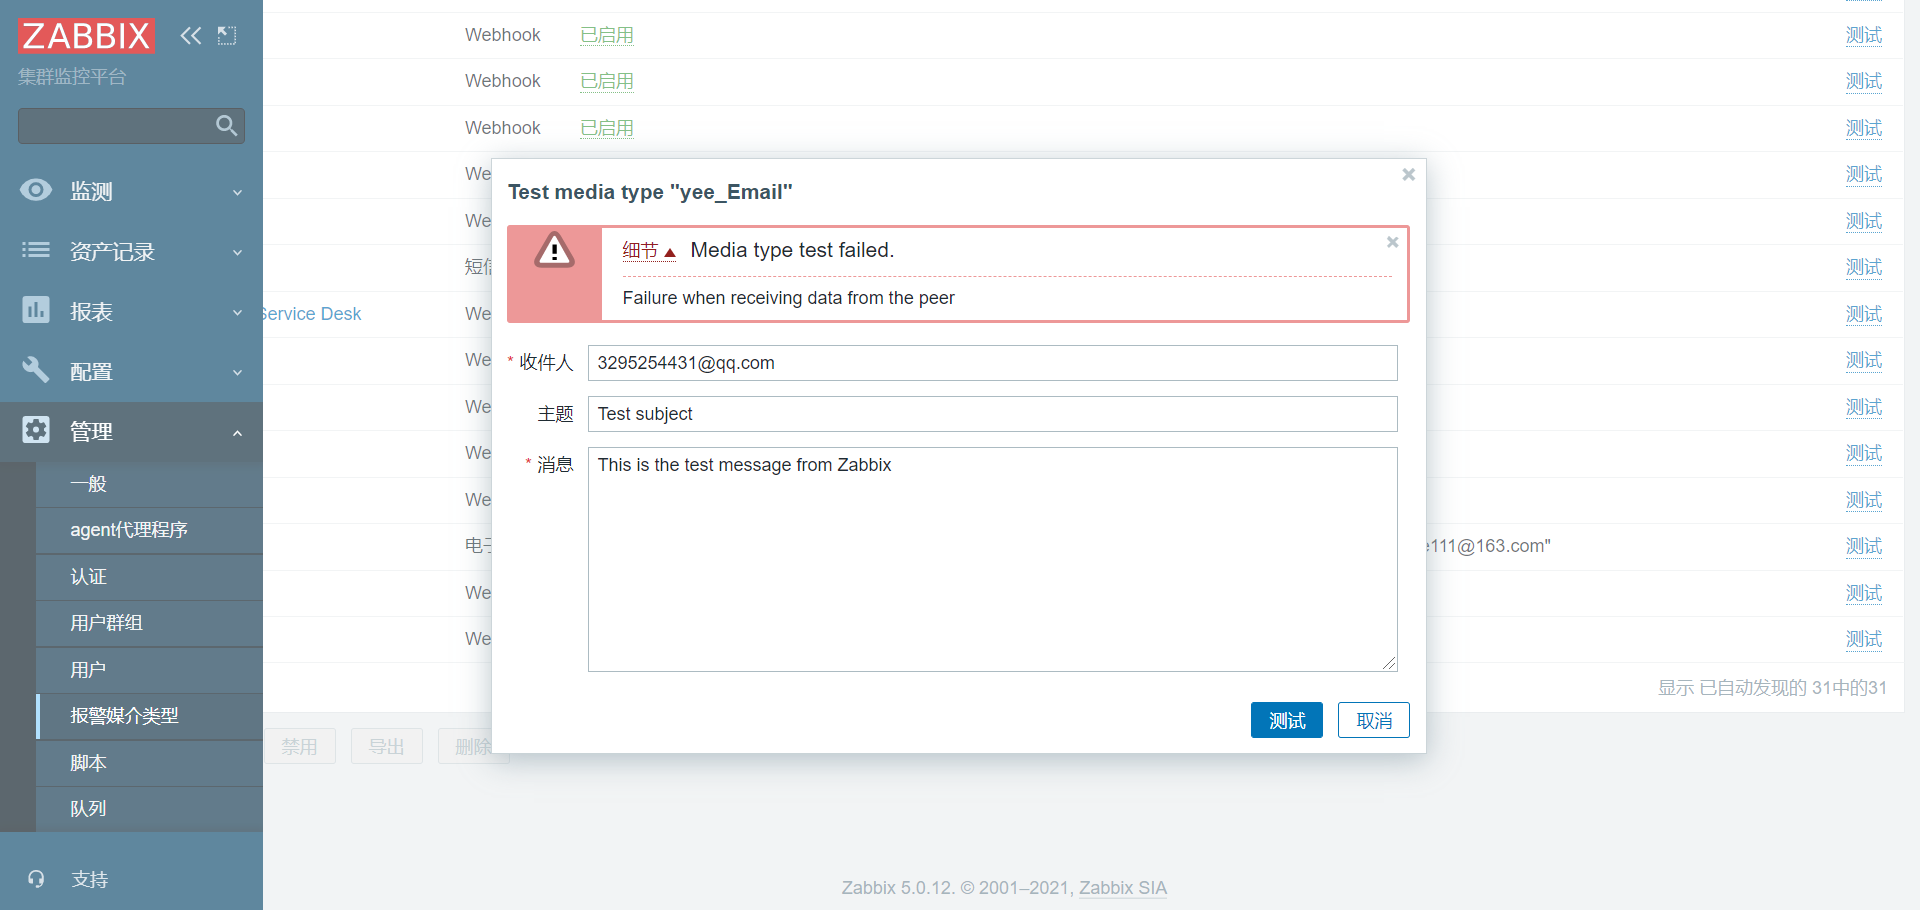
If the above steps are correct:
First synchronize the time and view the log file
[root@zabbix-server01 ~]# ntpdate ntp.aliyun.com
[root@zabbix-agent ~]# date Mon Jun 28 16:31:40 CST 2021 [root@zabbix-agent ~]# systemctl restart zabbix-agent2
[root@zabbix-server01 ~]# tail -n30 -f /var/log/zabbix/zabbix_server.log
28129:20210629:003046.115 failed to send email: Timeout was reached: Operation timed out after 40001 milliseconds with 0 out of 0 bytes received
 28126:20210629:003056.651 failed to send email: Failure when receiving data from the peer
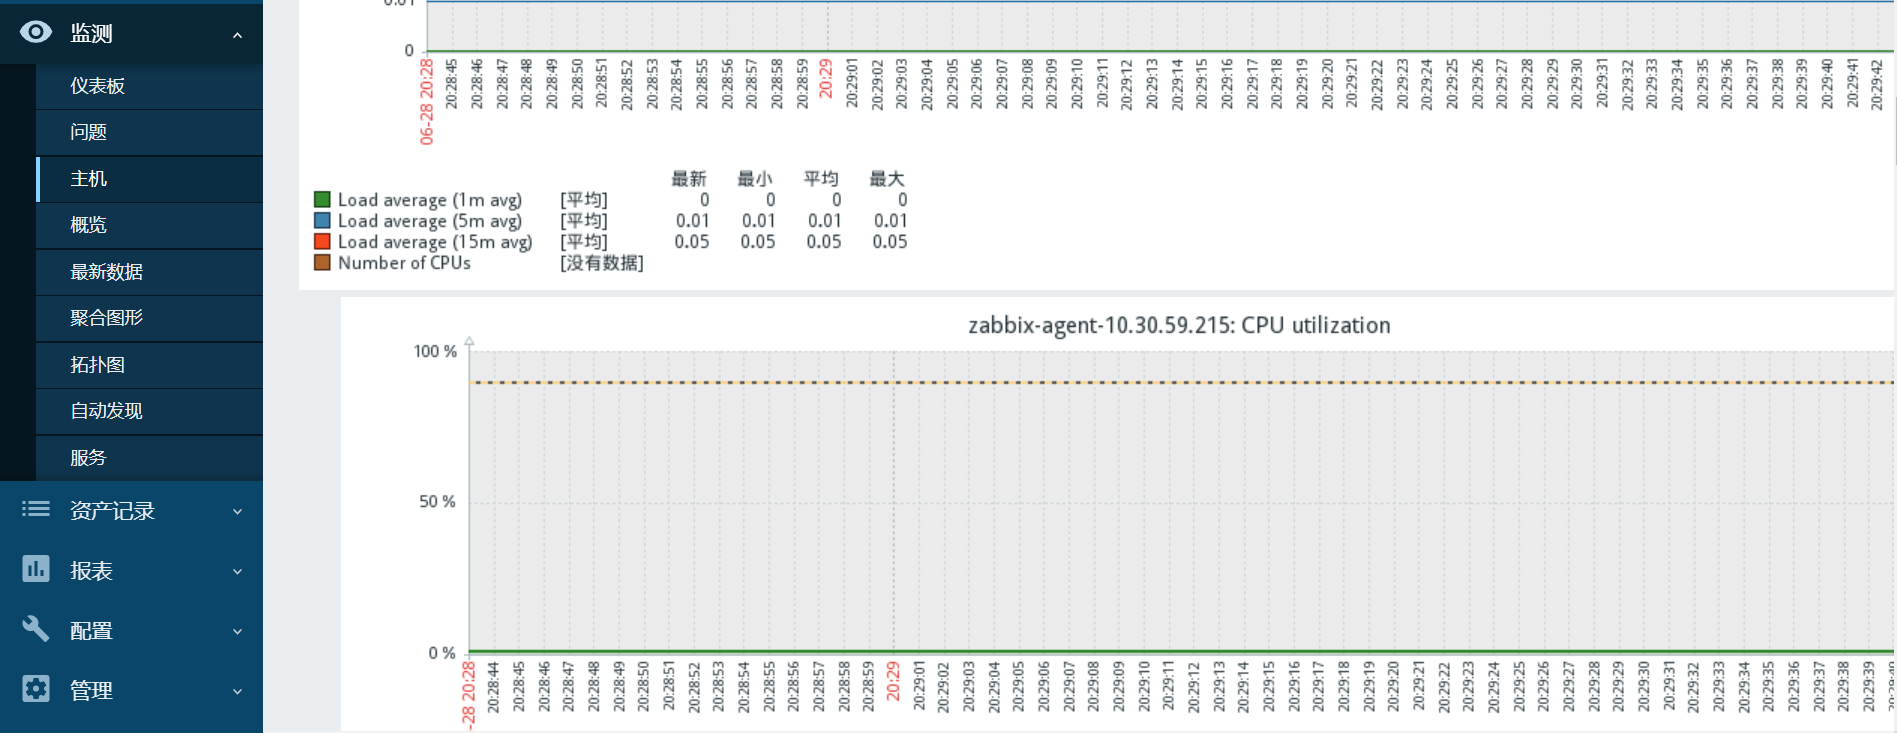
Aggregate graphics
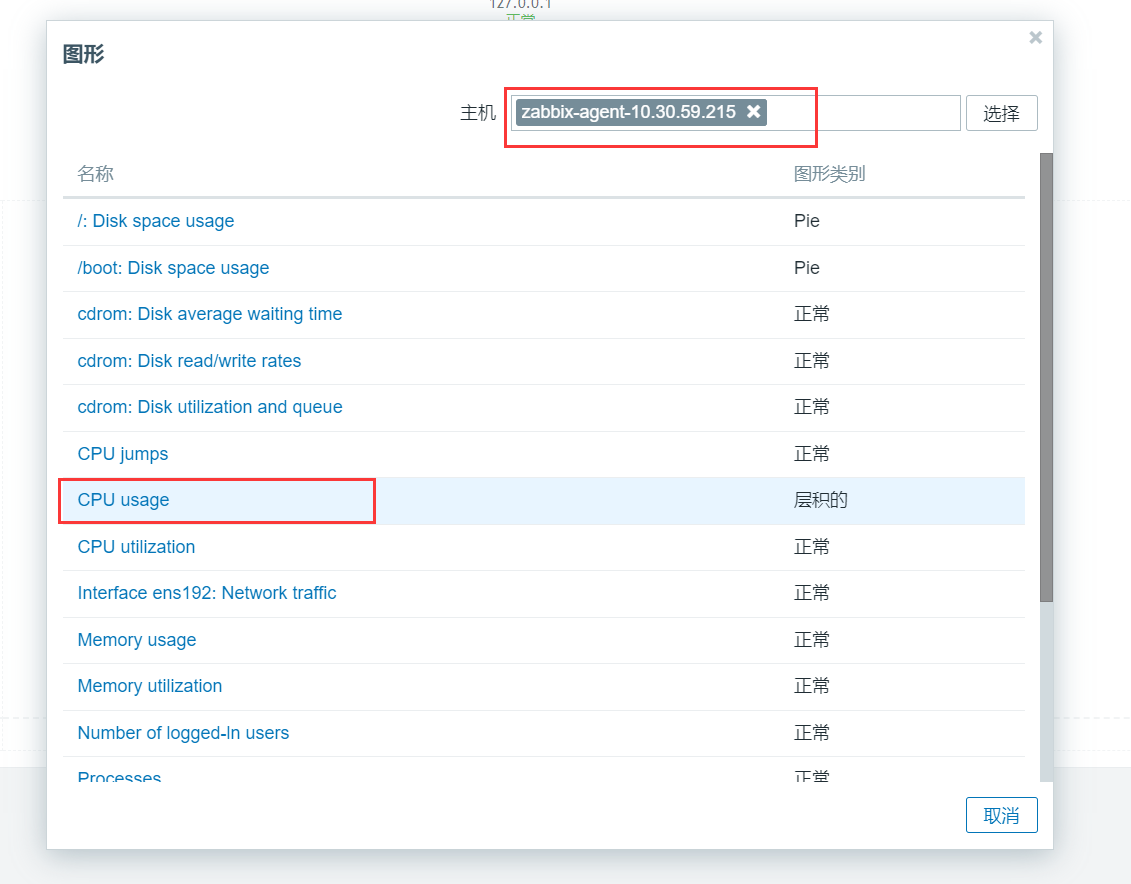
Monitor - aggregate graph - create aggregate graph
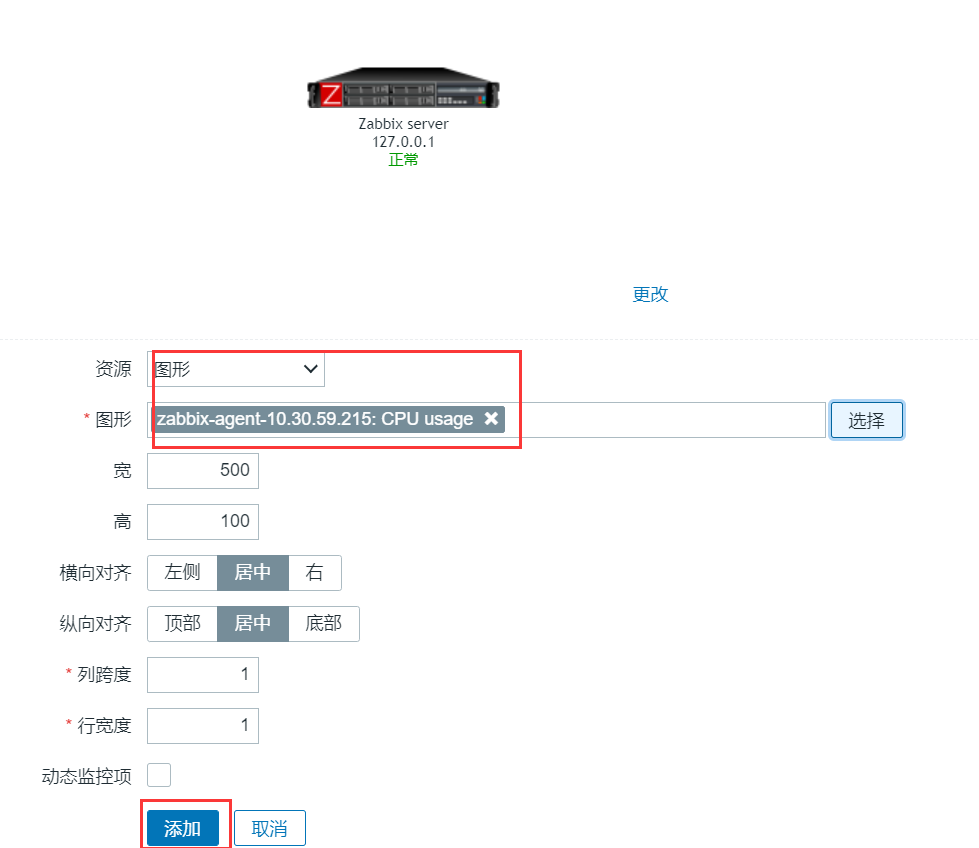
Aggregate graph ---- zabbix server ---- edit aggregate graph ---- change
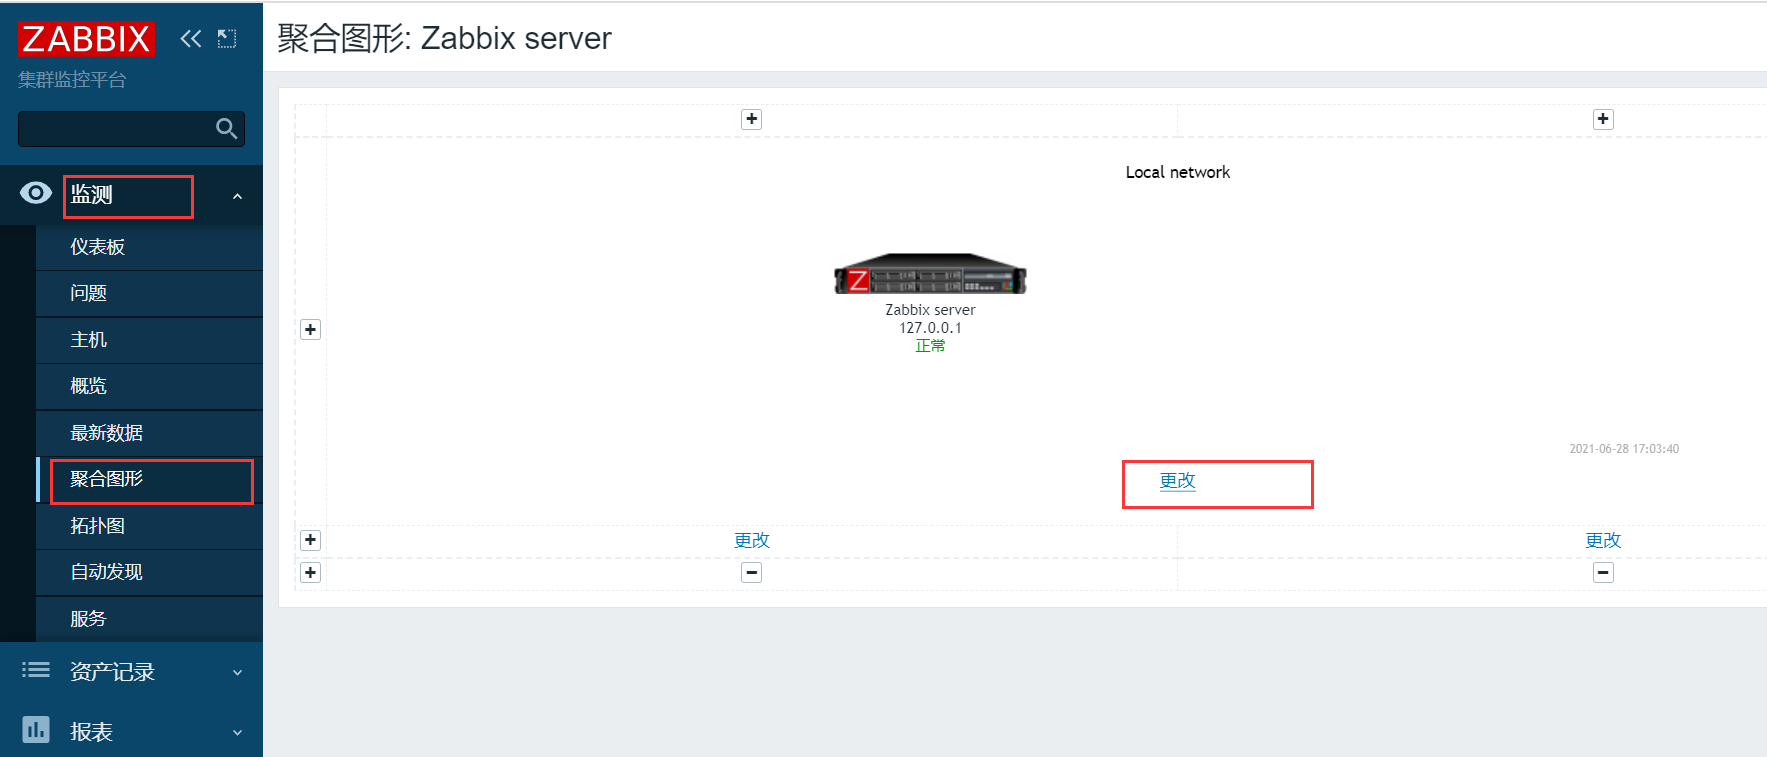
liunx server----zabbix-agent-10.30.59.215----CPU usage
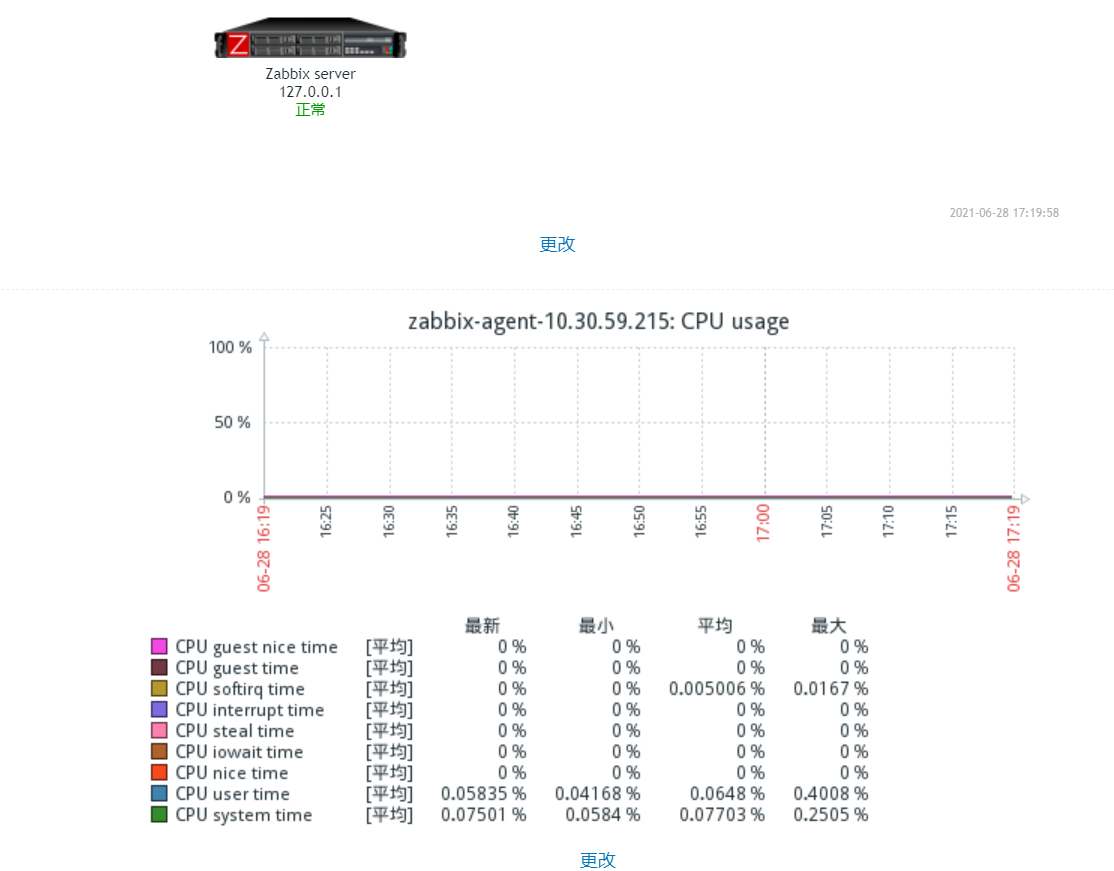
The aggregation graphical interface appears
Whole network monitoring scheme
thinking
1. Clone monitoring template
2. Automatic registration and automatic discovery
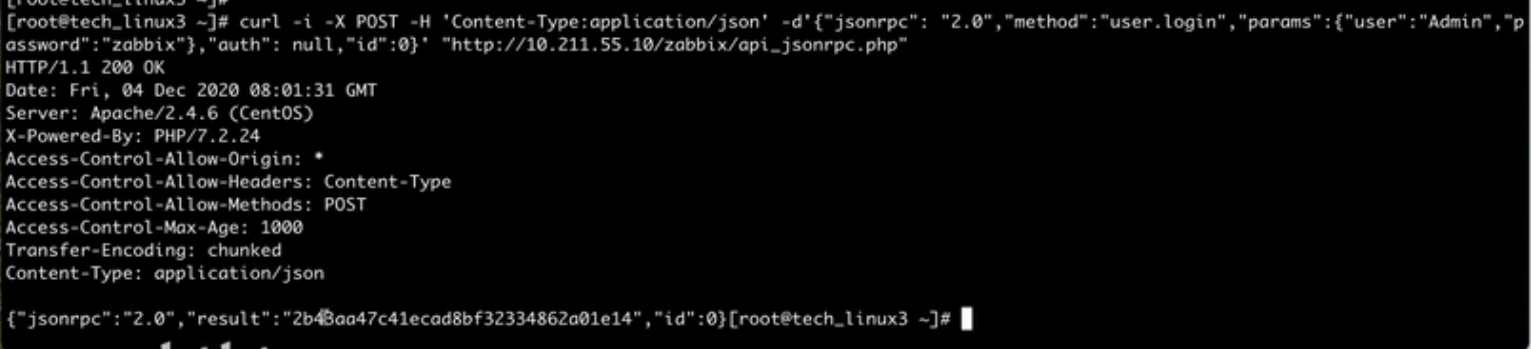
3. Use zabbix's api excuse and curl language. Or develop your own programming python
All kinds of software used in our schedule provide API interfaces for developers to modify and obtain data.
usb interface of computer is equivalent to usb interface
[root@zabbix-server01 ~]# curl -i -X POST -H 'Content-Type:application/json' -d'{"jsonrpc":"2.0","method":"user.login","params":{"user":"Admin","password":"zabbix"},"auth":null,"id":0}' "http://10.30.59.215/zabbix/api_jsonrpc.php"
Monitoring implementation scheme
Hardware monitoring Perspective
Application service monitoring
Configuration - template - linked template - ZABBIX agent-10.30.59.215 - template
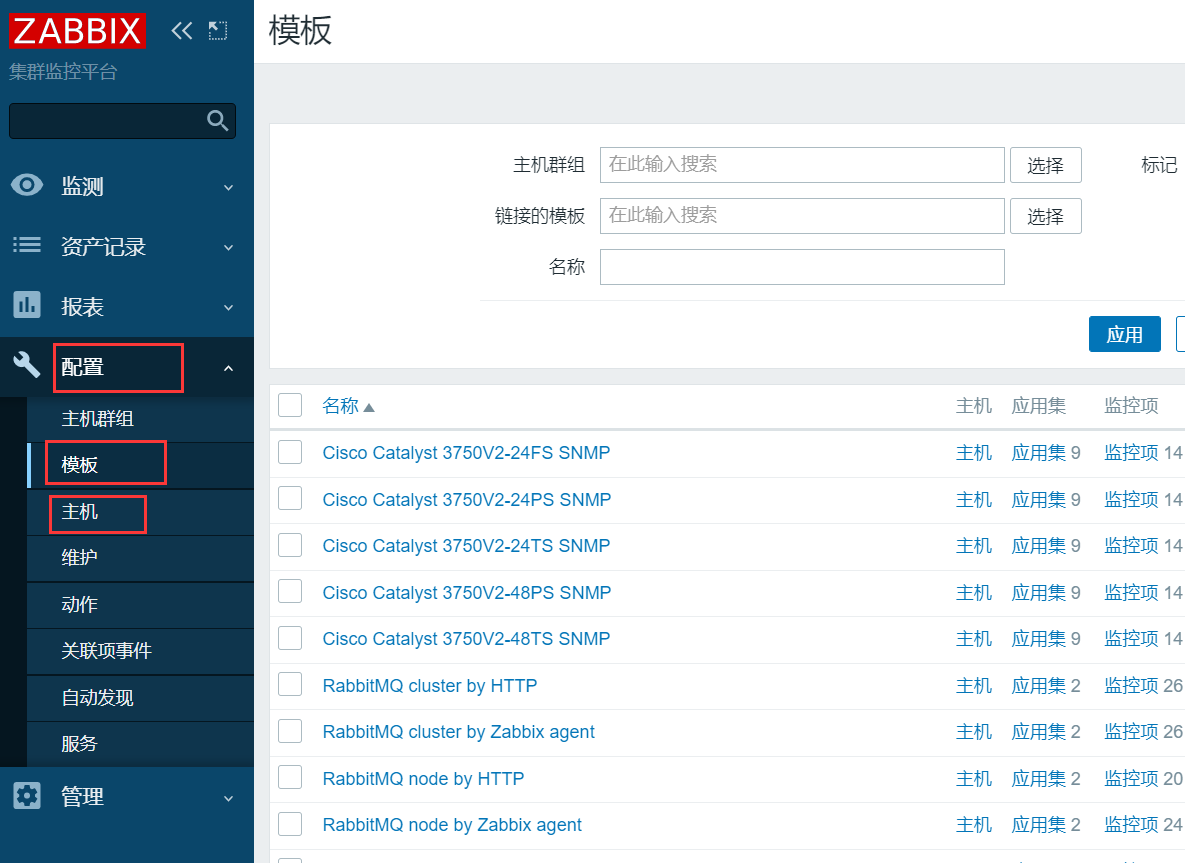
Enter the linked template - view monitoring item = = monitoring - Host - Graphical of host

There are a large number of open source templates available on the Internet
1. rsync service monitoring
Monitor whether the server 873 port is alive
For port monitoring, use the key provided by zabbix to search net tep. port[,873]
Push and pull the data to test the effect
2. Monitor whether NFS service is normal
Detect 111 port net through key tep. port[,111]
showmount -e ip | wc -l
3. Monitor whether the mysql database is normal
Via port net tep. port[,3306]
mysql -uroot -p
zabbix has its own mysql monitoring template. You can directly add the association between the main board and the mysql host
4. web server monitoring
net.tep.port[,80]
zabbix also provides monitoring templates for web servers
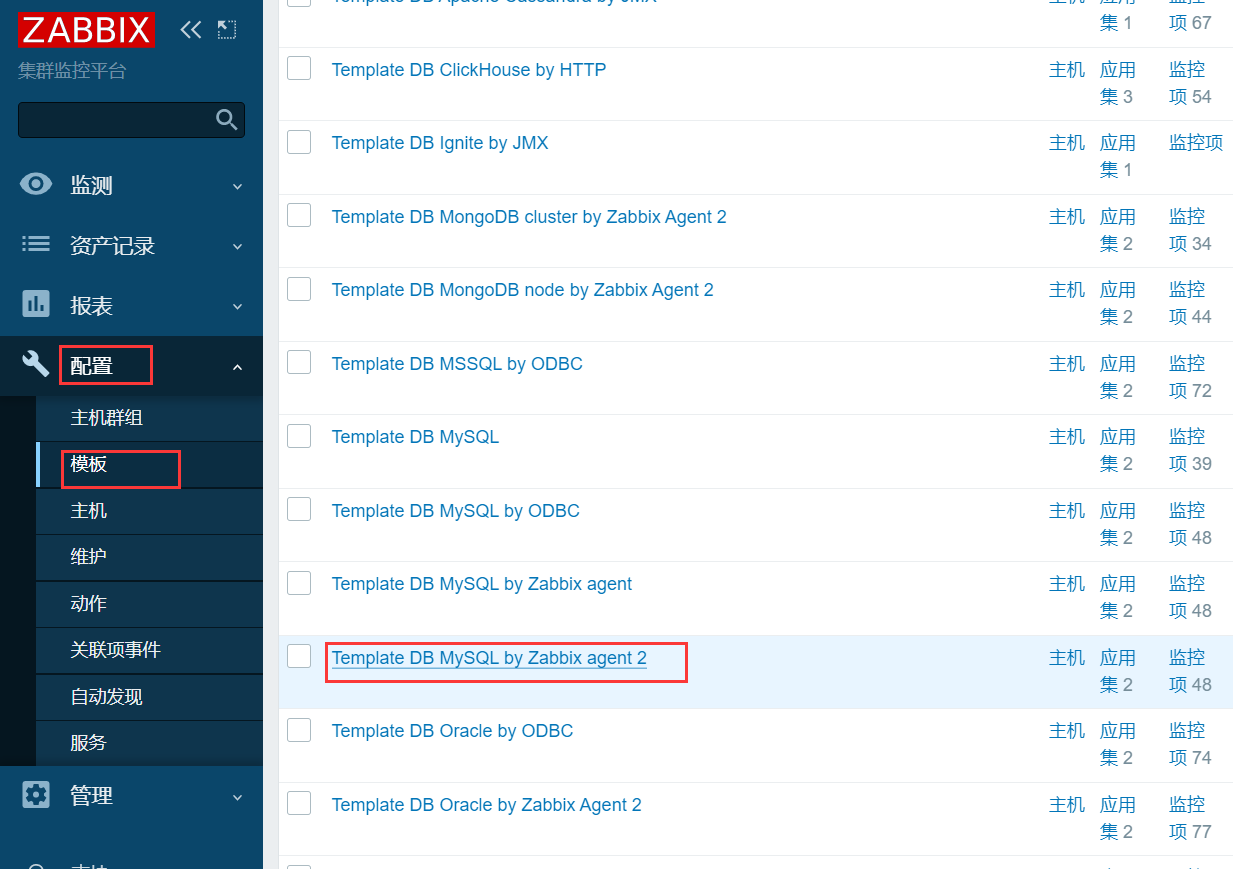
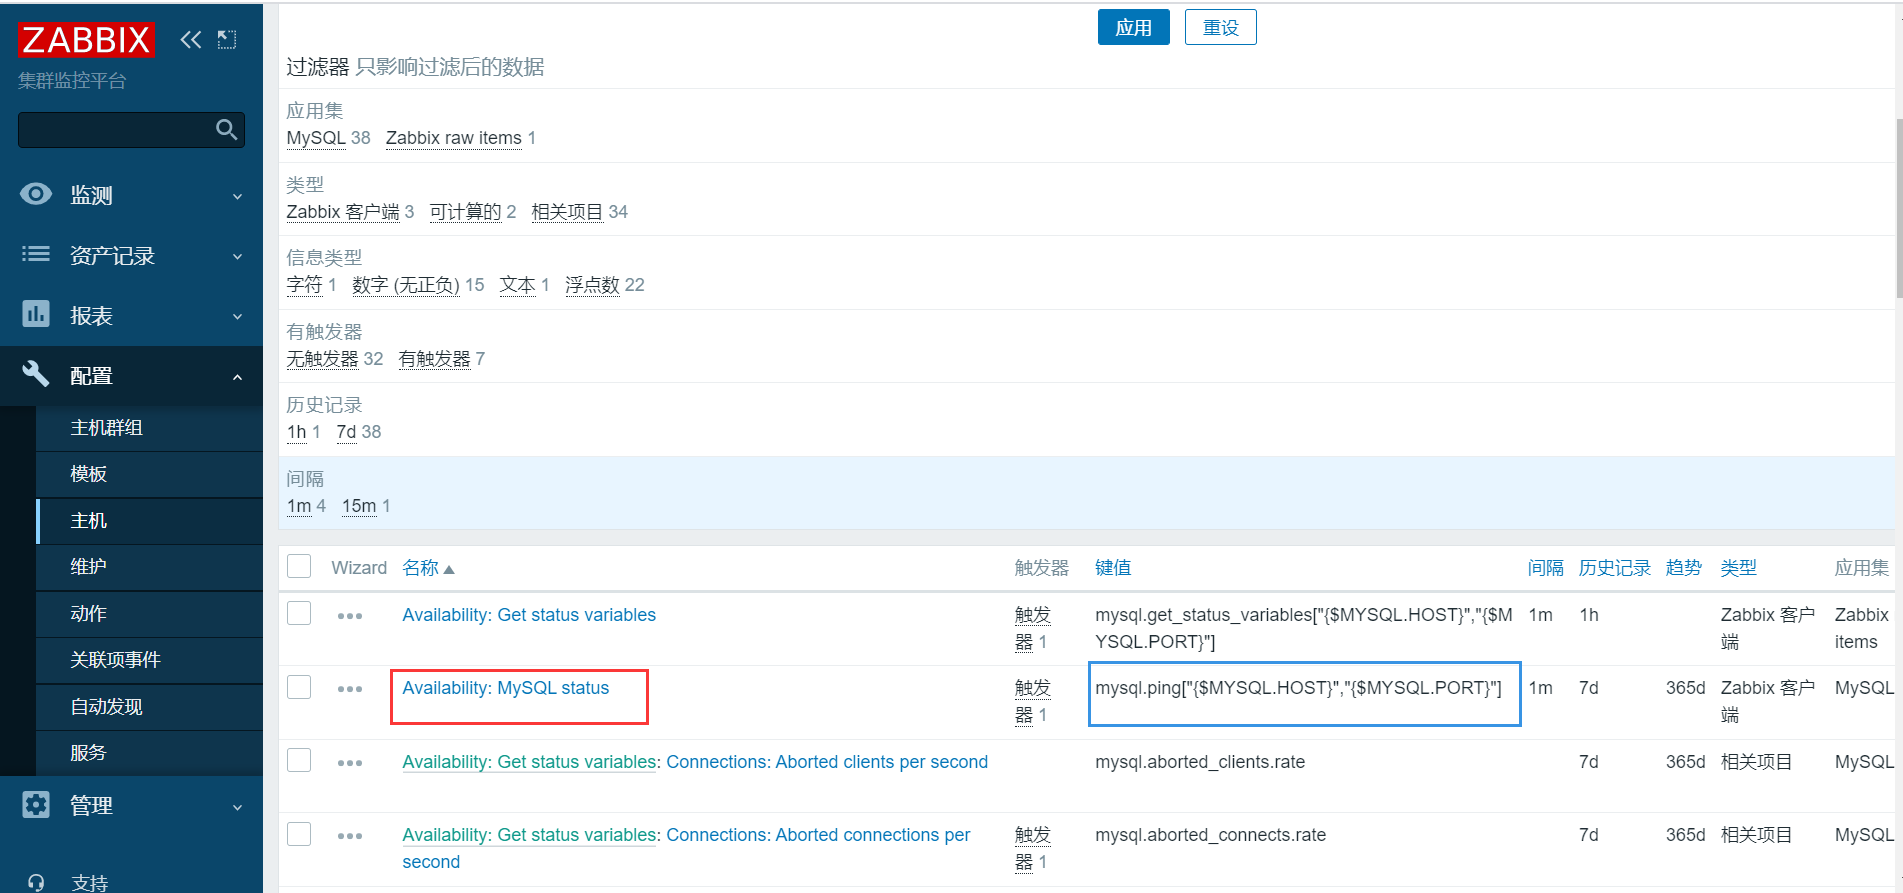
Click the monitoring item to find out whether there is a mysql port

Template DB MySQL - monitoring items
 Specific method of monitoring server
Port detection command
netstat
ss
Isof
Check whether the port survives in combination with grep.
Check whether the port is alive on the client
[root@zabbix-agent ~]# netstat -tunlp |grep nginx

On the server, query port 80
[root@zabbix-server01 ~]# zabbix_get -s '10.30.59.215' -p 10050 -k 'net.tcp.port[,80]'
1
[root@zabbix-agent ~]# pkill nginx kill process
[root@zabbix-server01 ~]# zabbix_get -s '10.30.59.215' -p 10050 -k 'net.tcp.port[,80] 'process is 0
0
Query process information
ps
Connect via client
web Server use curl query
mysql use sql Statement connection verification
 Cache database service, data read / write verification
Custom discovery auto registration
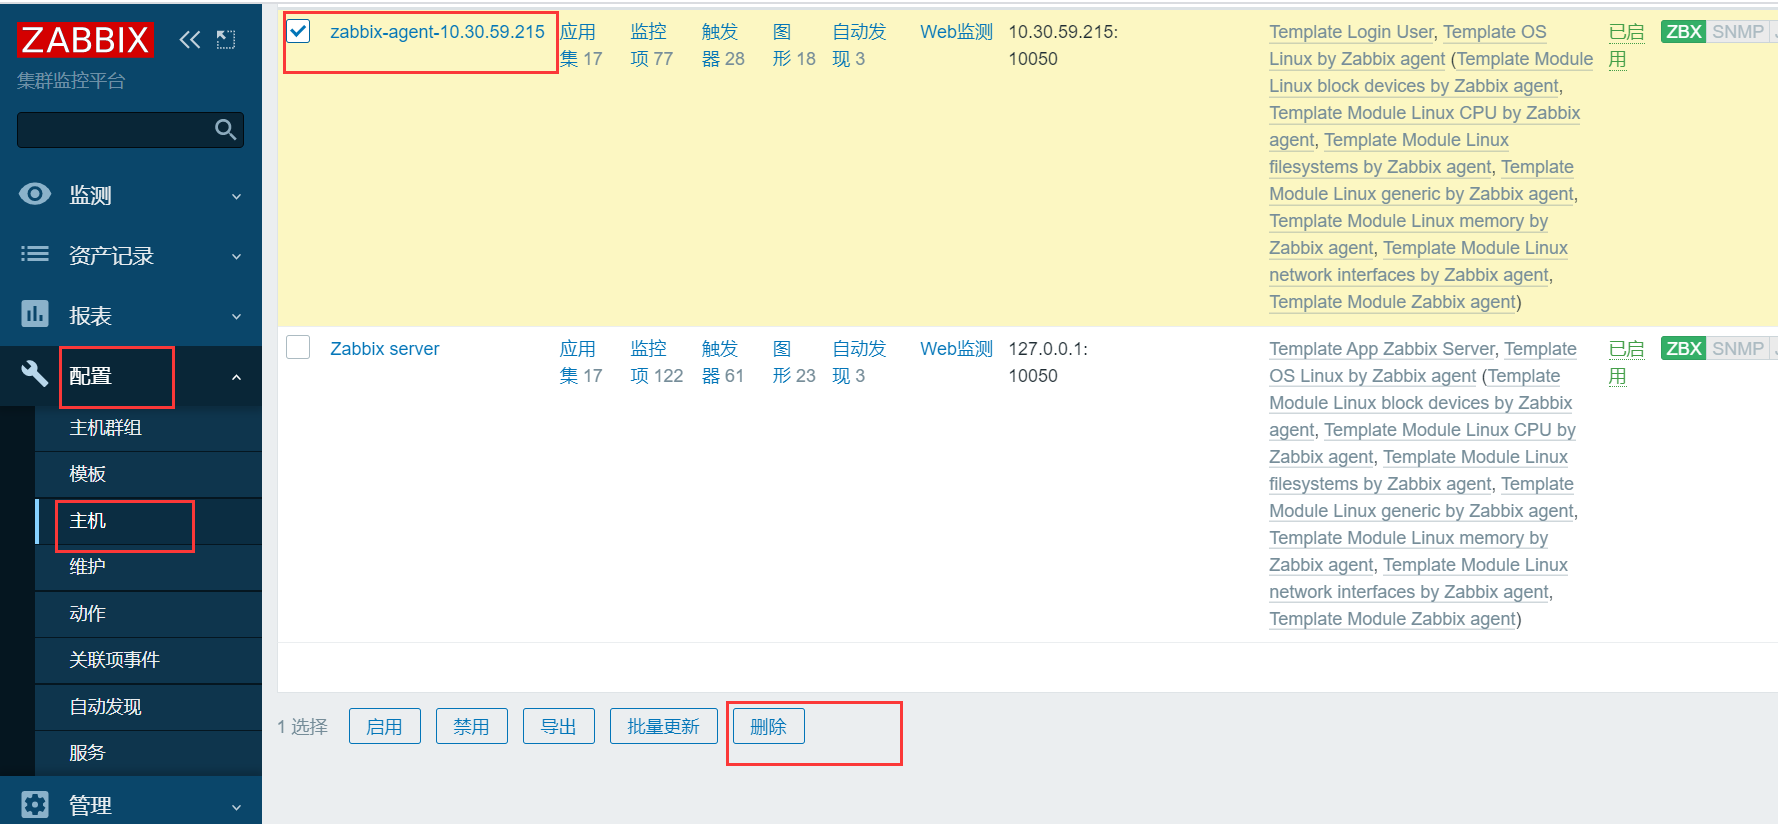
Configuration ----- host ----- delete ZABBIX agent-10.30.59.215
Make sure rabbix-agent2 is running correctly
[root@zabbix-agent ~]# systemctl is-active zabbix-agent2
active
Verify that the client is alive
[root@zabbix-server01 ~]# zabbix_get -s '10.30.59.215' -p 10050 -k 'agent.ping'
1
What is auto discovery, auto registration
1. Auto discovery
zabbix server takes the initiative to find many clients, and then logs in the client information to the server machine.
Disadvantages: zabbix server will be under great pressure
If you define a network segment 100-200, it takes a long time and is under great pressure
2. Automatic registration
zabbix agent2 actively reports its own information and sends it to zabbix server
The disadvantage is that agent2 may not find the server (the configuration file is written incorrectly, or the network is blocked)
3. Difference between passive mode and active mode (in agent2 position)
Passive mode: for agent2, it is the server to find agent2 and get the data
Active mode: agent2 actively sends information to server
Configure hosts resolution
[root@zabbix-server01 ~]# vi /etc/hosts
127.0.0.1   localhost localhost.localdomain localhost4 localhost4.localdomain4
::1         localhost localhost.localdomain localhost6 localhost6.localdomain6
10.30.59.205   zabbix-server01
10.30.59.215   zabbix-agent
Auto discovery configuration
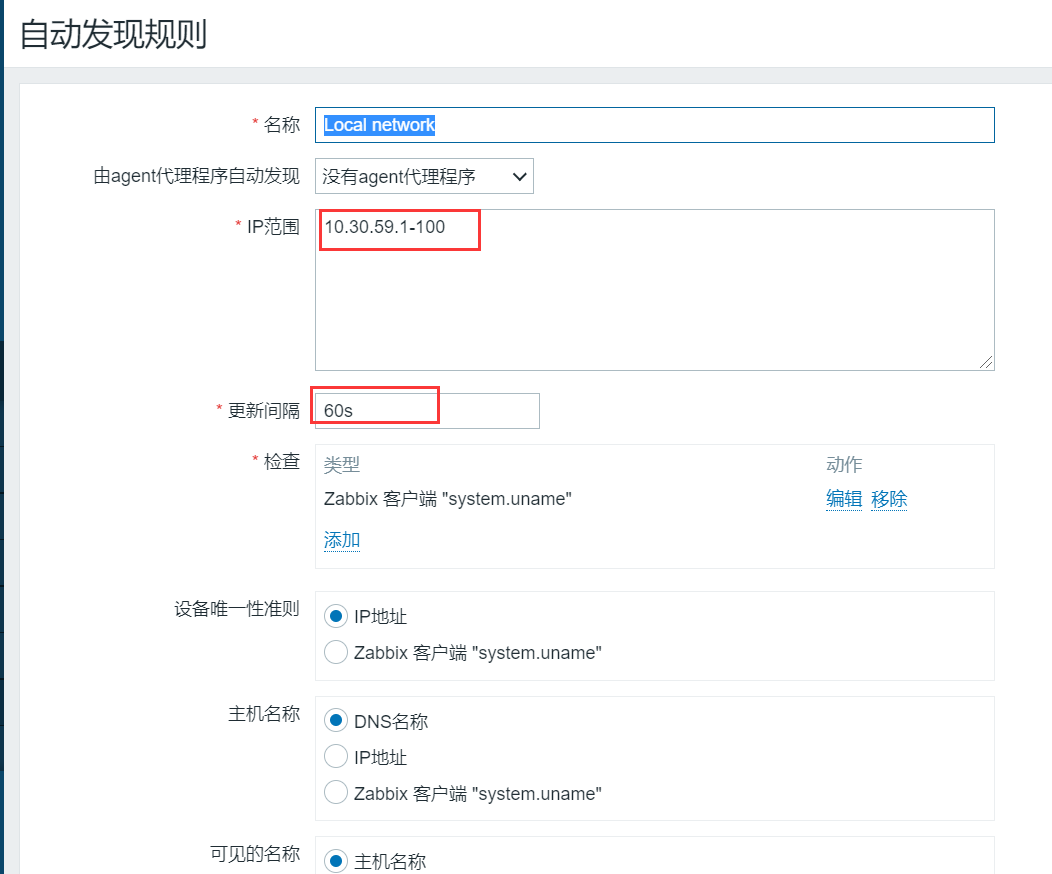
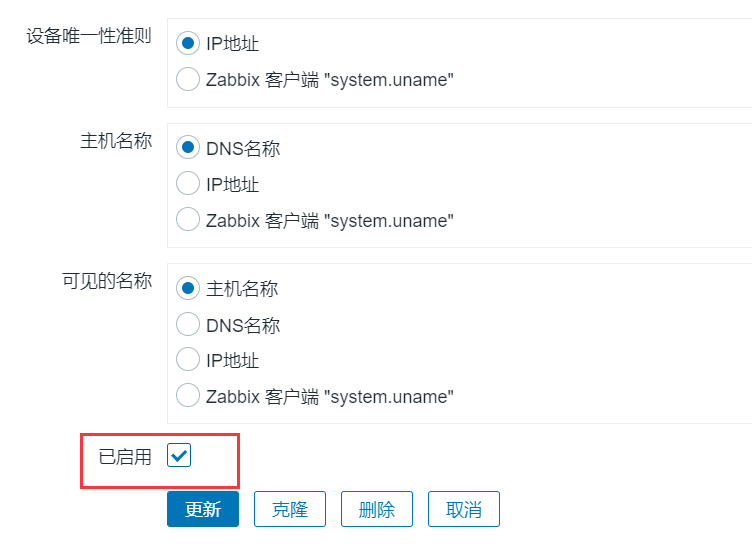
Configure ----- auto discovery ----- Local network

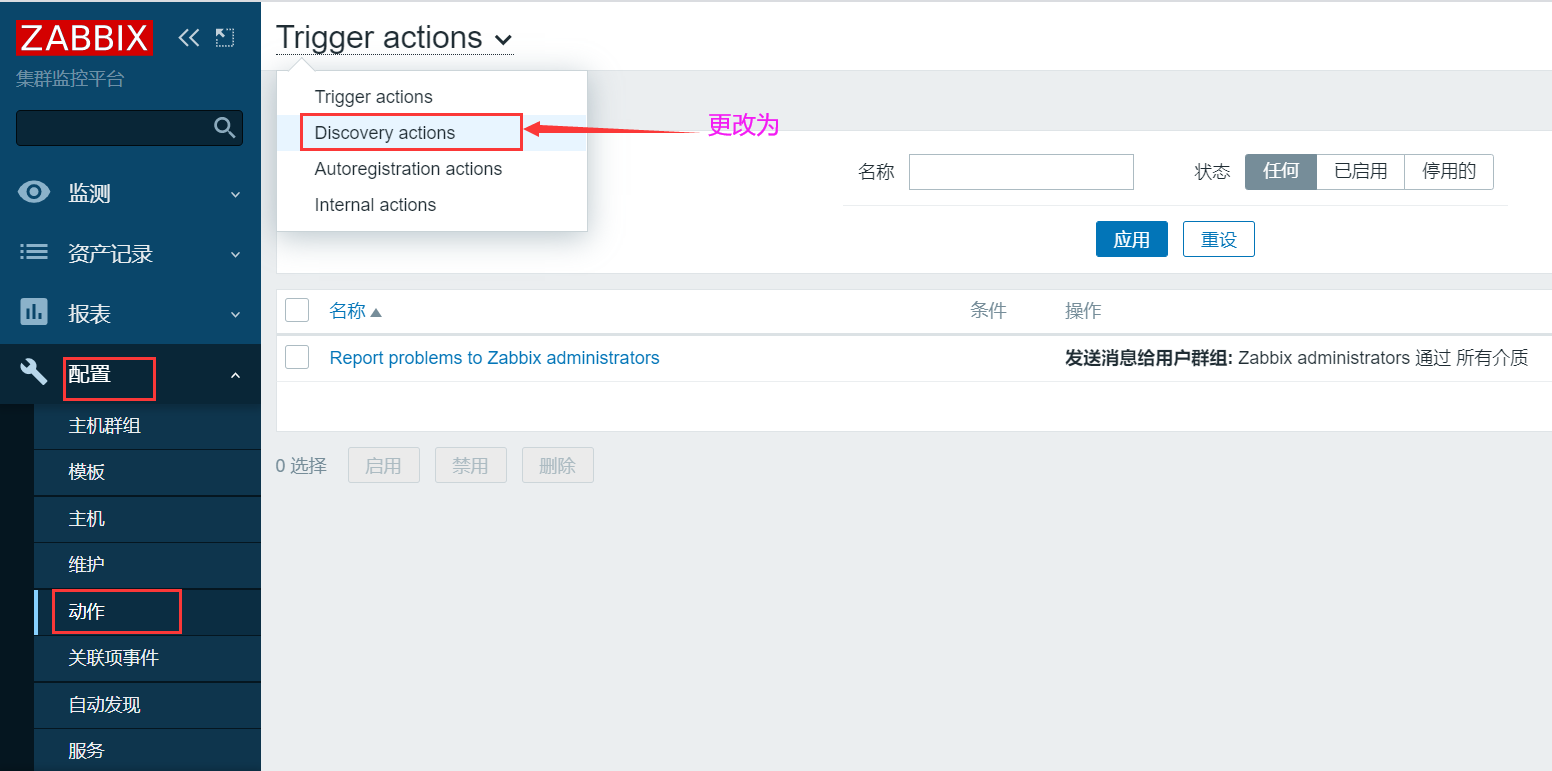
Configuration - actions - Discovery actions
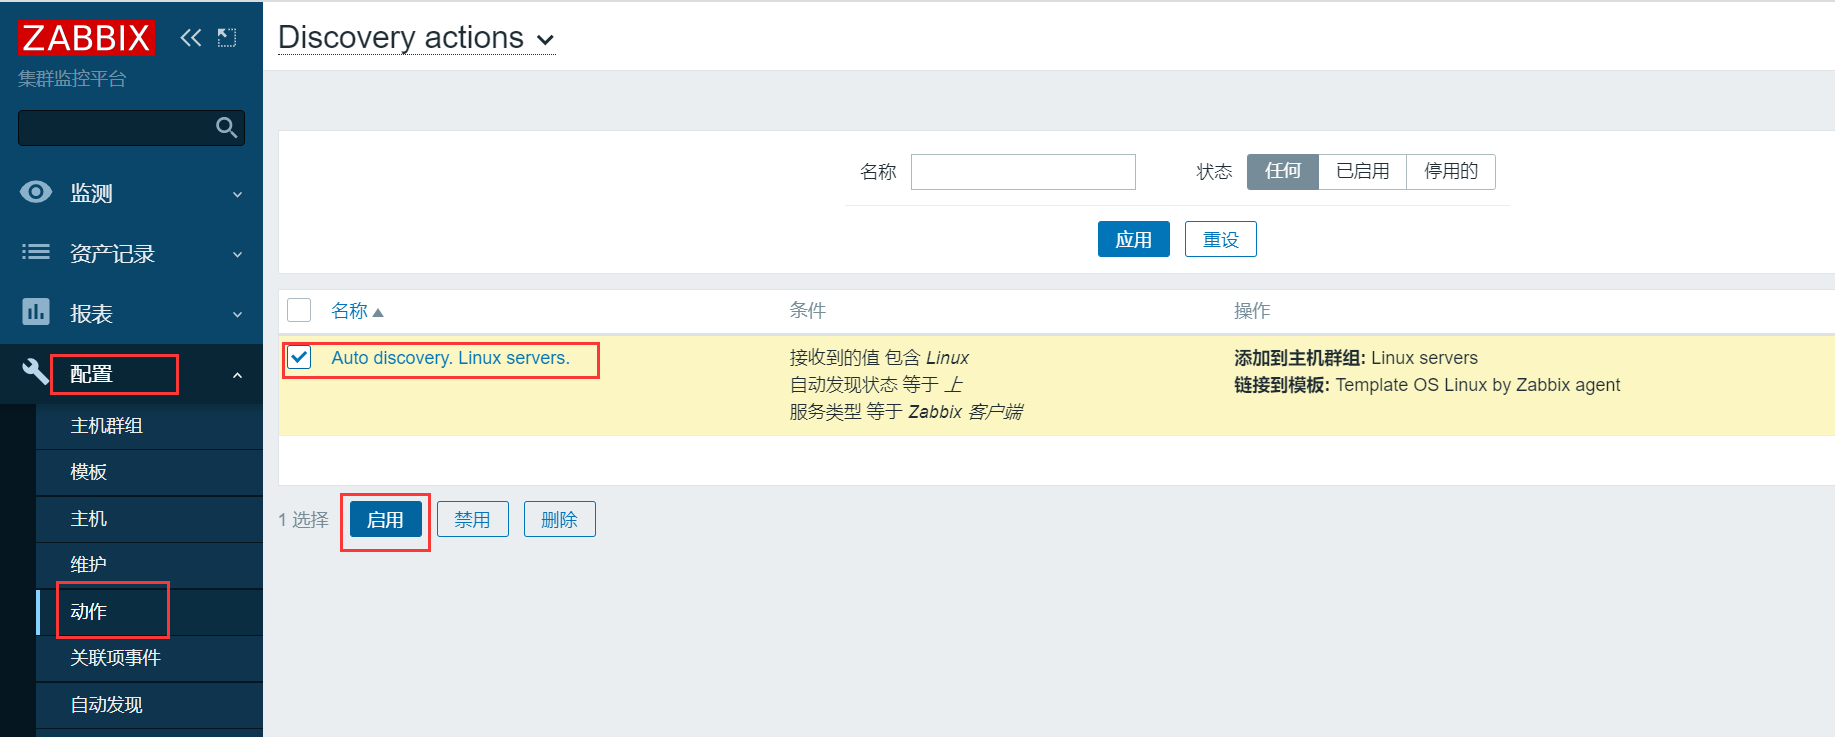
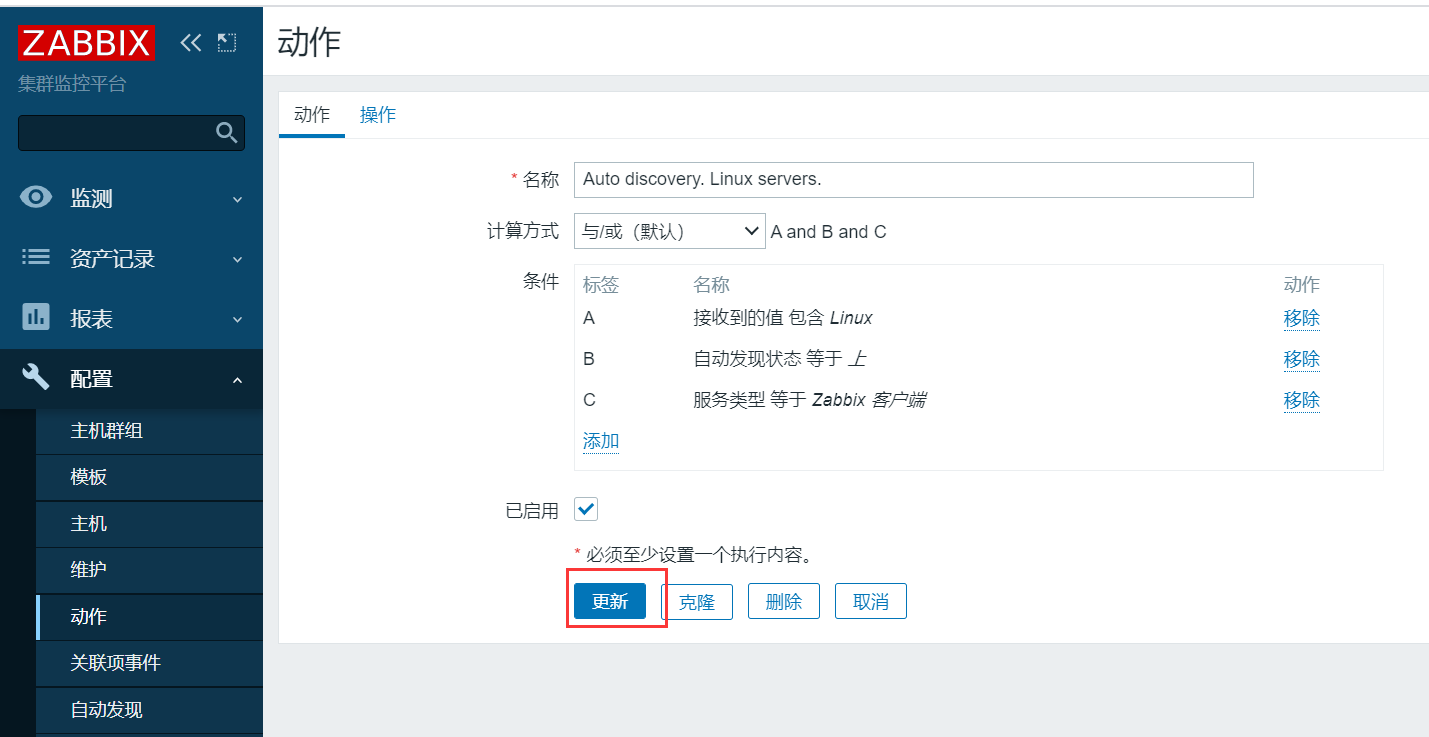
Click auto discovery Linux servers - default update
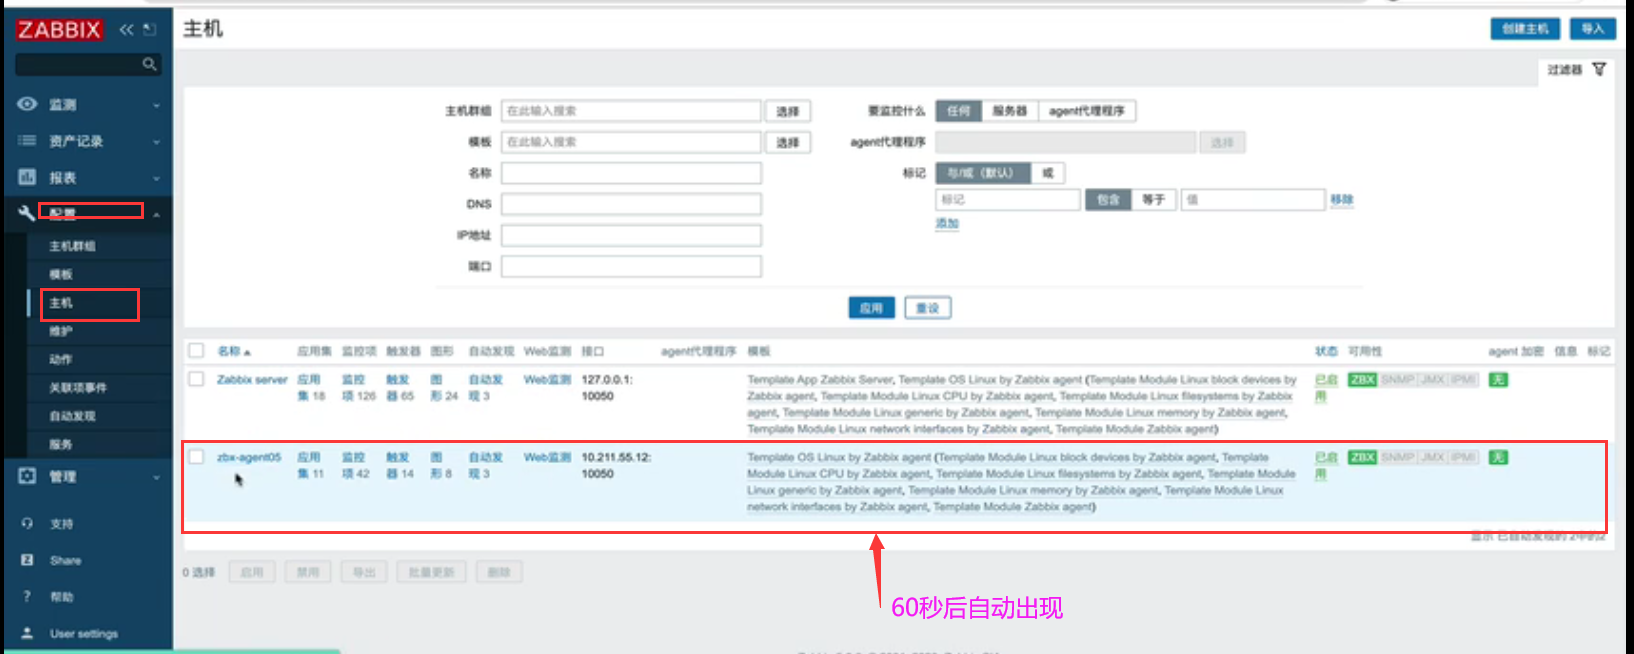
Configuration - Host - wait 60 seconds
Check (auto discovery - action - host appears)
view log file
[root@zabbix-server01 ~]# tail -f /var/log/zabbix/zabbix_server.log
Automatic registration, active mode
1. Prepare two machines
zabbix-server01
zabbix-agent
Configuration ---- autodiscover disable ---- host --------- (client) disable / delete
Configure agent2 file
[root@zabbix-agent ~]# vi /etc/zabbix/zabbix_agent2.conf
Remove comments
HostnameItem=system.hostname
[root@zabbix-agent ~]# grep -Ev '^#|^$' /etc/zabbix/zabbix_agent2.conf filter
PidFile=/var/run/zabbix/zabbix_agent2.pid
LogFile=/var/log/zabbix/zabbix_agent2.log
LogFileSize=0
Server=10.30.59.205
ListenPort=10050
ServerActive=10.30.59.205     #Write server address
Hostname=zabbix-agent
  HostnameItem=system.hostname
Include=/etc/zabbix/zabbix_agent2.d/*.conf
ControlSocket=/tmp/agent.sock
[root@zabbix-agent ~]# systemctl restart zabbix-agent2 restart
Verify whether agent2 is connected
[root@zabbix-server01 ~]# zabbix_get -s '10.30.59.215' -p 10050 -k 'agent.ping'
1
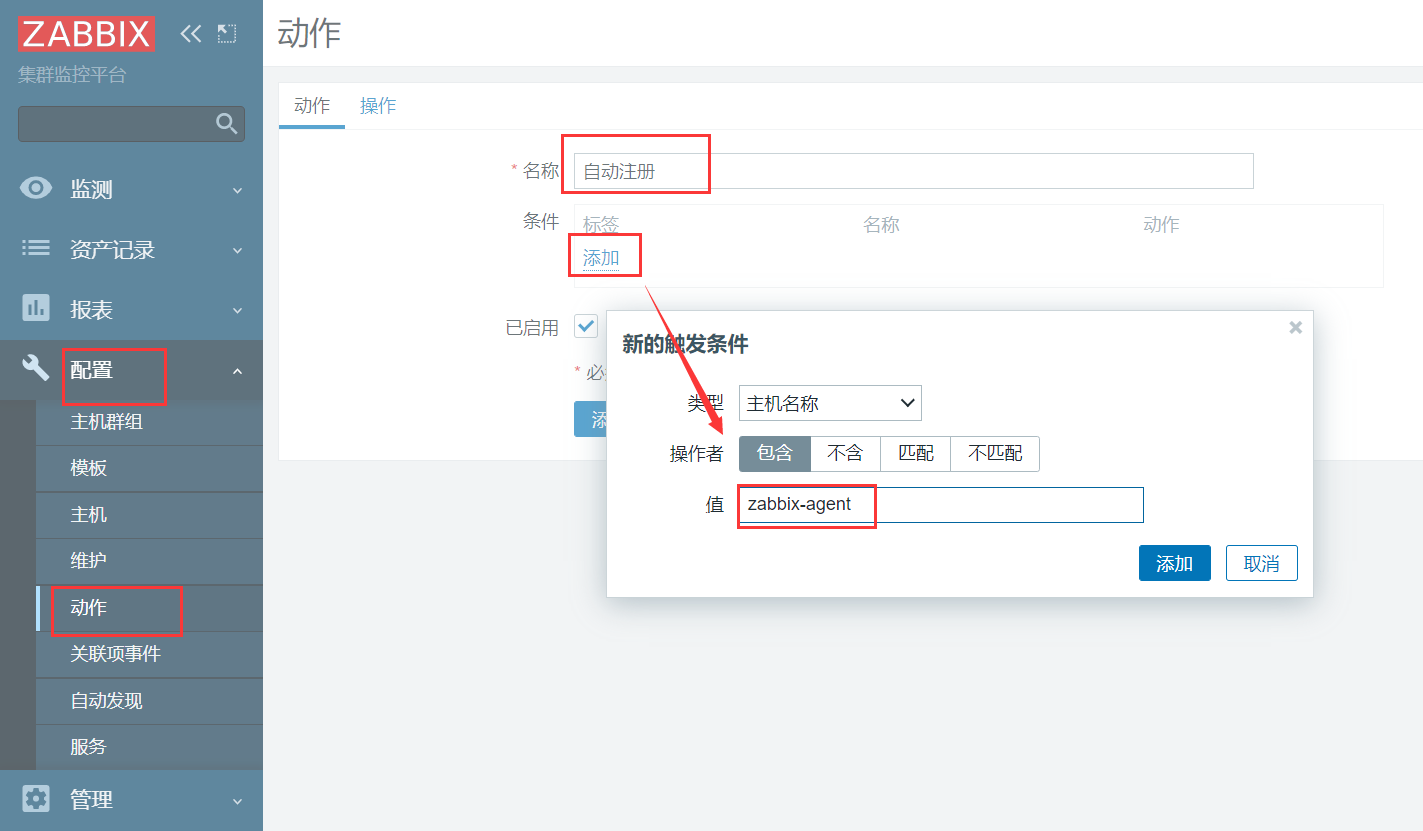
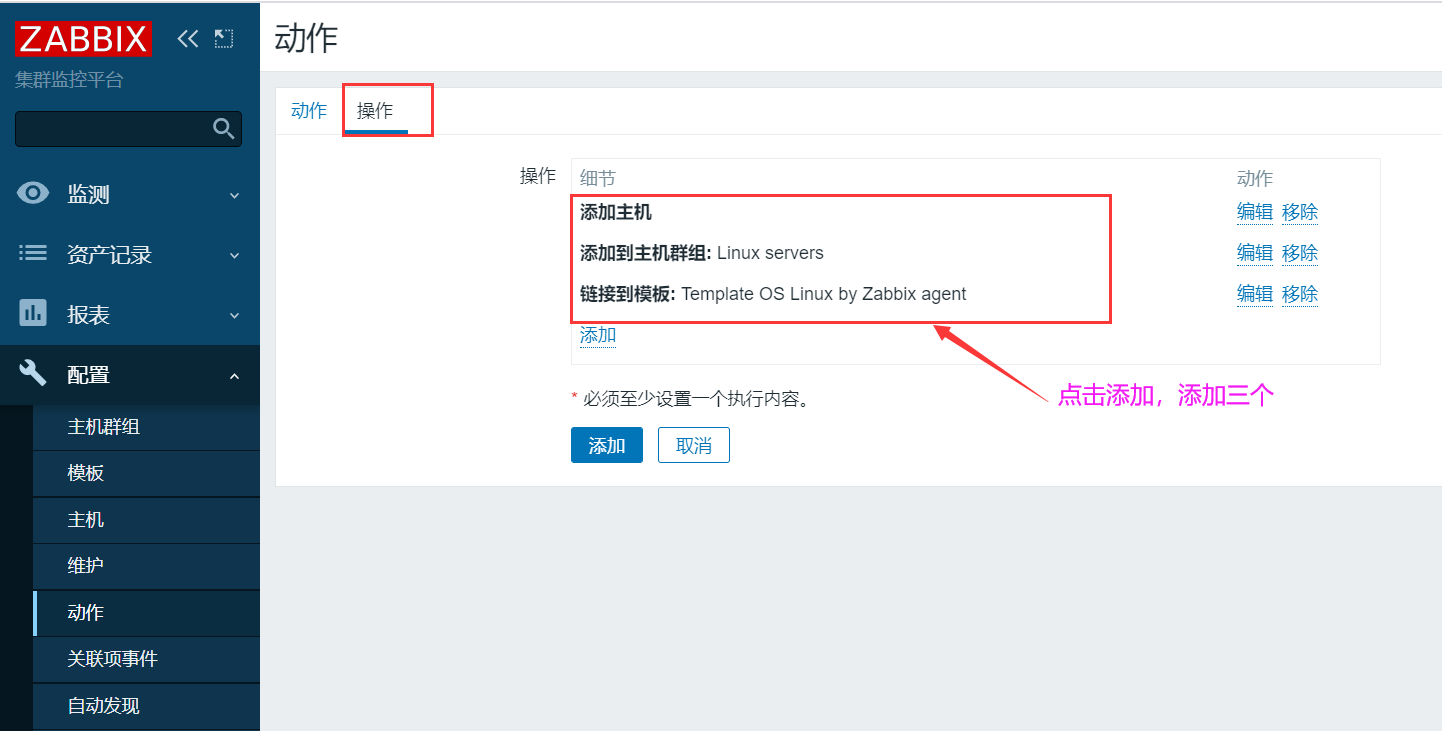
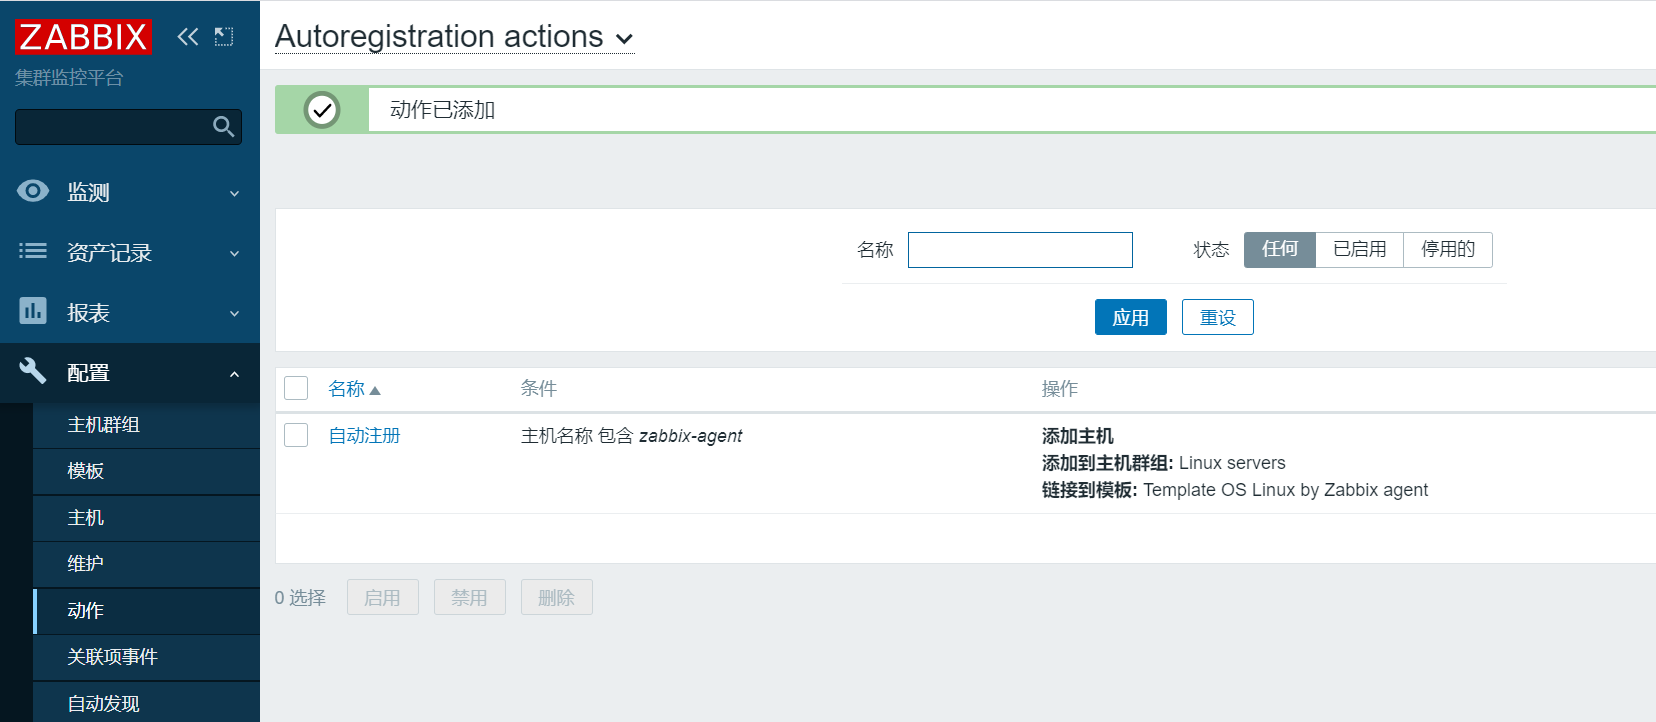
Configuration - actions - Autoregistration actions - create actions
You can ping the client
[root@zabbix-server01 ~]# ping zabbix-agent
PING zabbix-agent (10.30.59.215) 56(84) bytes of data.
64 bytes from zabbix-agent (10.30.59.215): icmp_seq=1 ttl=64 time=0.253 ms
64 bytes from zabbix-agent (10.30.59.215): icmp_seq=2 ttl=64 time=0.265 ms
view log file
[root@zabbix-server01 ~]# tail -f /var/log/zabbix/zabbix_server.log
28117:20210629:090407.388 enabling Zabbix agent checks on host "zabbix-agent": host became available