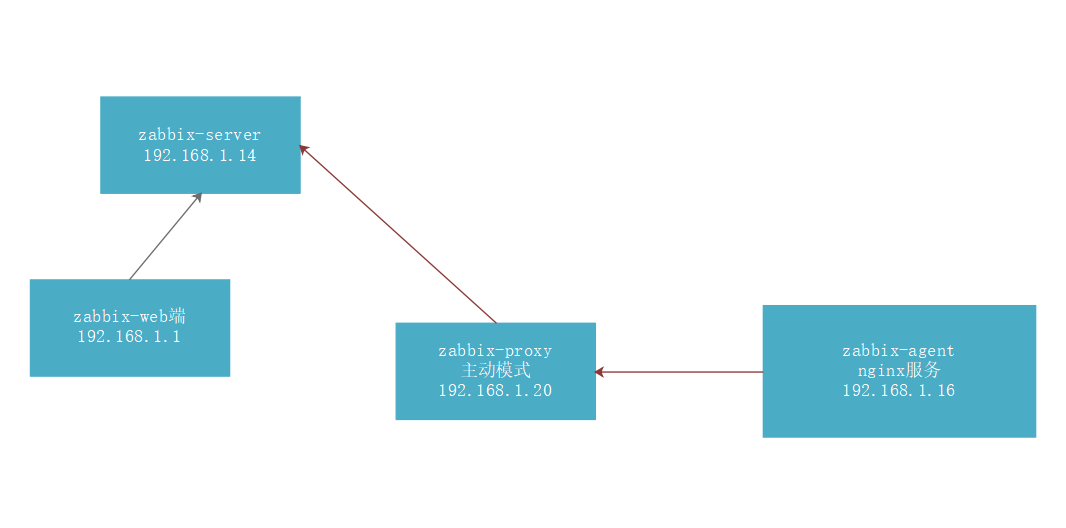
1.zabbix-server (ubuntu1804)
1) Necessary packages
zabbix-server-mysql
zabbix-frontend-php
2) Start-up services
State                    Recv-Q                    Send-Q                             Local Address:Port                               Peer Address:Port
LISTEN                   0                           128                                       0.0.0.0:10051                                     0.0.0.0:*
users:(("zabbix_server",pid=3991,fd=4),("zabbix_server",pid=3990,fd=4),("zabbix_server",pid=3989,fd=4)......
......
LISTEN                   0                           80                                          192.168.1.14:3306                              0.0.0.0:*
    users:(("mysqld",pid=1461,fd=20))
......
LISTEN                   0                         128                                           *:80                                                    *:*
 users:(("apache2",pid=4105,fd=4),("apache2",pid=4100,fd=4),("apache2",pid=4091,fd=4),("apache2",pid=3904,fd=4),
("apache2",pid=3900,fd=4),("apache2",pid=3801,fd=4),("apache2",pid=3576,fd=4),("apache2",pid=3501,fd=4),("apache2",
pid=3404,fd=4),("apache2",pid=1620,fd=4),("apache2",pid=1587,fd=4))
......
3) Create authorization database of proxy proxy proxy
MariaDB [(none)]> create database zabbix_proxy_active character set utf8 collate utf8_bin;
MariaDB [(none)]> grant all privileges on zabbix_proxy_active.* to zabbix_proxy_active@192.168.1.20 identified by 'zabbix_proxy_active';
2.zabbix-proxy proxy server (ubuntu1804)
1) Necessary packages
zabbix-proxy-mysql
2) Configure proxy configuration file
root@ubuntu1804:/etc/zabbix# grep '^[a-Z]' /etc/zabbix/zabbix_proxy.conf
ProxyMode=0  #Active mode
Server=192.168.1.14
Hostname=zabbix_proxy_active
LogFile=/var/log/zabbix/zabbix_proxy.log
LogFileSize=0
EnableRemoteCommands=1 #Open Allow Remote Command
LogRemoteCommands=1
PidFile=/var/run/zabbix/zabbix_proxy.pid
SocketDir=/var/run/zabbix
DBHost=192.168.1.14
DBName=zabbix_proxy_active
DBUser=zabbix_proxy_active
DBPassword=zabbix_proxy_active
SNMPTrapperFile=/var/log/snmptrap/snmptrap.log
Timeout=30
ExternalScripts=/usr/lib/zabbix/externalscripts
FpingLocation=/usr/bin/fping
Fping6Location=/usr/bin/fping6
LogSlowQueries=3000
3) Testing whether to log in to the database
root@ubuntu1804:~# mysql -uzabbix_proxy_active -pzabbix_proxy_active -h192.168.1.14
Welcome to the MariaDB monitor.  Commands end with ; or \g.
Your MariaDB connection id is 6951
Server version: 10.1.40-MariaDB-0ubuntu0.18.04.1 Ubuntu 18.04

Copyright (c) 2000, 2018, Oracle, MariaDB Corporation Ab and others.

Type 'help;' or '\h' for help. Type '\c' to clear the current input statement.

MariaDB [(none)]> show databases;
+---------------------+
| Database            |
+---------------------+
| information_schema  |
| zabbix_proxy_active |
+---------------------+
2 rows in set (0.00 sec)
4) database initialization
zcat /usr/share/doc/zabbix-proxy-mysql/schema.sql.gz | mysql -uzabbix_proxy_active -pzabbix_proxy_active
-h192.168.1.14 zabbix_proxy_active
5) Start up services
root@ubuntu1804:~# systemctl restart zabbix-proxy
root@ubuntu1804:~# systemctl enable zabbix-proxy
6) View Startup Services
root@ubuntu1804:~# ss -tnlp
State                    Recv-Q                    Send-Q                                        Local Address:Port                                        Peer Address:Port
LISTEN                   0                         128                                                 0.0.0.0:10051                                            0.0.0.0:*
 users:(("zabbix_proxy",pid=3559,fd=4),("zabbix_proxy",pid=3558,fd=4),("zabbix_proxy",pid=3557,fd=4),("zabbix_proxy",pid=3556,fd=4),("zabbix_proxy",pid=3555,fd=4),("zabbix_proxy",pid=3554,fd=4),("zabbix_proxy",pid=3553,fd=4),("zabbix_proxy",pid=3552,fd=4),("zabbix_proxy",pid=3551,fd=4),("zabbix_proxy",pid=3550,fd=4),("zabbix_proxy",pid=3549,fd=4),("zabbix_proxy",pid=3548,fd=4),("zabbix_proxy",pid=3547,fd=4),("zabbix_proxy",pid=3546,fd=4),("zabbix_proxy",pid=3545,fd=4),("zabbix_proxy",pid=3544,fd=4),("zabbix_proxy",pid=3543,fd=4),("zabbix_proxy",pid=3542,fd=4),("zabbix_proxy",pid=3541,fd=4),("zabbix_proxy",pid=3540,fd=4),("zabbix_proxy",pid=3539,fd=4),("zabbix_proxy",pid=3538,fd=4),("zabbix_proxy",pid=3537,fd=4),("zabbix_proxy",pid=3536,fd=4),("zabbix_proxy",pid=3525,fd=4))
LISTEN                   0                         80                                                  0.0.0.0:3306                                             0.0.0.0:*
 users:(("mysqld",pid=4094,fd=17))
......
3.zabbix-agent client (centos 7.6)
1) Install necessary packages
zabbix-agent
nginx
2) Configuration agent configuration file
[root@nginx zabbix_agentd.d]# grep '^[a-Z]' /etc/zabbix/zabbix_agentd.conf
EnableRemoteCommands=1  #Be sure to turn it on, or you will not be able to execute remote commands
Server=192.168.1.14,192.168.1.20  #Specify both server and proxy proxies
ServerActive=192.168.1.20  #Proxy proxy proxy side specifying active mode
Hostname=192.168.1.16  #Specify a host name to the local computer. The host name added to the web must be the same as the host name here. Otherwise, the data acquisition will fail.
Timeout=30
Include=/etc/zabbix/zabbix_agentd.d/*.conf
UnsafeUserParameters=1  #Special characters that support remote command transmission must also be turned on
3) Start the two services of agent and nginx
[root@nginx ~]# systemctl restart zabbix-agent
[root@nginx ~]# systemctl enable zabbix-agent
[root@nginx ~]# systemctl start nginx
[root@nginx ~]# systemctl enable nginx
4) View the Started Services
[root@nginx ~]# ss -tnlp
State       Recv-Q Send-Q                                                  Local Address:Port                                                 Peer Address:Port
LISTEN      0      511                                                                 *:8080                                                                *:*
users:(("nginx",pid=50295,fd=6),("nginx",pid=50294,fd=6),("nginx",pid=50293,fd=6),("nginx",pid=50292,fd=6),
("nginx",pid=50291,fd=6))
LISTEN      0      128                                                                 *:10050                                                               *:*
......
    users:(("zabbix_agentd",pid=43802,fd=4),("zabbix_agentd",pid=43801,fd=4),("zabbix_agentd",pid=43800,fd=4),
("zabbix_agentd",pid=43799,fd=4),("zabbix_agentd",pid=43798,fd=4),("zabbix_agentd",pid=43797,fd=4))
......
5) Promote zabbix users to sudo superusers
[root@nginx ~]# vim /etc/sudoers
#Defaults requiretty #Be sure to comment out this trip, which will cause sudo superusers to be unable to execute remote commands
......
## Allow root to run any commands anywhere
root ALL=(ALL) ALL
zabbix ALL=(ALL) NOPASSWD: ALL
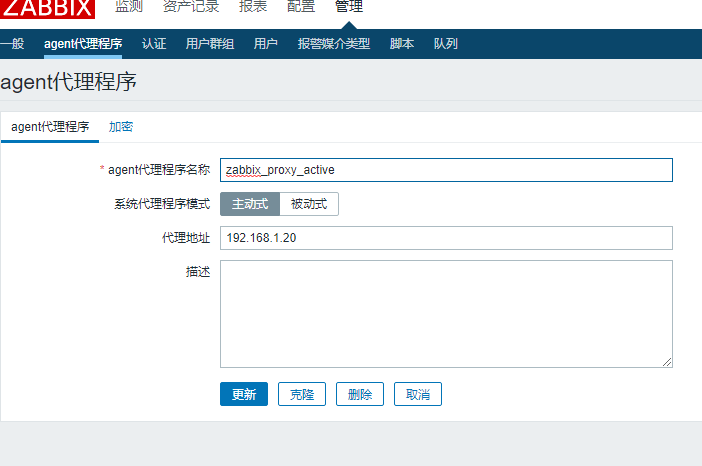
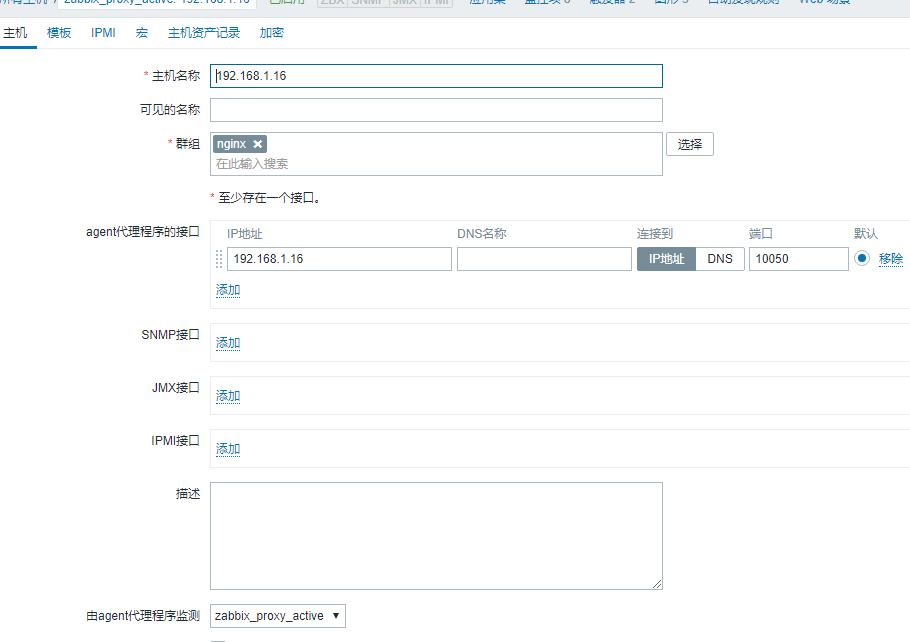
......4.zabbix-server creates an active mode proxy on the web side
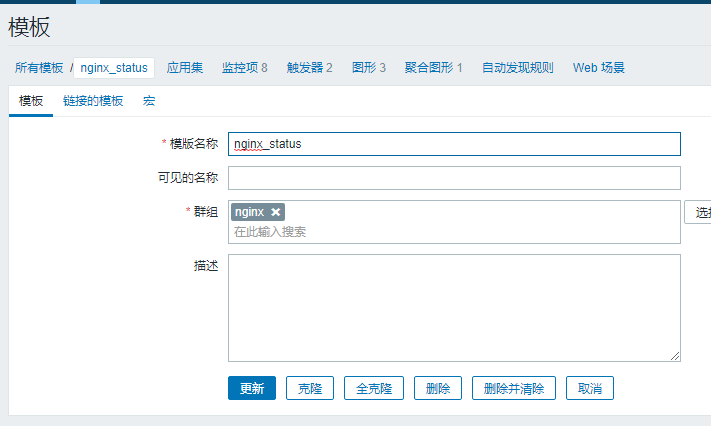
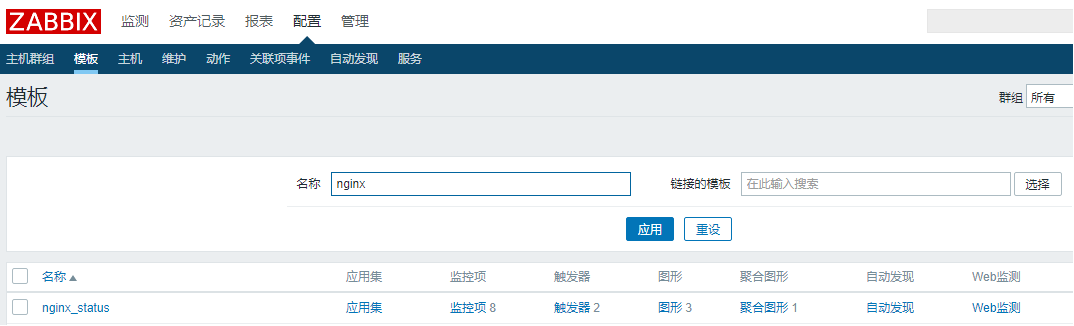
5. Creating nginx template on the web side of zabbix-server
1) nginx_status template creation
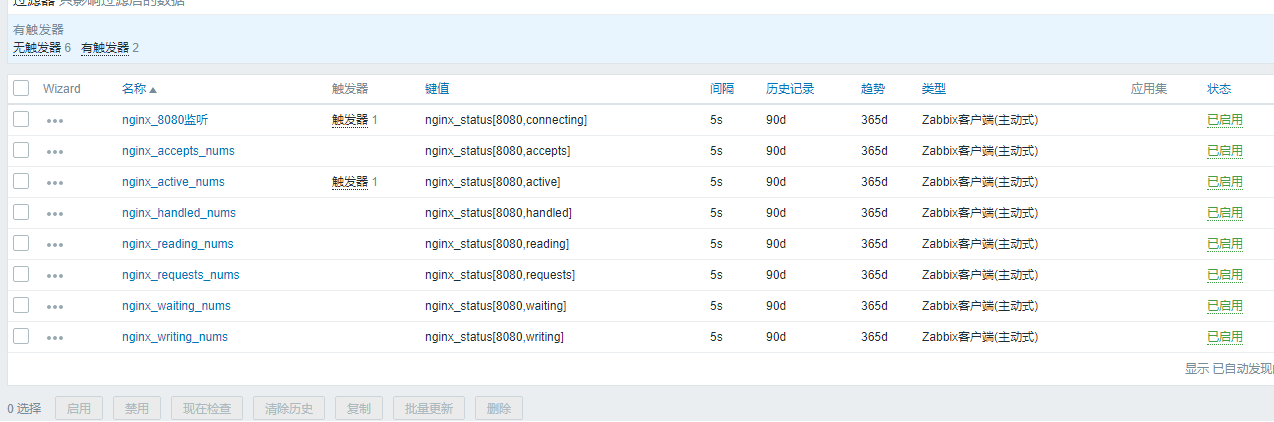
2) Monitoring item creation
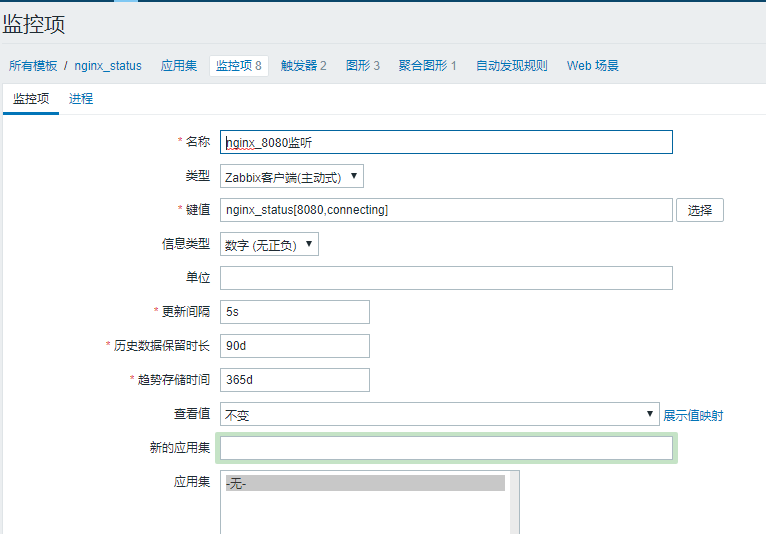
3) Create all nginx monitoring items
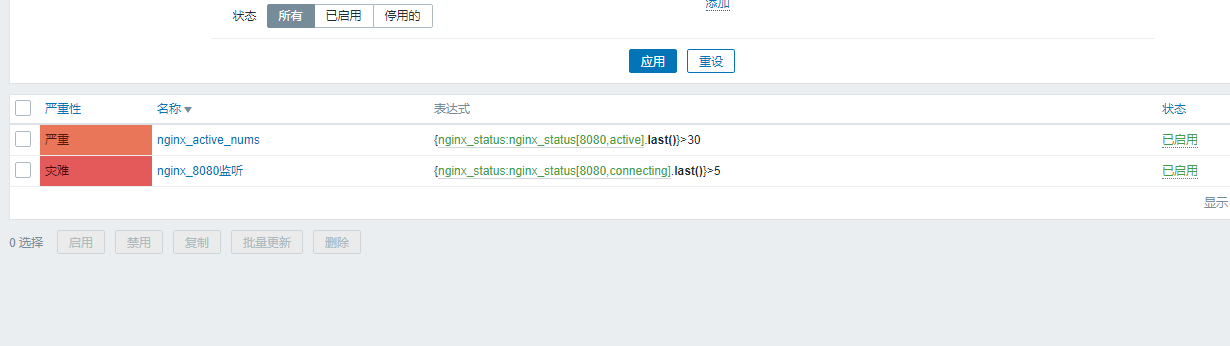
4) Create triggers
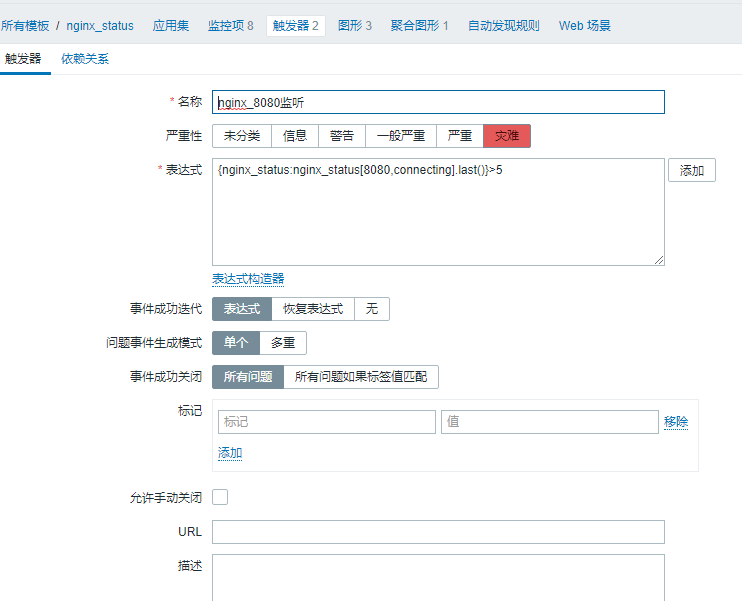
5) Create two nginx triggers
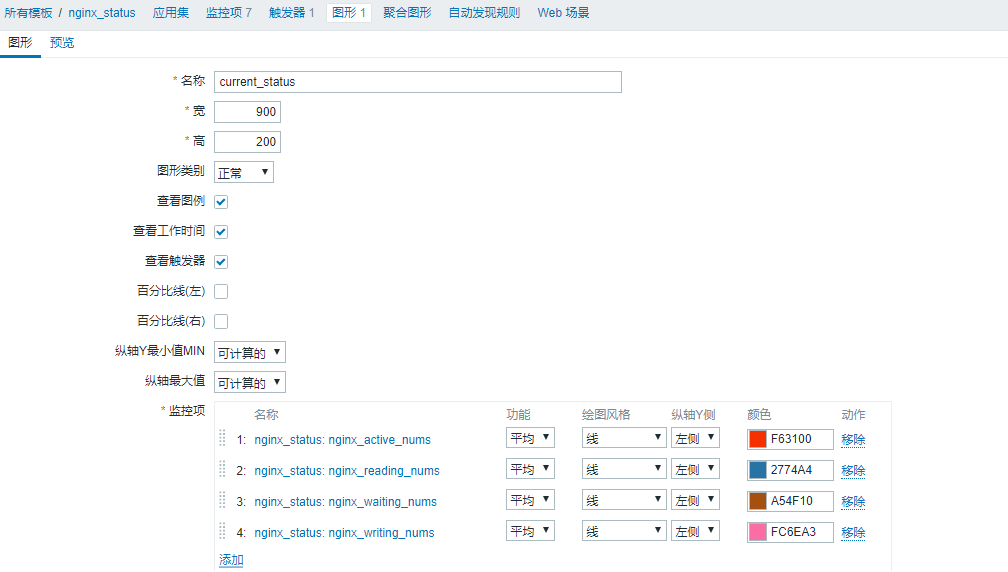
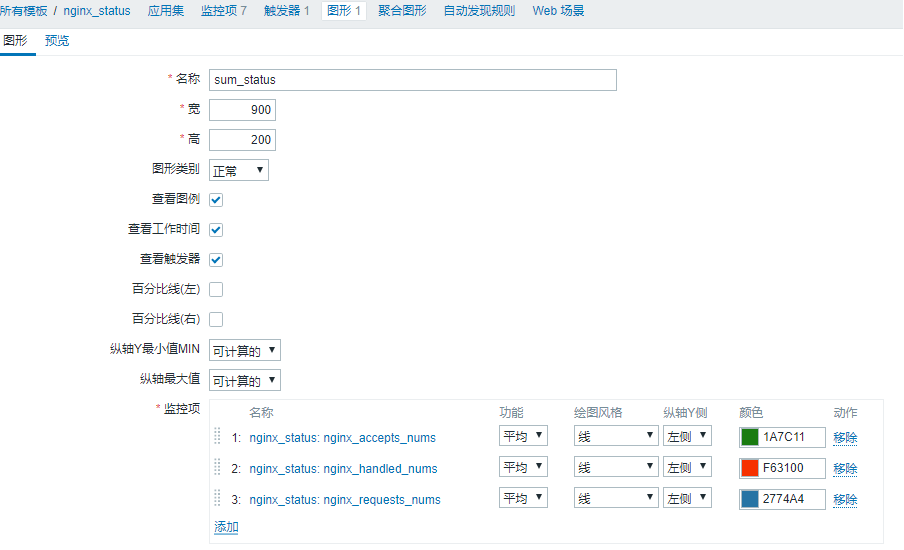
6) Create the current status graph
7) Creating Cumulative State Graphics
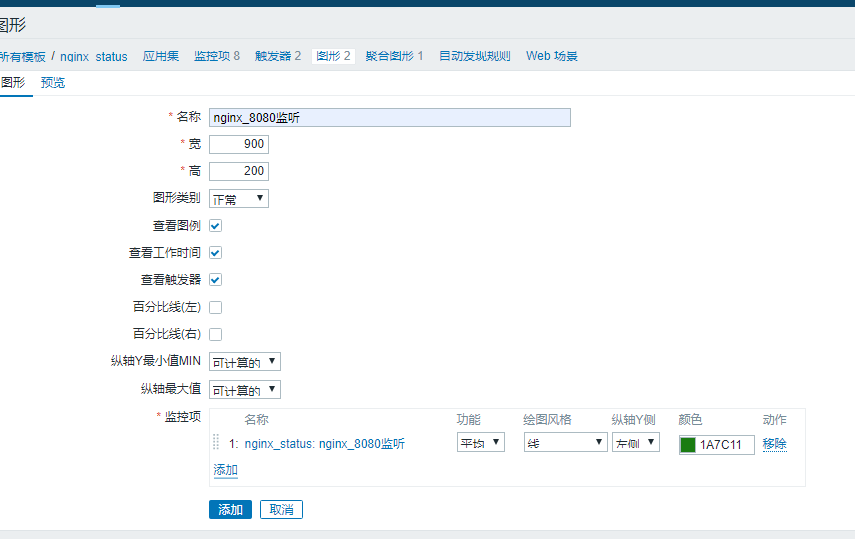
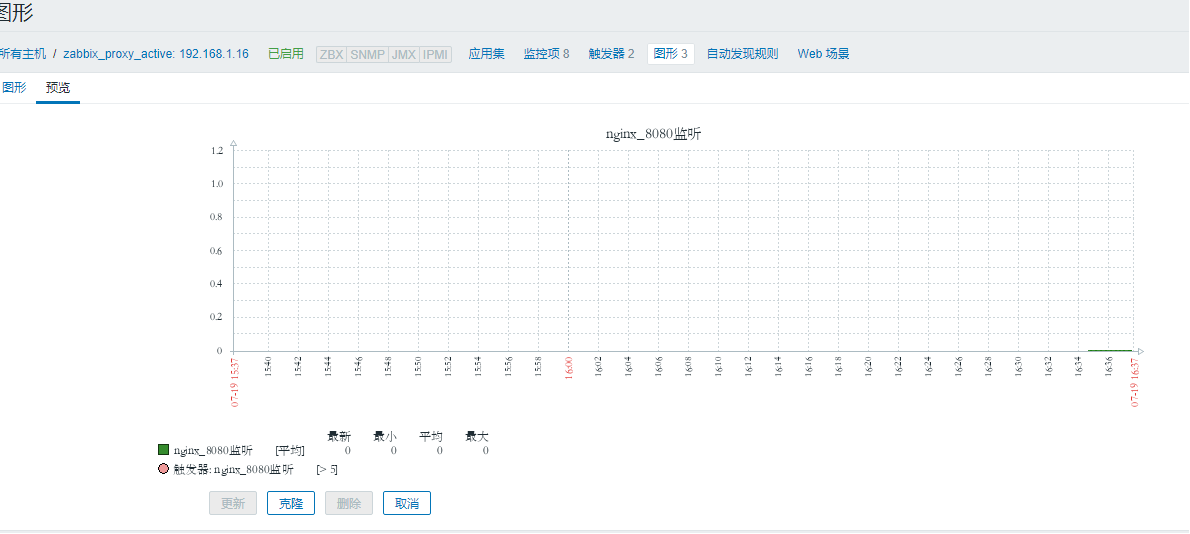
8) Create another nginx listening port status chart
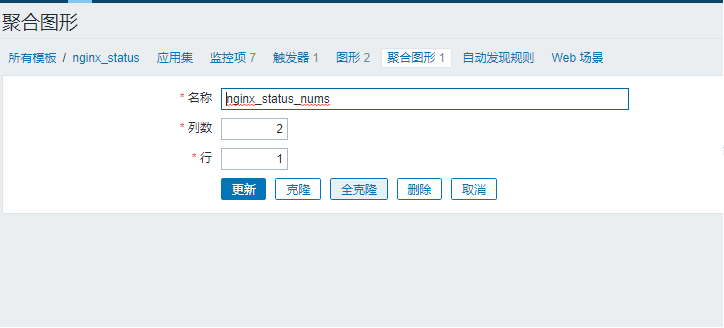
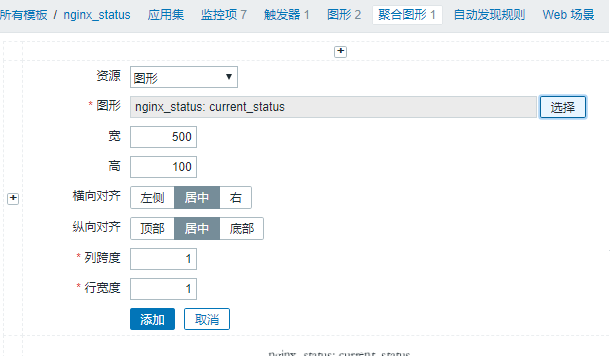
9) Create aggregate graphics
10) Add the previous monitor graphics to the aggregate graphics and click on the constructor
11) Click Change to Enter the Add Interface
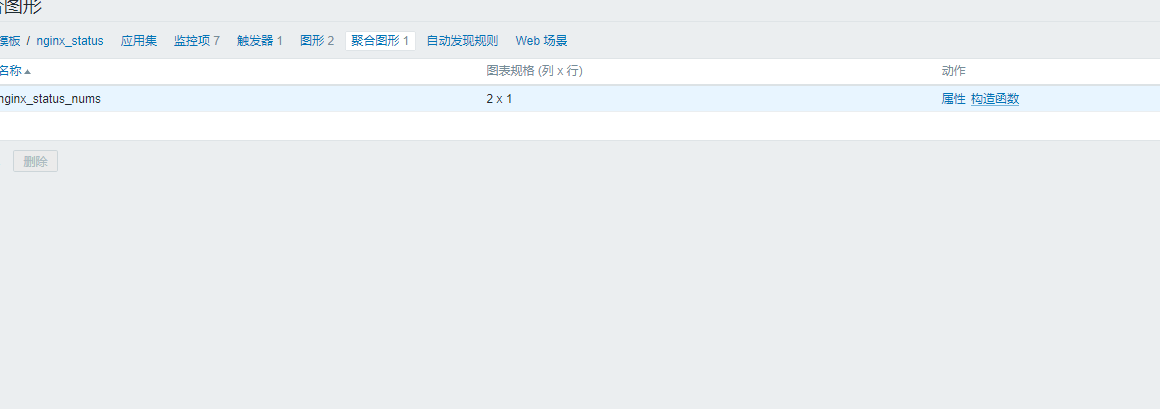
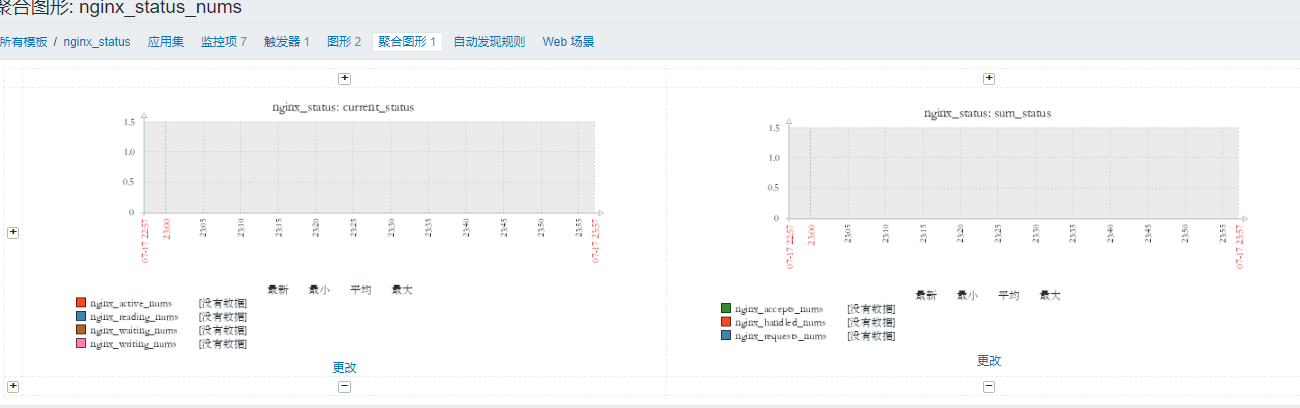
12) You can see that monitoring graphics have been successfully added to aggregate graphics.
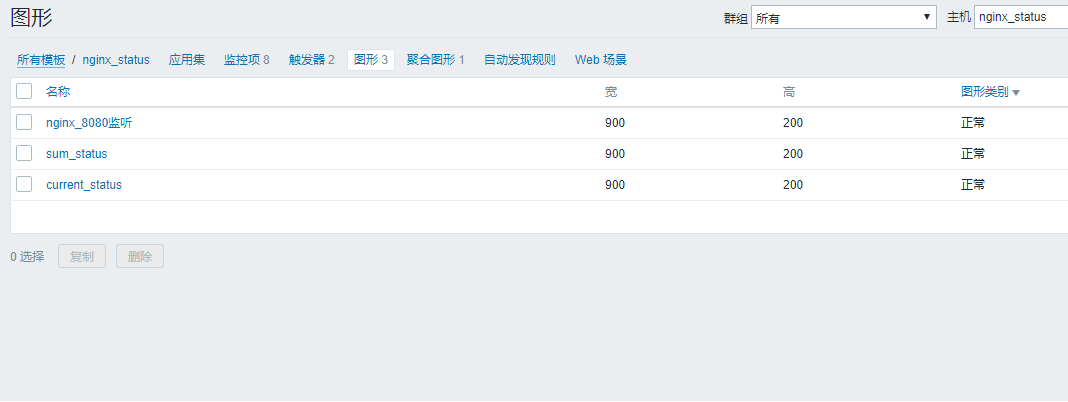
13) View the created graphics
14) nginx_status status status template creation completed
6.zabbix-server Adding Monitoring Host to web End
1) Add monitoring host zabbix-agent and an active mode agent
2) Add a template

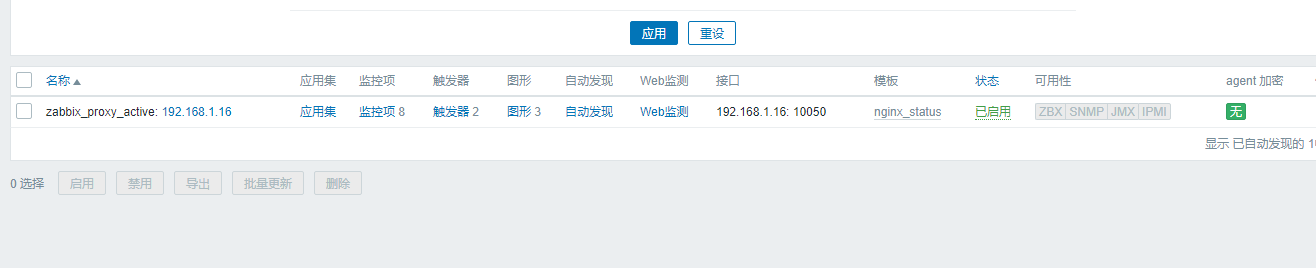
3) Add Completion
7. Viewing data graph of monitoring host zabbix-agent on Web
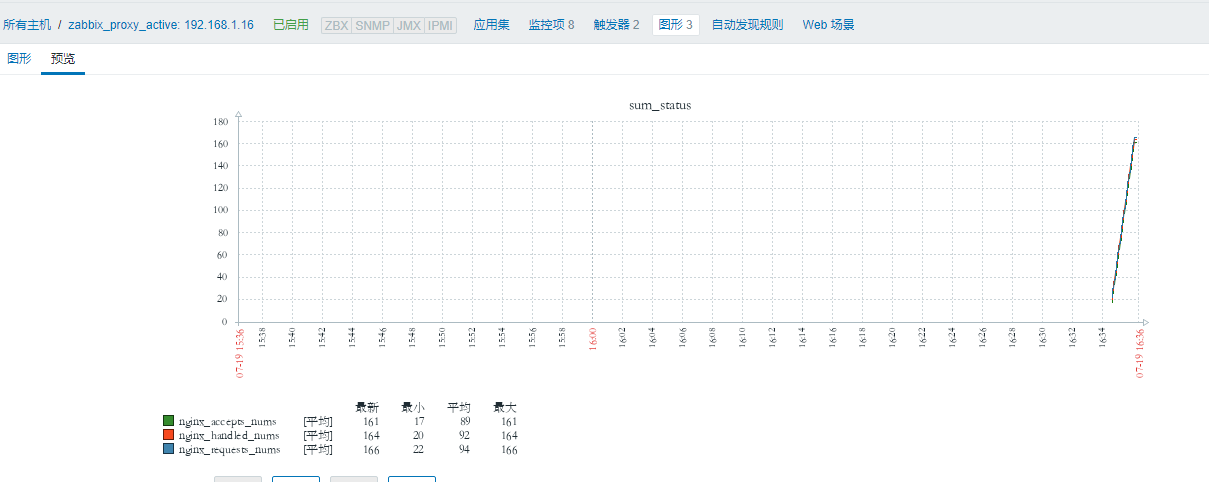
1) nginx status page cumulative state graph
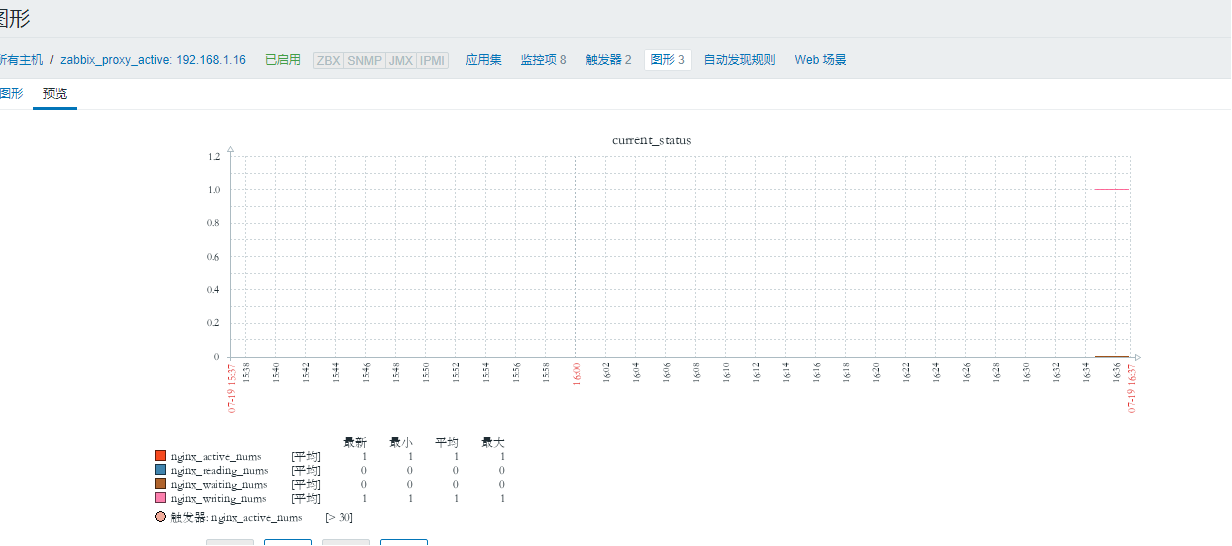
2) nginx status page current status chart
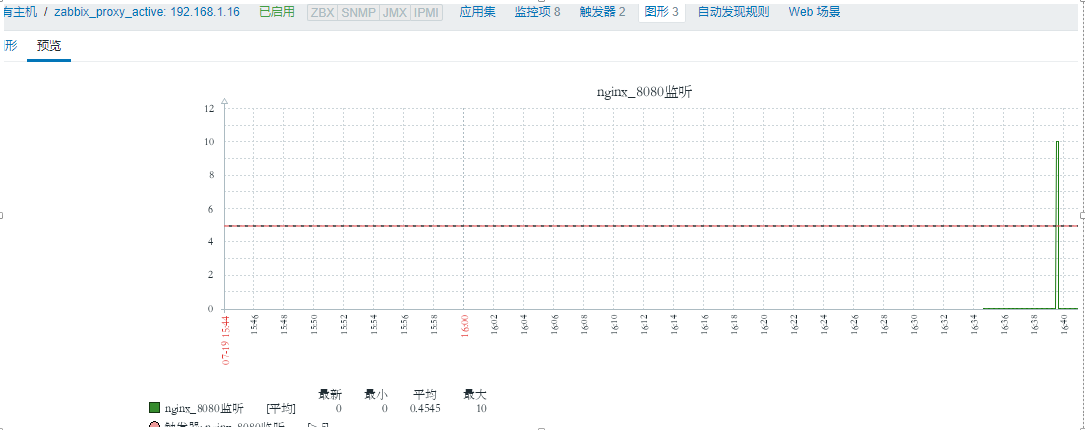
3) View the nginx listening port status chart and display it as normal
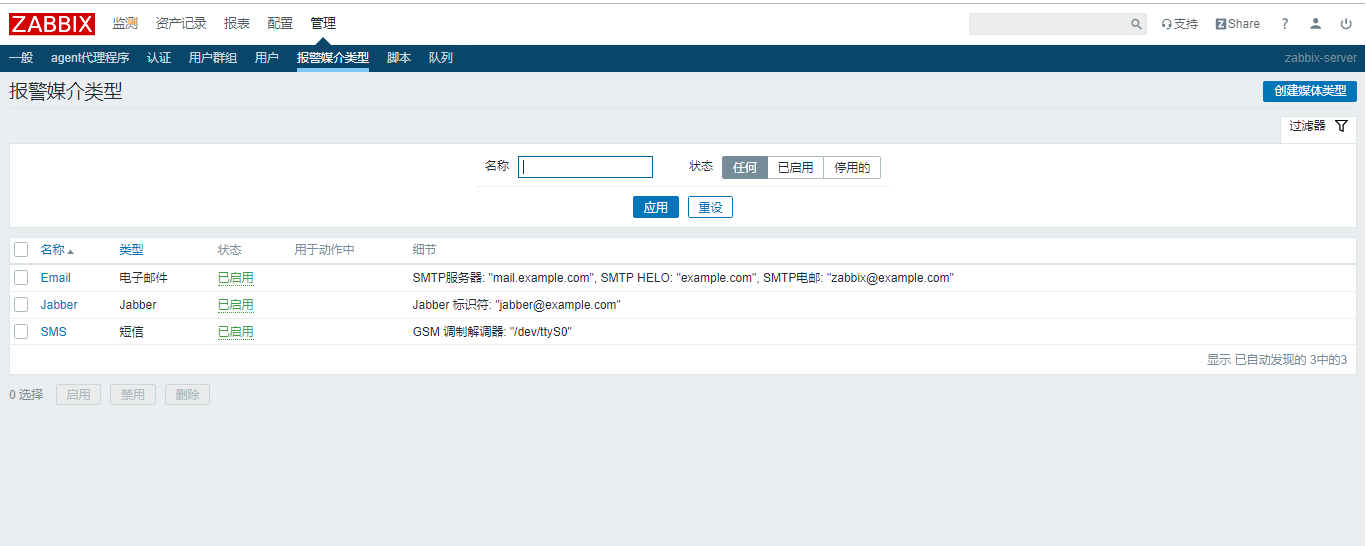
8. Establishing email notification and creating nginx service self-healing action on the web side
1) Click Create Media Type
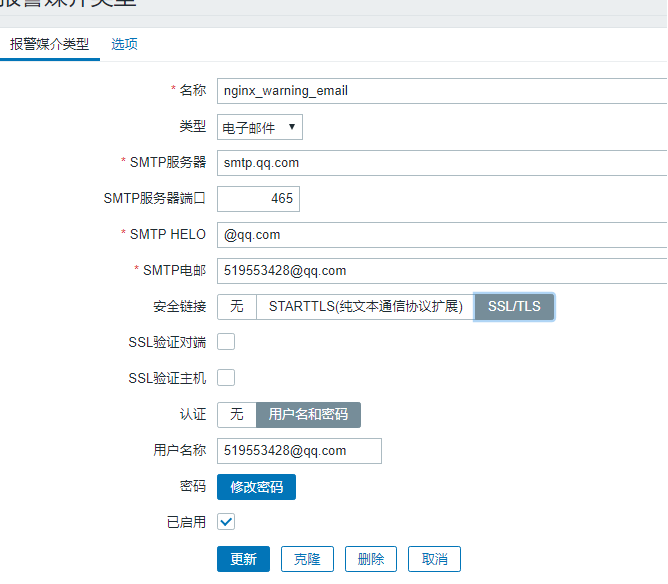
2) Create media type, fill in media type information, and require qq mailbox to pre-open smtp service
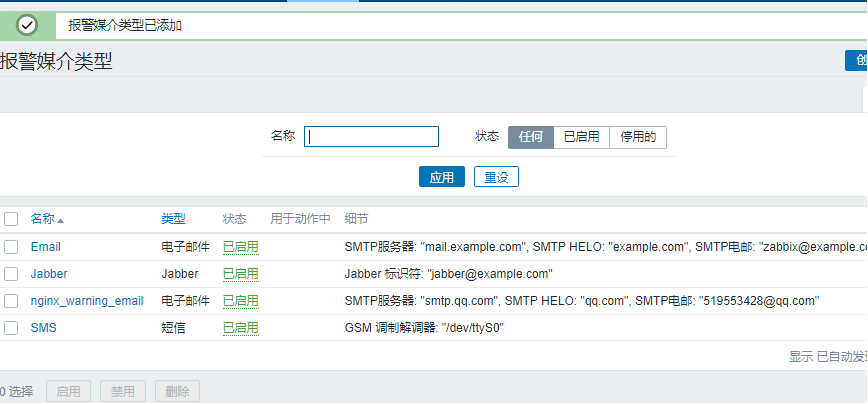
3) You can see that media types have been successfully added
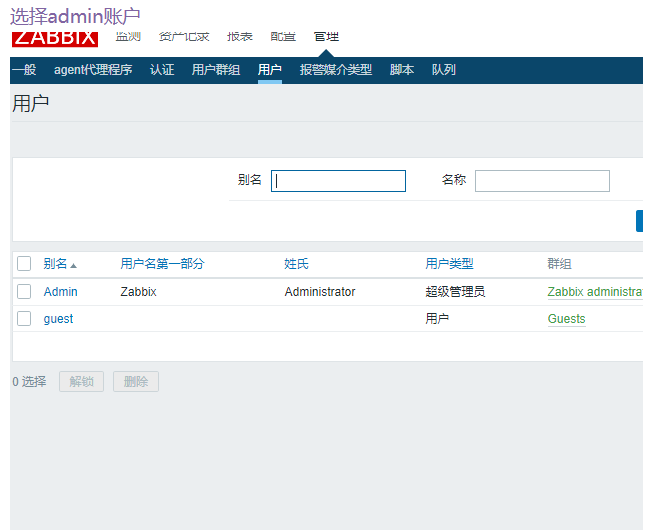
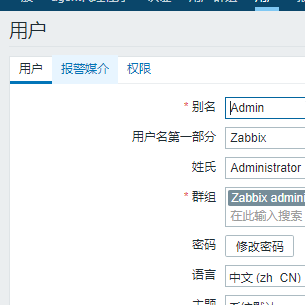
4) Enter the user interface and select admin account
Select admin account
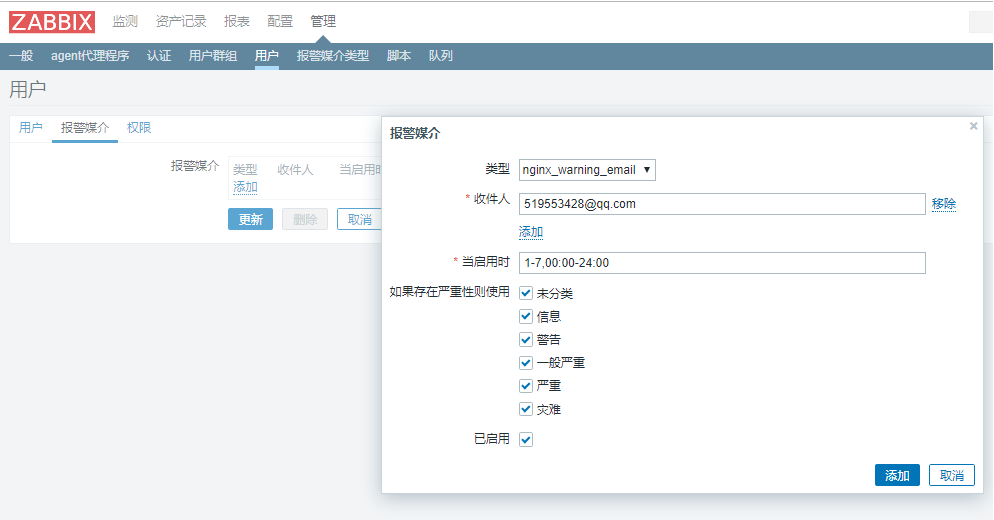
5) Selection of alarm media
6) Add the created media type to this user
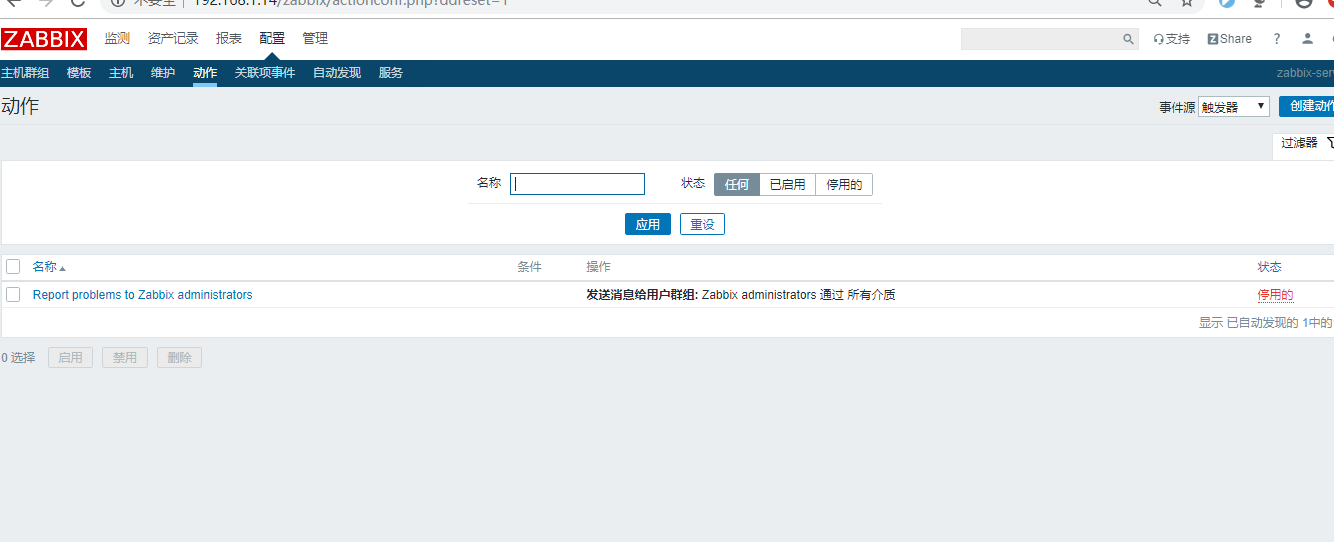
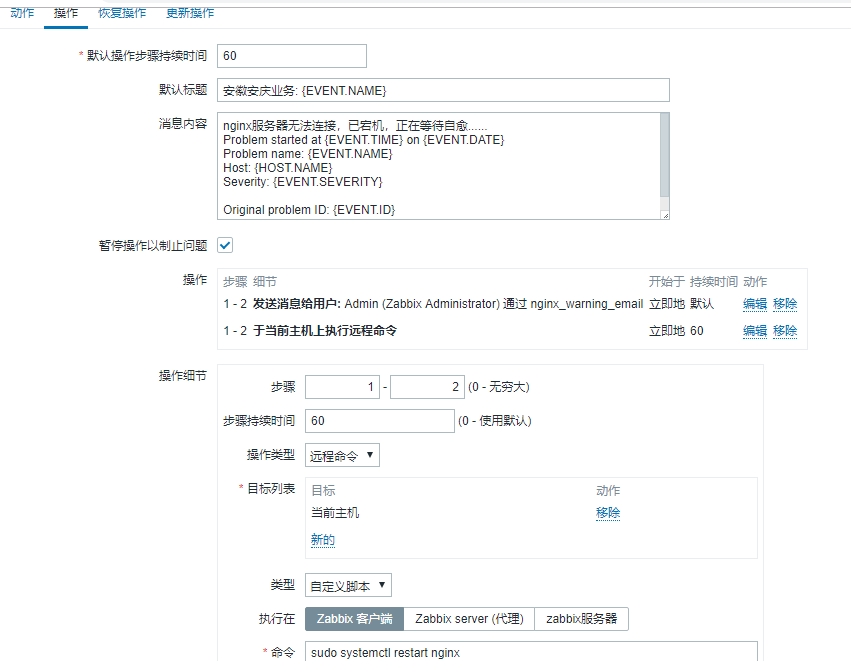
7) Create an action
8) Add trigger condition under action bar

9) Add a remote command to the action bar
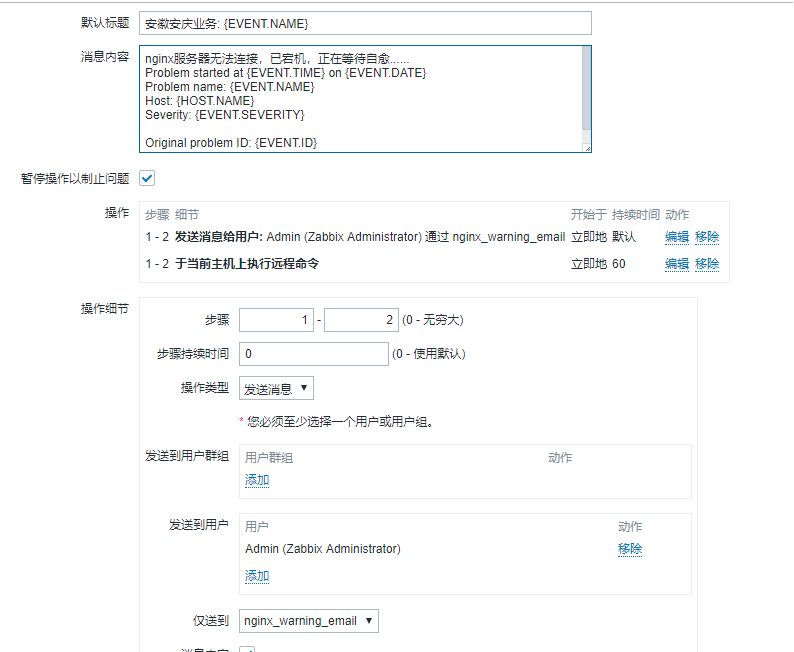
10) Add a downtime notification message to the action bar and specify the recipient of the message.
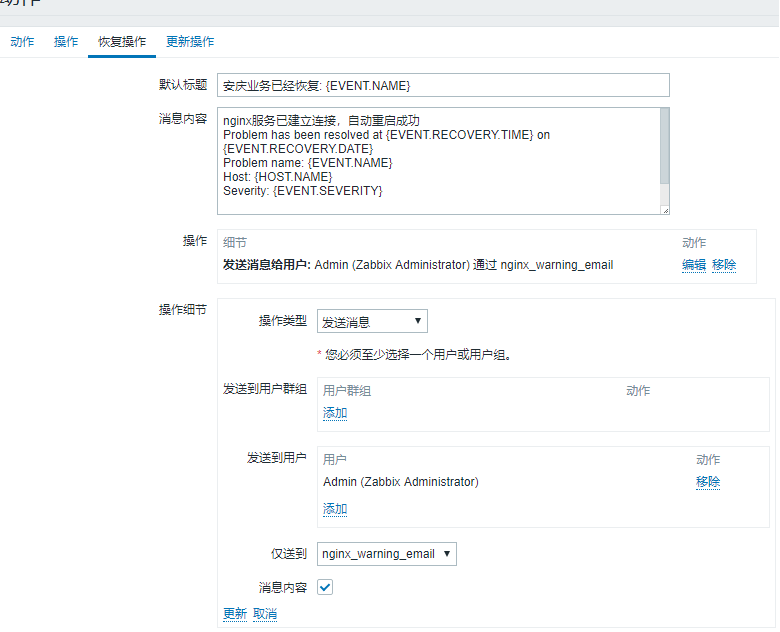
11) Adding recovery messages to the recovery action bar, also specifying the recipient of the message
9. Testing whether nginx service can receive mail notification and realize self-healing function
1) First shut down the nginx service on the zabbix-agent client
[root@nginx zabbix_agentd.d]# systemctl stop nginx
2) zabbix-agent client quickly checks the status of nginx service, the service has been shut down
[root@nginx ~]# systemctl status nginx
● nginx.service - The nginx HTTP and reverse proxy server
Loaded: loaded (/usr/lib/systemd/system/nginx.service; disabled; vendor preset: disabled)
Active: inactive (dead)
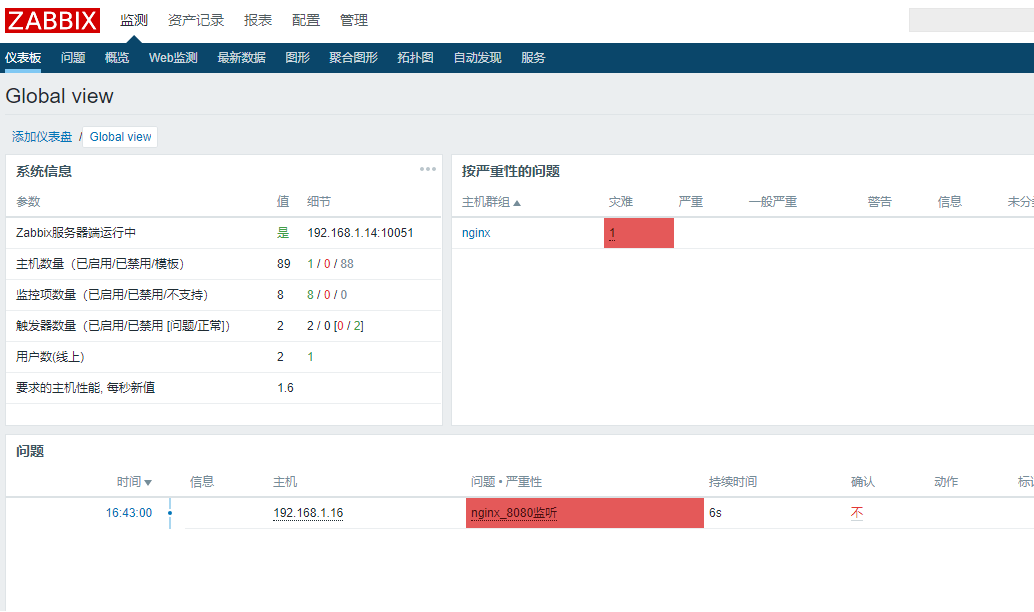
3) After the nginx service was shut down, a dashboard alarm was triggered on the web side.
4) receiving alert mailbox notification, nginx Server Disconnected

5) After 3-5 seconds interval, the nginx service is automatically restarted to achieve self-healing.
[root@nginx zabbix_agentd.d]# systemctl status nginx
● nginx.service - The nginx HTTP and reverse proxy server
Loaded: loaded (/usr/lib/systemd/system/nginx.service; disabled; vendor preset: disabled)
Active: active (running) since Fri 2019-07-19 16:43:10 CST; 12min ago
Process: 50272 ExecStart=/usr/sbin/nginx (code=exited, status=0/SUCCESS)
Process: 50245 ExecStartPre=/usr/sbin/nginx -t (code=exited, status=0/SUCCESS)
Process: 50243 ExecStartPre=/usr/bin/rm -f /run/nginx.pid (code=exited, status=0/SUCCESS)
......
6) View the monitor graph of nginx-8080 on the web side, and the value returns to normal from exceeding the warning line to descending.
7) The dashboard returns to normal automatically

8) Receive notification of successful automatic recovery of malfunction