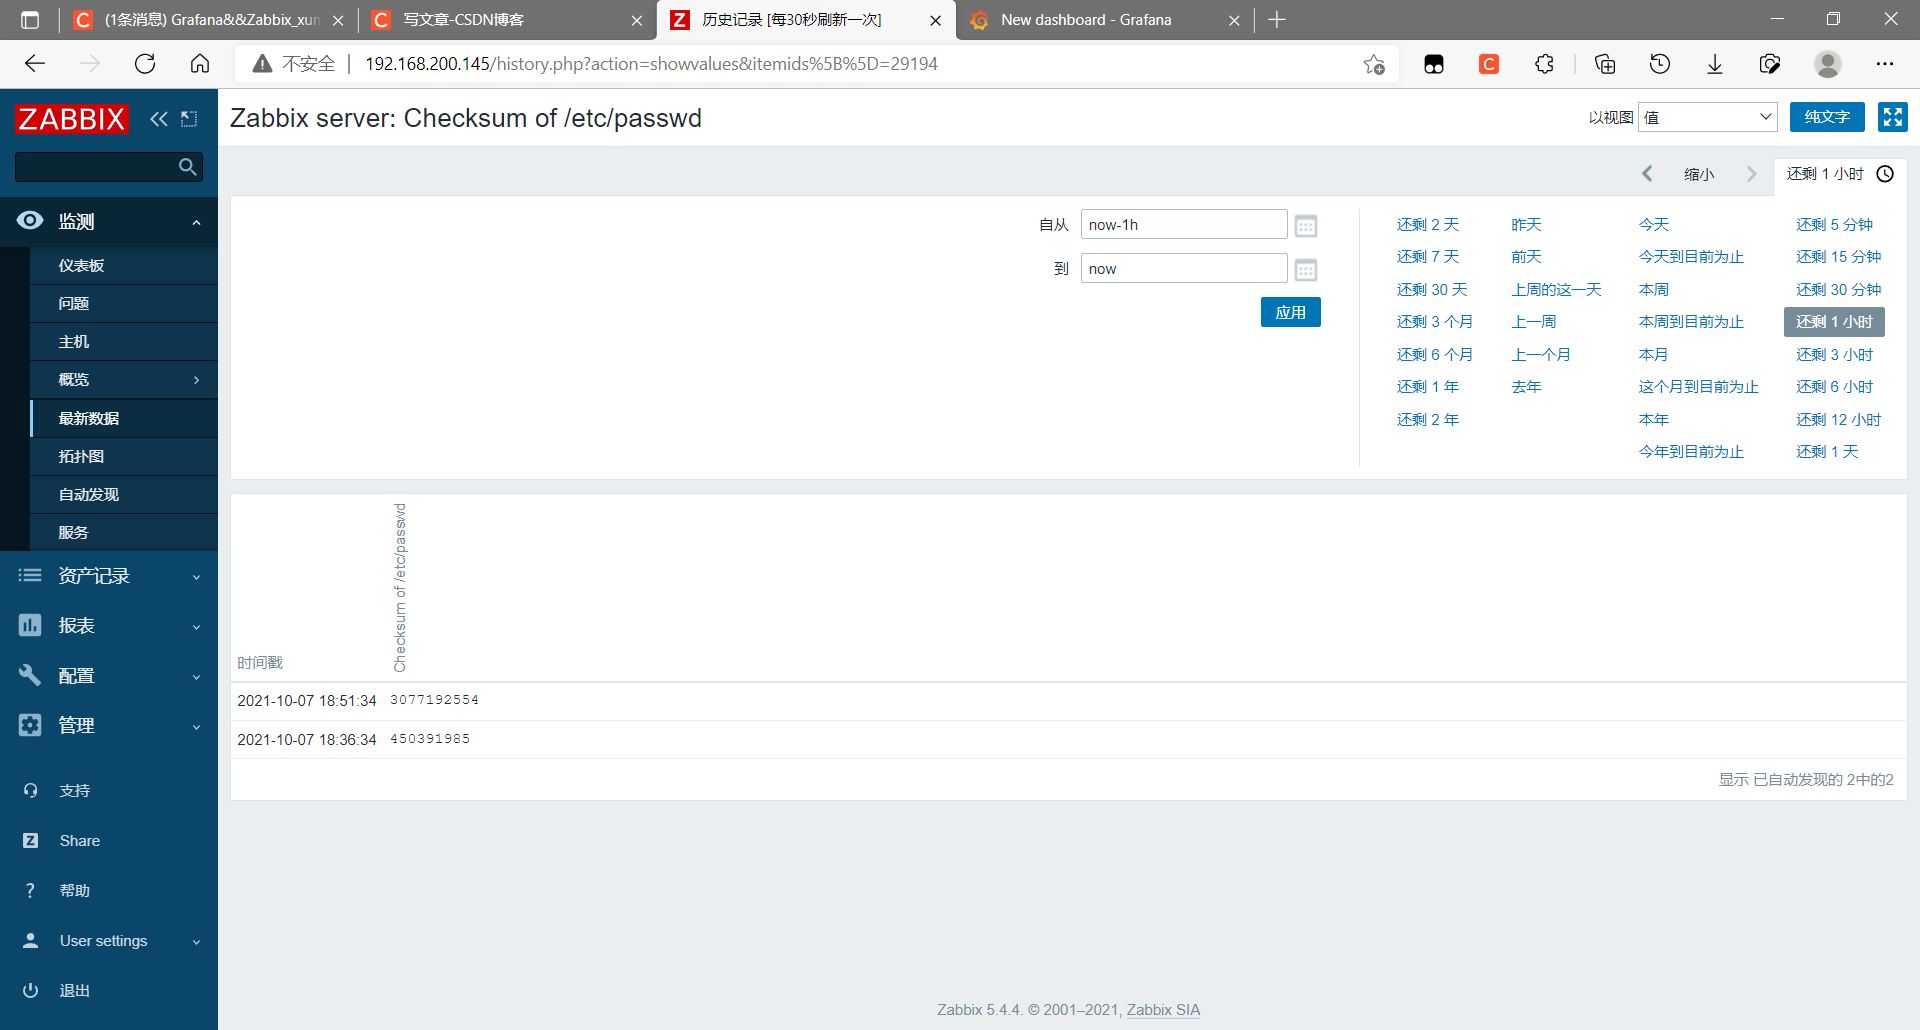
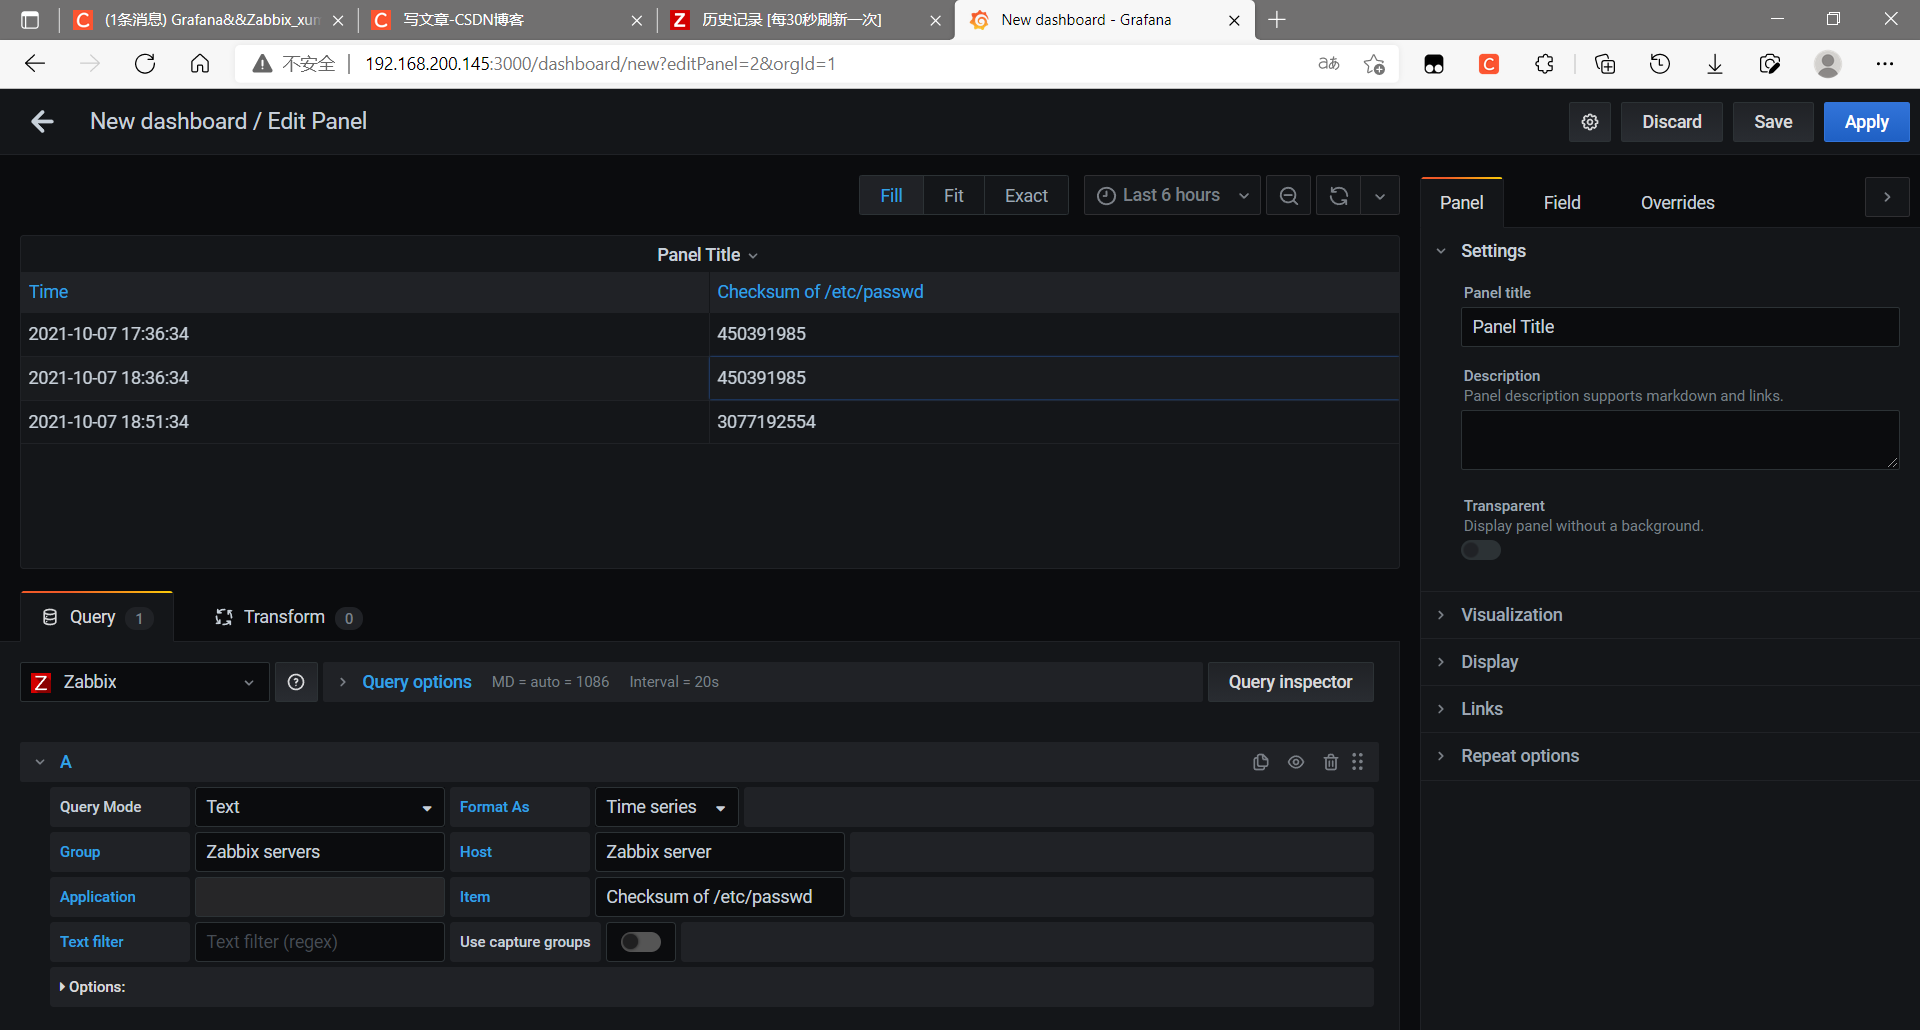
zabbix joins Grafana to draw
1. Introduction to grafana
Grafana is an open source data visualization tool developed in Go language, which can do data monitoring and data statistics, with alarm function. At present, there are many companies using grafana, such as paypal, ebay, intel, etc.
2. Introduction to grafana
Grafana is a cross platform open source measurement analysis and visualization tool, which can query the collected data, then visually display it, and notify it in time. It mainly has the following six characteristics:
1. Display method: fast and flexible client chart. The panel plug-in has many different visual indicators and logs. The official library has rich dashboard plug-ins, such as heat map, line chart, chart and other display methods;
2. Data sources: Graphite, InfluxDB, OpenTSDB, Prometheus, Elasticsearch, CloudWatch, KairosDB, etc;
3. Notification reminder: define the alarm rules of the most important indicators in a visual way. Grafana will continuously calculate and send notifications, and get notifications through Slack, PagerDuty, etc. when the data reaches the threshold;
4. Mixed display: different data sources are mixed in the same chart. You can specify data sources based on each query or even customize data sources;
5. Note: using rich event annotation charts from different data sources, hovering over the event will display complete event metadata and tags;
6. Filters: ad hoc filters allow dynamic creation of new key / value filters, which are automatically applied to all queries using the data source.
3. Deploy Grafana
Grafana is an open source indicator quantity monitoring and visualization tool. The official website is: https://grafana.com/ . The installation of grafana is very simple. The official software warehouse can be used directly, or it can be directly started locally through docker image. You can also directly download rpm packages and binary packages for installation. You can start from https://grafana.com/grafana/download Download the rpm installation package.
[root@server ~]# wget https://dl.grafana.com/oss/release/grafana-7.3.4-1.x86_64.rpm
[root@server ~]# yum install grafana-7.3.4-1.x86_64.rpm
Set startup and self startup
[root@server ~]# systemctl daemon-reload
[root@server ~]# systemctl start grafana-server
[root@server ~]# systemctl enable --now grafana-server
Synchronizing state of grafana-server.service with SysV service script with /usr/lib/systemd/systemd-sysv-install.
Executing: /usr/lib/systemd/systemd-sysv-install enable grafana-server
Created symlink /etc/systemd/system/multi-user.target.wants/grafana-server.service → /usr/lib/systemd/system/grafana-server.service.
[root@server ~]# ss -antl
State  Recv-Q Send-Q Local Address:Port  Peer Address:Port
LISTEN 0      128          0.0.0.0:22         0.0.0.0:*
LISTEN 0      128          0.0.0.0:10050      0.0.0.0:*
LISTEN 0      128          0.0.0.0:10051      0.0.0.0:*
LISTEN 0      128        127.0.0.1:9000       0.0.0.0:*
LISTEN 0      128                *:80               *:*
LISTEN 0      128             [::]:22            [::]:*
LISTEN 0      128                *:3000             *:*
LISTEN 0      80                 *:3306             *:*
Installing grafana ZABBIX plug-in (using grafana cli tool)
[root@server ~]# grafana-cli plugins list-remote
id: abhisant-druid-datasource version: 0.0.6
id: aceiot-svg-panel version: 0.0.11
id: ae3e-plotly-panel version: 0.4.0
id: agenty-flowcharting-panel version: 0.9.1
id: aidanmountford-html-panel version: 0.0.2
id: akumuli-datasource version: 1.3.12
id: alexanderzobnin-zabbix-app version: 4.1.5
id: alexandra-trackmap-panel version: 1.2.6
id: andig-darksky-datasource version: 1.0.2
id: anodot-datasource version: 2.0.3
id: anodot-panel version: 1.0.5
id: aquaqanalytics-kdbadaptor-datasource version: 1.0.2
id: auxmoney-waterfall-panel version: 1.0.6
id: ayoungprogrammer-finance-datasource version: 1.0.1
id: belugacdn-app version: 1.2.1
id: bessler-pictureit-panel version: 1.0.1
id: bilibala-echarts-panel version: 2.2.4
id: blackmirror1-singlestat-math-panel version: 1.1.8
id: blackmirror1-statusbygroup-panel version: 1.1.2
id: bmchelix-ade-datasource version: 1.0.0
id: bosun-app version: 0.0.29
id: briangann-datatable-panel version: 1.0.3
id: briangann-gauge-panel version: 0.0.9
id: camptocamp-prometheus-alertmanager-datasource version: 1.0.0
id: ccin2p3-riemann-datasource version: 0.1.5
id: citilogics-geoloop-panel version: 1.1.2
id: clarity89-finnhub-datasource version: 0.1.1
id: cloudflare-app version: 0.2.1
id: cloudspout-button-panel version: 7.0.23
id: cognitedata-datasource version: 2.4.0
id: corpglory-progresslist-panel version: 1.0.6
id: dalmatinerdb-datasource version: 1.0.5
id: dalvany-image-panel version: 2.3.0
id: ddurieux-glpi-app version: 1.3.1
id: devicehive-devicehive-datasource version: 2.0.2
id: devopsprodigy-kubegraf-app version: 1.5.2
id: digiapulssi-breadcrumb-panel version: 1.1.7
id: digiapulssi-organisations-panel version: 1.3.1
id: digrich-bubblechart-panel version: 1.2.0
id: dlopes7-appdynamics-datasource version: 2.1.4
id: doitintl-bigquery-datasource version: 2.0.2
id: factry-untimely-panel version: 0.2.0
id: farski-blendstat-panel version: 1.0.3
id: fastweb-openfalcon-datasource version: 1.0.1
id: fatcloud-windrose-panel version: 0.7.1
id: fetzerch-sunandmoon-datasource version: 0.2.1
id: fifemon-graphql-datasource version: 1.3.0
id: flant-statusmap-panel version: 0.4.1
id: foursquare-clouderamanager-datasource version: 0.9.3
id: frser-sqlite-datasource version: 2.0.0
id: fzakaria-simple-annotations-datasource version: 1.0.1
id: gapit-htmlgraphics-panel version: 1.3.3
id: gnocchixyz-gnocchi-datasource version: 1.7.1
id: goshposh-metaqueries-datasource version: 0.0.5
id: gowee-traceroutemap-panel version: 0.3.0
id: grafadruid-druid-datasource version: 1.2.0
id: grafana-azure-data-explorer-datasource version: 3.3.2
id: grafana-azure-monitor-datasource version: 0.3.1
id: grafana-clock-panel version: 1.1.3
id: grafana-datadog-datasource version: 2.3.9
id: grafana-discourse-datasource version: 1.1.0
id: grafana-dynatrace-datasource version: 3.1.2
id: grafana-enterprise-logs-app version: 2.2.0
id: grafana-github-datasource version: 1.0.11
id: grafana-gitlab-datasource version: 0.1.4
id: grafana-googlesheets-datasource version: 1.0.1
id: grafana-image-renderer version: 3.2.0
id: grafana-iot-sitewise-datasource version: 1.1.0
id: grafana-jira-datasource version: 1.0.3
id: grafana-k6cloud-datasource version: 0.1.2
id: grafana-kairosdb-datasource version: 3.0.2
id: grafana-metrics-enterprise-app version: 3.2.1
id: grafana-mongodb-datasource version: 1.1.7
id: grafana-newrelic-datasource version: 2.2.3
id: grafana-oracle-datasource version: 2.0.6
id: grafana-piechart-panel version: 1.6.2
id: grafana-polystat-panel version: 1.2.6
id: grafana-salesforce-datasource version: 0.9.2
id: grafana-saphana-datasource version: 1.0.1
id: grafana-servicenow-datasource version: 2.1.6
id: grafana-simple-json-datasource version: 1.4.2
id: grafana-singlestat-panel version: 1.0.0
id: grafana-snowflake-datasource version: 1.2.0
id: grafana-splunk-datasource version: 2.1.0
id: grafana-splunk-monitoring-datasource version: 1.0.0
id: grafana-strava-datasource version: 1.3.0
id: grafana-synthetic-monitoring-app version: 0.8.13
id: grafana-timestream-datasource version: 1.2.0
id: grafana-wavefront-datasource version: 1.0.6
id: grafana-worldmap-panel version: 0.3.3
id: grafana-x-ray-datasource version: 1.3.2
id: gretamosa-topology-panel version: 1.0.1
id: gridprotectionalliance-openhistorian-datasource version: 1.0.3
id: gridprotectionalliance-osisoftpi-datasource version: 1.1.1
id: groonga-datasource version: 1.1.4
id: hadesarchitect-cassandra-datasource version: 1.0.0
id: hawkular-datasource version: 1.1.2
id: humio-datasource version: 3.2.4
id: ibm-apm-datasource version: 0.9.1
id: innius-grpc-datasource version: 1.0.3
id: innius-video-panel version: 1.0.5
id: instana-datasource version: 3.3.1
id: integrationmatters-comparison-panel version: 1.1.0
id: isaozler-paretochart-panel version: 0.3.1
id: jasonlashua-prtg-datasource version: 4.0.4
id: jdbranham-diagram-panel version: 1.7.2
id: jeanbaptistewatenberg-percent-panel version: 1.0.6
id: larona-epict-panel version: 2.0.4
id: lightstep-metrics-datasource version: 1.0.0
id: linksmart-hds-datasource version: 1.0.2
id: linksmart-sensorthings-datasource version: 1.3.1
id: macropower-analytics-panel version: 2.0.0
id: magnesium-wordcloud-panel version: 1.2.4
id: marcuscalidus-svg-panel version: 0.3.4
id: marcusolsson-calendar-panel version: 0.5.0
id: marcusolsson-csv-datasource version: 0.6.1
id: marcusolsson-dynamictext-panel version: 1.7.2
id: marcusolsson-gantt-panel version: 0.7.4
id: marcusolsson-hexmap-panel version: 0.3.1
id: marcusolsson-hourly-heatmap-panel version: 1.0.0
id: marcusolsson-json-datasource version: 1.3.0
id: marcusolsson-static-datasource version: 1.4.3
id: marcusolsson-treemap-panel version: 0.9.2
id: meteostat-meteostat-datasource version: 0.1.5
id: michaeldmoore-annunciator-panel version: 1.1.0
id: michaeldmoore-multistat-panel version: 1.7.2
id: michaeldmoore-scatter-panel version: 1.0.0
id: monasca-datasource version: 1.0.1
id: monitoringartist-monitoringart-datasource version: 1.0.1
id: moogsoft-aiops-app version: 8.0.1
id: mtanda-google-calendar-datasource version: 1.0.5
id: mtanda-heatmap-epoch-panel version: 0.1.8
id: mtanda-histogram-panel version: 0.1.7
id: mxswat-separator-panel version: 1.0.1
id: natel-discrete-panel version: 0.1.1
id: natel-influx-admin-panel version: 0.0.6
id: natel-plotly-panel version: 0.0.7
id: natel-usgs-datasource version: 0.0.3
id: neocat-cal-heatmap-panel version: 0.0.4
id: novalabs-annotations-panel version: 0.0.2
id: novatec-sdg-panel version: 4.0.3
id: ntop-ntopng-datasource version: 1.0.1
id: oci-logs-datasource version: 1.1.0
id: oci-metrics-datasource version: 2.2.4
id: opennms-helm-app version: 6.0.0
id: ovh-warp10-datasource version: 2.2.1
id: paytm-kapacitor-datasource version: 0.1.3
id: percona-percona-app version: 1.0.1
id: petrslavotinek-carpetplot-panel version: 0.1.2
id: pierosavi-imageit-panel version: 1.0.5
id: pixie-pixie-datasource version: 0.0.1
id: pr0ps-trackmap-panel version: 2.1.2
id: praj-ams-datasource version: 1.2.1
id: pue-solr-datasource version: 1.0.3
id: pyroscope-datasource version: 1.0.0
id: pyroscope-panel version: 1.0.1
id: quasardb-datasource version: 3.8.3
id: rackerlabs-blueflood-datasource version: 0.0.3
id: radensolutions-netxms-datasource version: 1.2.3
id: redis-app version: 1.2.0
id: redis-datasource version: 1.5.0
id: redis-explorer-app version: 1.1.0
id: ryantxu-ajax-panel version: 0.1.0
id: ryantxu-annolist-panel version: 0.0.2
id: satellogic-3d-globe-panel version: 0.1.1
id: savantly-heatmap-panel version: 0.2.1
id: sbueringer-consul-datasource version: 0.2.1
id: scadavis-synoptic-panel version: 1.0.5
id: sebastiangunreben-cdf-panel version: 0.2.2
id: sidewinder-datasource version: 0.2.1
id: simpod-json-datasource version: 0.2.3
id: skydive-datasource version: 1.2.1
id: smartmakers-trafficlight-panel version: 1.0.1
id: sni-pnp-datasource version: 1.0.8
id: sni-thruk-datasource version: 1.0.6
id: snuids-radar-panel version: 1.4.5
id: snuids-svg-panel version: 1.0.0
id: snuids-trafficlights-panel version: 1.4.6
id: speakyourcode-button-panel version: 0.2.2
id: spotify-heroic-datasource version: 0.0.2
id: sskgo-perfcurve-panel version: 1.4.0
id: stagemonitor-elasticsearch-app version: 0.83.3
id: streamr-datasource version: 1.5.0
id: teamviewer-datasource version: 1.0.2
id: tencentcloud-monitor-app version: 2.2.2
id: thalysantana-appcenter-datasource version: 1.0.0
id: thiagoarrais-matomotracking-panel version: 0.2.3
id: udoprog-heroic-datasource version: 0.1.1
id: vertamedia-clickhouse-datasource version: 2.3.1
id: vertica-grafana-datasource version: 0.1.1
id: verticle-flowhook-datasource version: 0.1.2
id: volkovlabs-image-panel version: 1.0.1
id: vonage-status-panel version: 1.0.11
id: voxter-app version: 0.0.2
id: williamvenner-timepickerbuttons-panel version: 4.1.1
id: woutervh-mapbox-panel version: 1.0.0
id: xginn8-pagerduty-datasource version: 0.2.2
id: yesoreyeram-boomtable-panel version: 1.4.1
id: yesoreyeram-boomtheme-panel version: 0.1.1
id: yesoreyeram-infinity-datasource version: 0.7.8
id: yeya24-chaosmesh-datasource version: 0.2.2
id: zuburqan-parity-report-panel version: 1.2.2

Restart grafana after installing plugins . <service grafana-server restart>

[root@server ~]# grafana-cli plugins install alexanderzobnin-zabbix-app
installing alexanderzobnin-zabbix-app @ 4.1.5
from: https://grafana.com/api/plugins/alexanderzobnin-zabbix-app/versions/4.1.5/download
into: /var/lib/grafana/plugins

✔ Installed alexanderzobnin-zabbix-app successfully

Restart grafana after installing plugins . <service grafana-server restart>

[root@server ~]# systemctl restart grafana-server
Plug ins are installed in the / var/lib/grafana/plugins directory by default
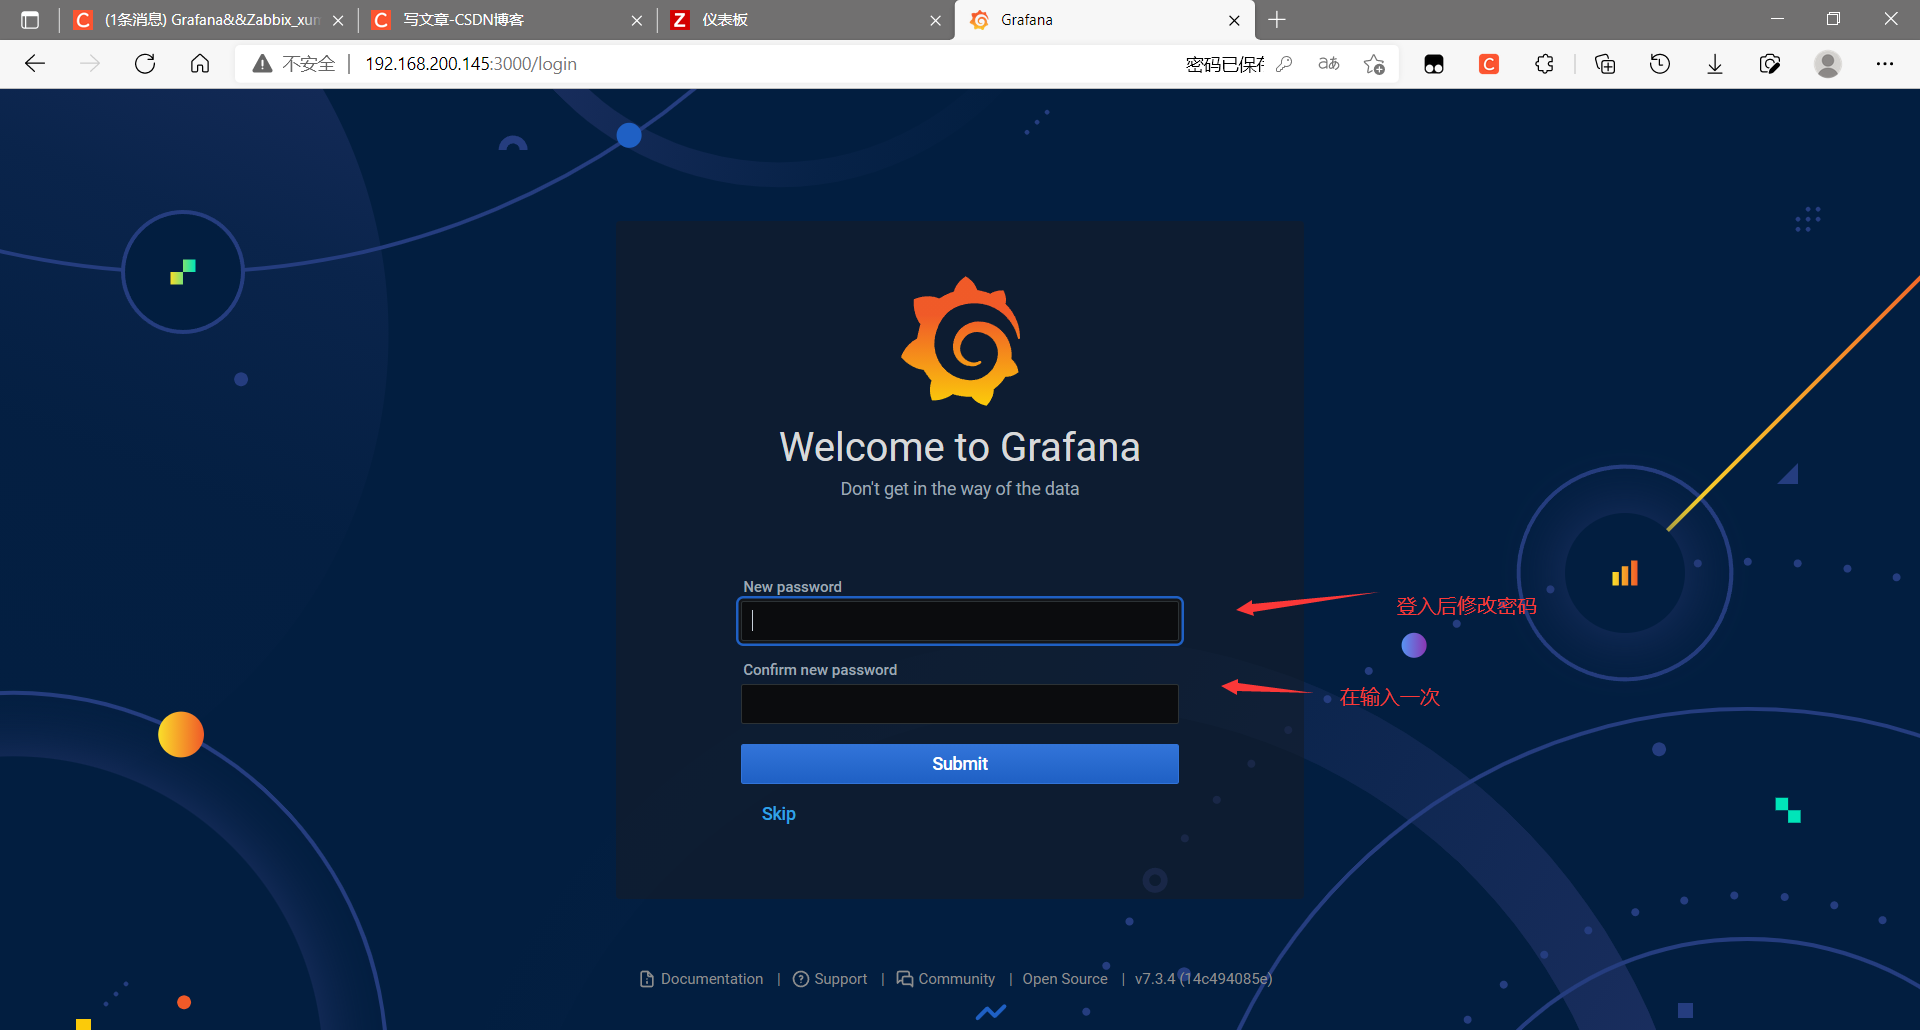
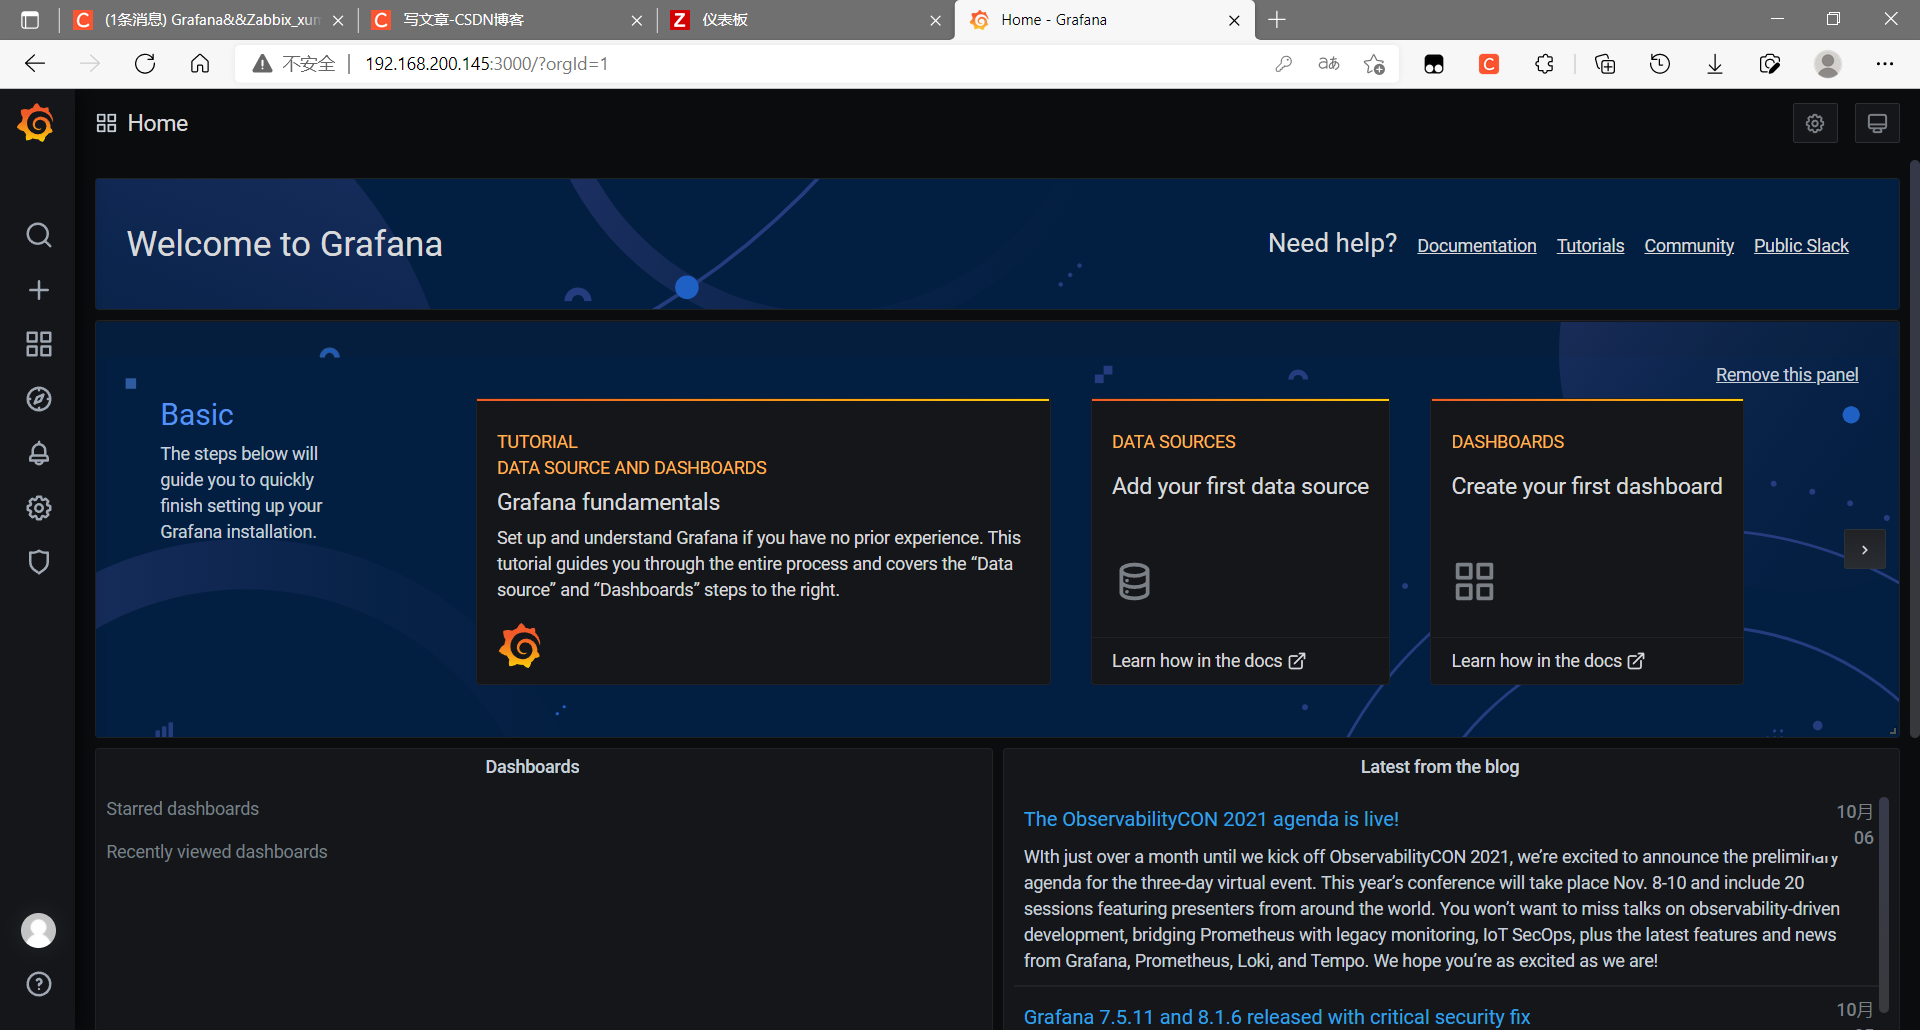
http://IP:3000/ Open the grafana interface, enter admin/admin to log in, and then change the admin password as prompted.

zabbix data source
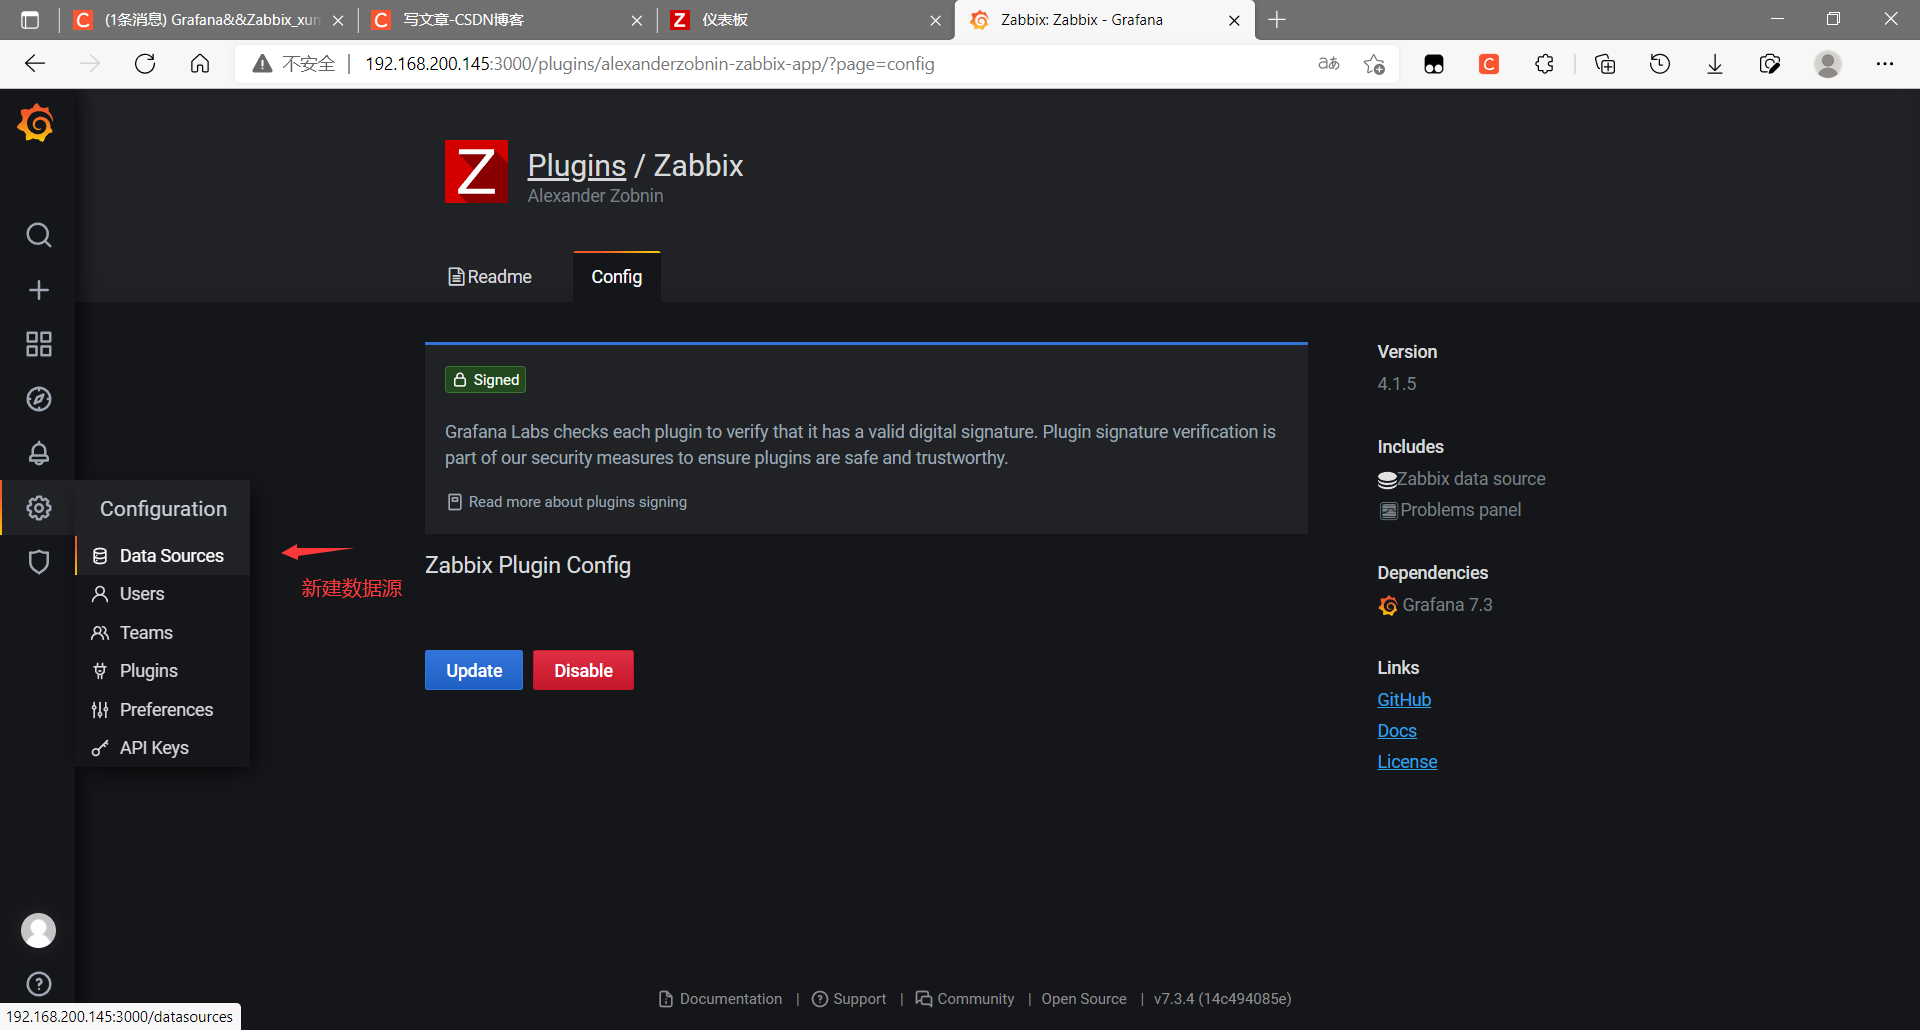
First, you need to enable the zabbix plug-in. Click "Plugins" in the left sidebar - setting submenu of grafana, find and click zabbix in the plug-in list (if it is not found, it means that your plug-in installation is not successful). Click the "enable" button to officially enable the zabbix plug-in



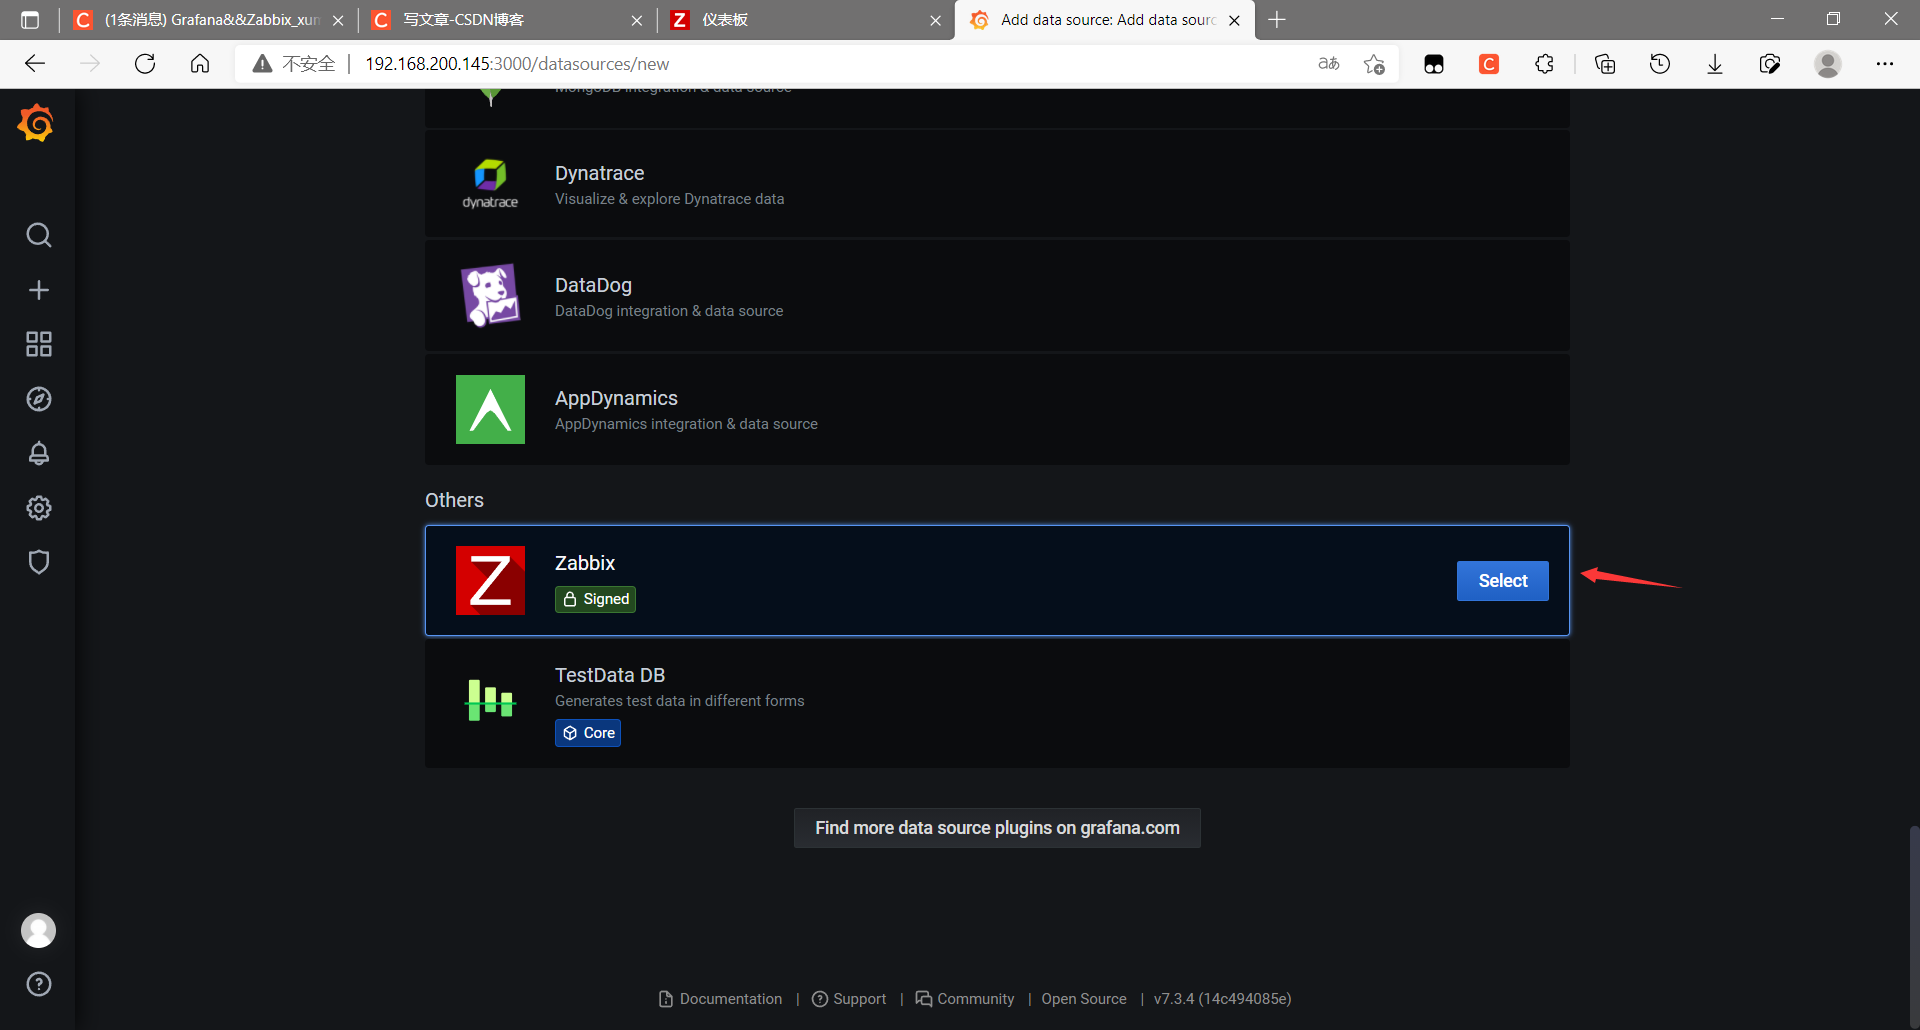
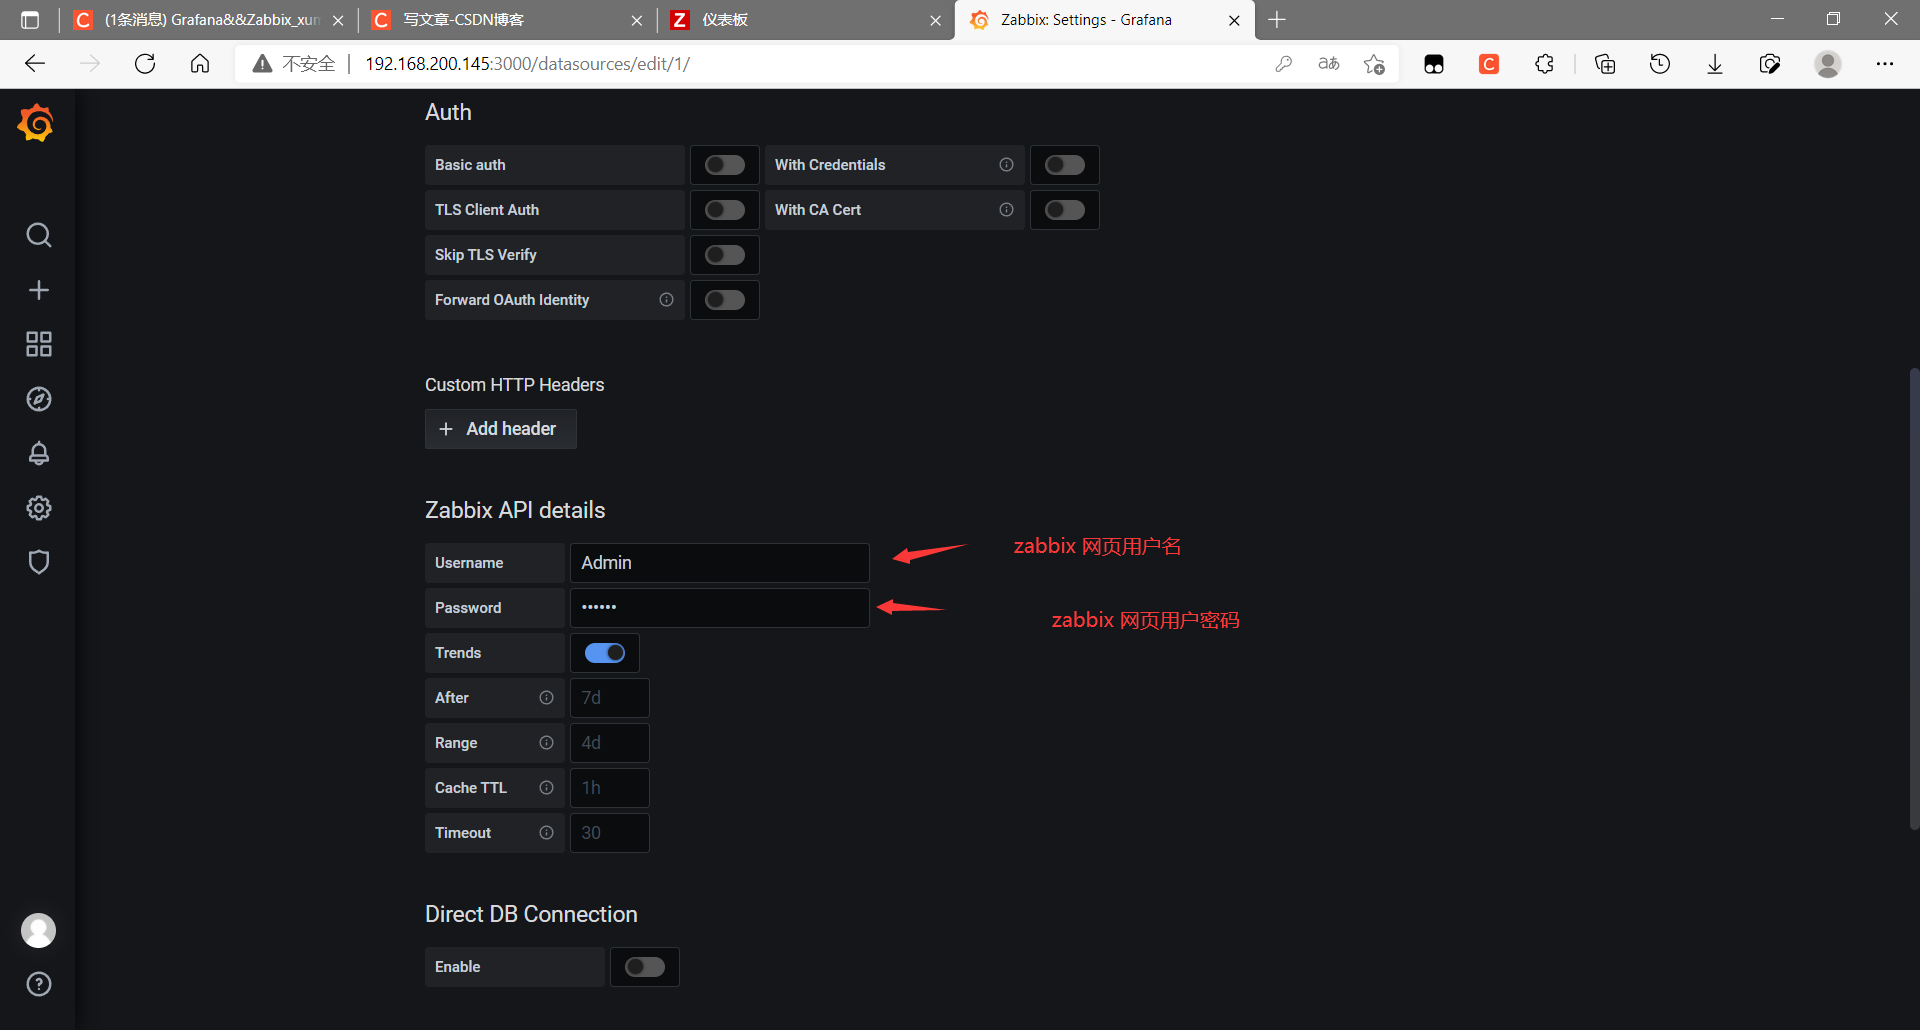
1. Fill in API address: set Zabbix API address http://ip:port/api_jsonrpc.php
for example http://192.168.10.10:80/api_jsonrpc.php
or http://192.168.10.10:80/zabbix/api_jsonrpc.php
The first half of this URL is actually your zabbix access address, which varies from person to person. The second half may have / zabbix
2. User name and password of API connection: grafana needs to obtain all groups and hosts
Note:
1. After filling in the API information here, clicking connect may report an error: Could not connect to given url!
In this case, check the front and back parts of the URL. The first part is written according to the zabbix WEB access address, and the second part can find the API in the background of the host_ jsonrpc.php


Add visualization panel
We try to visualize the monitoring data in zabbix.
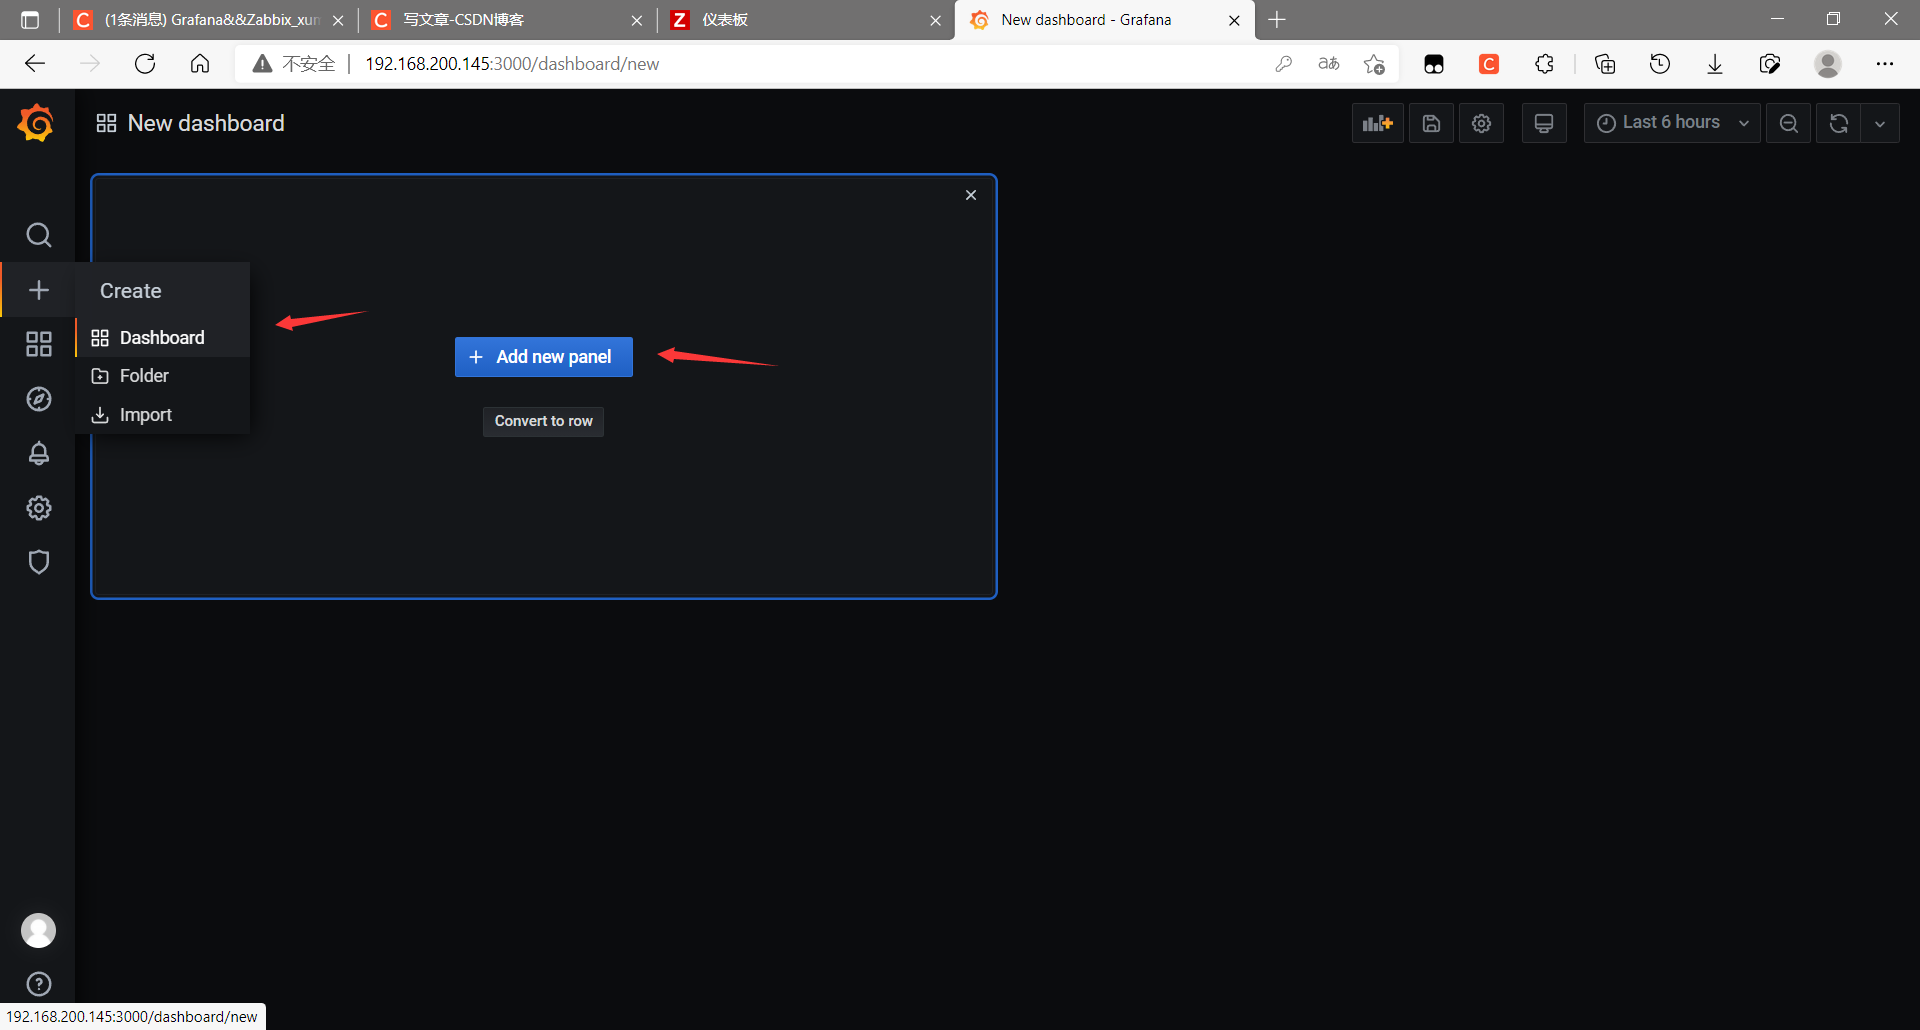
Find create dashboard – add new panel in the left column

Panel introduction
1. Select a data source and select "zabbix" from the drop-down box here.
2. The data in your zabbix will pop up when you place the mouse over Group, Host, application (optional) and item. Just choose as needed.
3. On the right are some chart rendering effect settings, mainly to select the chart style as required. Here, select graph.
Here we insert a label

! [insert picture description here]( https://img-blog.csdnimg.cn/1d8fe4a7566b42eaa4dfb12d6241f82d.png?x-oss-process=image/watermark,type_ZHJvaWRzYW5zZmFsbGJhY2s,shadow_50,text_