1. Zabbix Monitoring PHP-FPM Application
Nginx+PHP-FPM is the most popular LMP architecture at present. Under the system based on PHP development, monitoring the performance of these systems mainly focuses on the running status of PHP-FPM. So what is PHP-FPM?PHP-FPM is a PHP FastCGI manager, which provides a better way to manage PHP processes. It can effectively control memory and processes, and smoothly overload PHP configuration. For PHP prior to ZPHP 5.3.3, it is a patch package. Since PHP version 5.3.3, PHP has integrated php-fpm module internally, which means it is officially included by PHP.When compiling PHP, you need to specify the parameter "--enable-fpm" to turn PHP-FPM on.
1) Enable php-fpm status function
The operation is as follows:
1)install nginx
[root@agent ~]# yum -y install zlib pcre pcre-devel openssl openssl-devel
[root@agent ~]# wget http://nginx.org/download/nginx-1.14.1.tar.gz
[root@agent ~]# tar zxf nginx-1.14.1.tar.gz -C /usr/src
[root@agent ~]# cd /usr/src/nginx-1.14.1/
[root@agent nginx-1.14.1]#  ./configure --prefix=/usr/local/nginx --user=www --group=www \
>  --with-http_stub_status_module --with-http_ssl_module --with-pcre \
>  --with-http_gzip_static_module && make && make install
[root@agent nginx-1.14.1]#  ln -s /usr/local/nginx/sbin/nginx /usr/local/sbin
2)install php
[root@agent ~]# yum -y install libjpeg libjpeg-devel libpng libpng-devel freetype freetype-devel libxml2 libxml2-devel zlib zlib-devel curl curl-devel openssl openssl-devel openldap openldap-devel
[root@agent ~]#  wget https://www.php.net/distributions/php-7.2.3.tar.gz
[root@agent ~]# useradd -s /sbin/nologin www
[root@agent ~]#  tar zxf php-7.2.3.tar.gz -C /usr/src
[root@agent ~]#  cd /usr/src/php-7.2.3/
[root@agent php-7.2.3]# ./configure --prefix=/usr/local/php7 --enable-fpm  --with-fpm-user=www --with-fpm-group=www && make && make install
[root@agent php-7.2.3]#  ln -s /usr/local/nginx/sbin/nginx /usr/local/sbin
[root@agent php-7.2.3]# cp php.ini-production /usr/local/php7/lib/php.ini
[root@agent php-7.2.3]# cp sapi/fpm/php-fpm.service /usr/lib/systemd/system/
[root@agent php-7.2.3]#  vim  /usr/local/php7/lib/php.ini
post_max_size = 16M
max_execution_time = 300
memory_limit = 128M
max_input_time = 300
date.timezone = Asia/Shanghai
[root@agent php-7.2.3]# vim /usr/local/nginx/conf/nginx.conf
        location ~ \.php$ {
            root           html;
            fastcgi_pass   127.0.0.1:9000;
            fastcgi_index  index.php;
            fastcgi_param  SCRIPT_FILENAME /usr/local/nginx/html$fastcgi_script_name;
            include        fastcgi_params;
        }
[root@agent php-7.2.3]#  nginx -t
[root@agent php-7.2.3]# cd /usr/local/php7/etc/
[root@agent etc]# cp php-fpm.conf.default php-fpm.conf
[root@agent etc]# cp php-fpm.d/www.conf.default php-fpm.d/www.conf
[root@agent etc]# vim php-fpm.d/www.conf
[www]
user = www
group = www
listen = 127.0.0.1:9000
pm = dynamic
pm.max_children = 300
pm.start_servers = 20
pm.min_spare_servers = 5
pm.max_spare_servers = 35
pm.status_path = /status
[root@agent etc]# nginx
[root@agent etc]# systemctl daemon-reload
[root@agent etc]# systemctl start php-fpm
[root@agent etc]# ss  -lnt | grep 9000
LISTEN     0      128    127.0.0.1:9000                     *:*
[root@agent etc]# ss  -lnt | grep 80
LISTEN     0      128          *:80                       *:*
Parameters modified in the/usr/local/php7/etc/php-fpm.d/www.conf file: 1) user and group: Users and user groups for running phpf-pm processes; 2) listen: Configure the IP address and port that the php-fpm process listens on, defaulting to 127.0.0.1:9000; 3) pm: Specifies how the php-fpm process pool opens a process. There are two values to choose from, static and dynamic. Dynamic: Indicates that the number of php-fpm processes is dynamic, starting with the number specified by php.start_servers. If more requests are made, the number of idle processes will automatically increase, ensuring that the number of idle processes is not less than pm.min_spare_servers, and if there are more processes, corresponding cleanup will be carried out to ensure that the number of idle processes is not more than pm.max_spare_servers; Static: indicates that the number of php-fpm processes is static, the number of processes is specified by pm.max_children from start to finish, and is not increasing or decreasing; 4) pm.max_children = 300: the number of fixed open php-fpm processes in static mode and the maximum number of open php-fpm processes in dynamic mode; 5) pm.start_servers = 20: Indicates the number of php-fpm processes initially opened in dynamic mode; 6) pm.min_spare_servers = 5: Indicates the minimum number of php-fpm processes opened in the idle state of dynamic mode; 7) pm.max_spare_servers = 35: Indicates the maximum number of php-fpm processes opened in the idle state of dynamic mode. Note here that the value of pm.max_spare_servers can only be less than or equal to the value of pm.max_children; 8) pm.status_path =/status: Indicates the path to configure the php-fpm running status page;
When setting parameters, it is important to note that if PM is static, only pm.max_children is valid, and the system will start the set number of php-fpm processes.If the PM is dynamic, the system will start pm.start_servers php-fpm processes at the beginning of the php-fpm run, then dynamically adjust the number of php-fpm processes between pm.min_spare_servers and pm.max_spare_servers to a maximum of the number of processes set by pm.max_children according to the system requirements.
Personal recommendation: Servers with sufficient memory (above 16G), servers with small memory (below 16G), and servers with dynamic are recommended.
2) nginx configuration php-fpm status page
After opening the status monitoring page for php-fpm, you need to add location rules to the nginx configuration file.The following:
[root@agent ~]# vim /usr/local/nginx/conf/nginx.conf
//Add the following location rule
        location ~^/(status)$ {
            fastcgi_pass 127.0.0.1:9000;
            fastcgi_param SCRIPT_FILENAME /usr/local/nginx/html$fastcgi_script_name;
            include        fastcgi_params;
        }
[root@agent ~]# nginx -t
[root@agent ~]# nginx -s reload
3) php-fpm status page status
One of the more personalized aspects of the php-fpm status page is that it can take parameters with it: json, xml, htm, and with zabbix or nagios monitoring you can consider using XML or the default.
[root@agent ~]# curl http://127.0.0.1/status
//View php-fpm status page information (default output)
pool:                 www
process manager:      dynamic
start time:           01/Feb/2020:11:19:34 +0800
start since:          3235
accepted conn:        1
listen queue:         0
max listen queue:     0
listen queue len:     128
idle processes:       19
active processes:     1
total processes:      20
max active processes: 1
max children reached: 0
slow requests:        0
[root@agent ~]# curl http://127.0.0.1/status?xml//displayed in xml format
[root@agent ~]# curl http://127.0.0.1/status?json//displayed in json format
Meaning of output parameters:
1) The name of the pool: php-fpm pool (resource pool), which in most cases is www;
2) process manager: most processes are managed dynamic ally today, do not use static;
3) start time: the last start time;
4) start since: how many seconds have been run;
5) accepted conn pool: the number of requests received;
6) listen queue: The number of connections in a waiting state, if not 0, needs to increase the number of php-fpm processes;
7) max listen queue: the maximum number of connections waiting from php-fpm startup to now;
8) listen queue len: the size of the socket in the queue waiting to connect;
9) idle processes: the number of processes that are idle;
10) Active processes: the number of active processes;
11) total processess: the total number of processes;
12) max active process: Up to a few processes have been active since php-fpm was started;
13) max children reached: When php-fpm tries to start more child ren processes, it reaches the limit of the number of processes, reaching the limit of one record at a time, if not 0, it needs to increase the maximum number of php-fpm pool processes;
14) slow requests: When php-fpm slow-log is enabled, this counter will increase if php-fpm slow requests occur, which is triggered by an improper Mysql query in general;
4) Add custom monitoring on the zabbix agent side
Monitoring the state of php-fpm is very simple and can be accomplished in one command without writing a separate script, as follows:
[root@agent ~]# /usr/bin/curl -s "http://127.0.0.1/status?xml" | grep "<accepted-conn>" | awk -F'>'awk -F'<|>' '{print $3}'
17
[root@agent ~]# /usr/bin/curl -s "http://127.0.0.1/status?xml" | grep "<process-manager>" | awk -F'>'awk -F'<|>' '{print $3}'
dynamic
[root@agent ~]# /usr/bin/curl -s "http://127.0.0.1/status?xml" | grep "<active-processes>" | awk -F'>'awk -F'<|>' '{print $3}'
1
//As long as the filtered value after the grep command is treated as a variable, you can get any value
[root@agent ~]# vim /etc/zabbix/zabbix_agentd.d/userparameter_phpfpm.conf
//Write a template file for phpfpm to invoke monitoring scripts for phpfpm
UserParameter=php-fpm.status[*],/usr/bin/curl -s "http://127.0.0.1/status?xml" | grep "<$1>" | awk -F'>'awk -F'<|>' '{print $$3}'
//Notice that this custom monitor defines php-fpm.status[*], which is the value provided by'$1', $1 is the input value, such as accepted-conn, and the key value of the monitor is php-fpm.status[accepted-conn].Also, the last'$$3'is because commands are grouped in variables, so use'$$' or you cannot get data
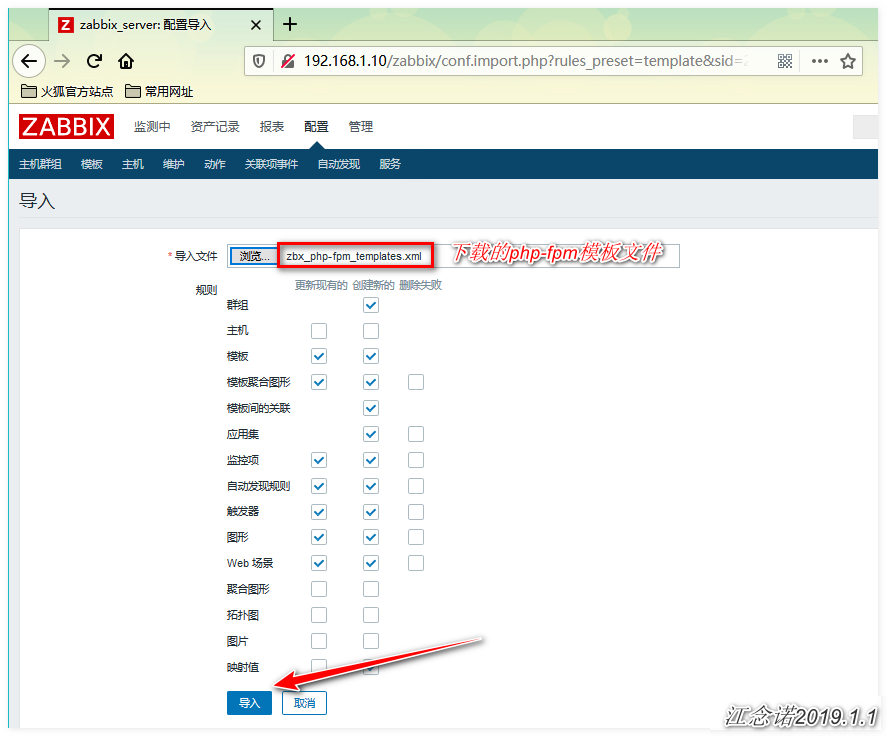
[root@agent ~]# systemctl restart php-fpm5) zabbix GUI Import Template
zabbix does not have its own monitoring template for php-fpm by default, so it needs to be written by itself. Here we download the template for php-fpm directly!
[root@agent ~]# wget https://www.ixdba.net/zabbix/zbx_php-fpm_templates.zip
[root@agent ~]# unzip zbx_php-fpm_templates.zip
[root@agent ~]# ll  zbx_php-fpm_templates.xml
-rw-r--r-- 1 root root 29138 11 August 8, 2018 zbx_php-fpm_templates.xml
//This is the template you need
Figure: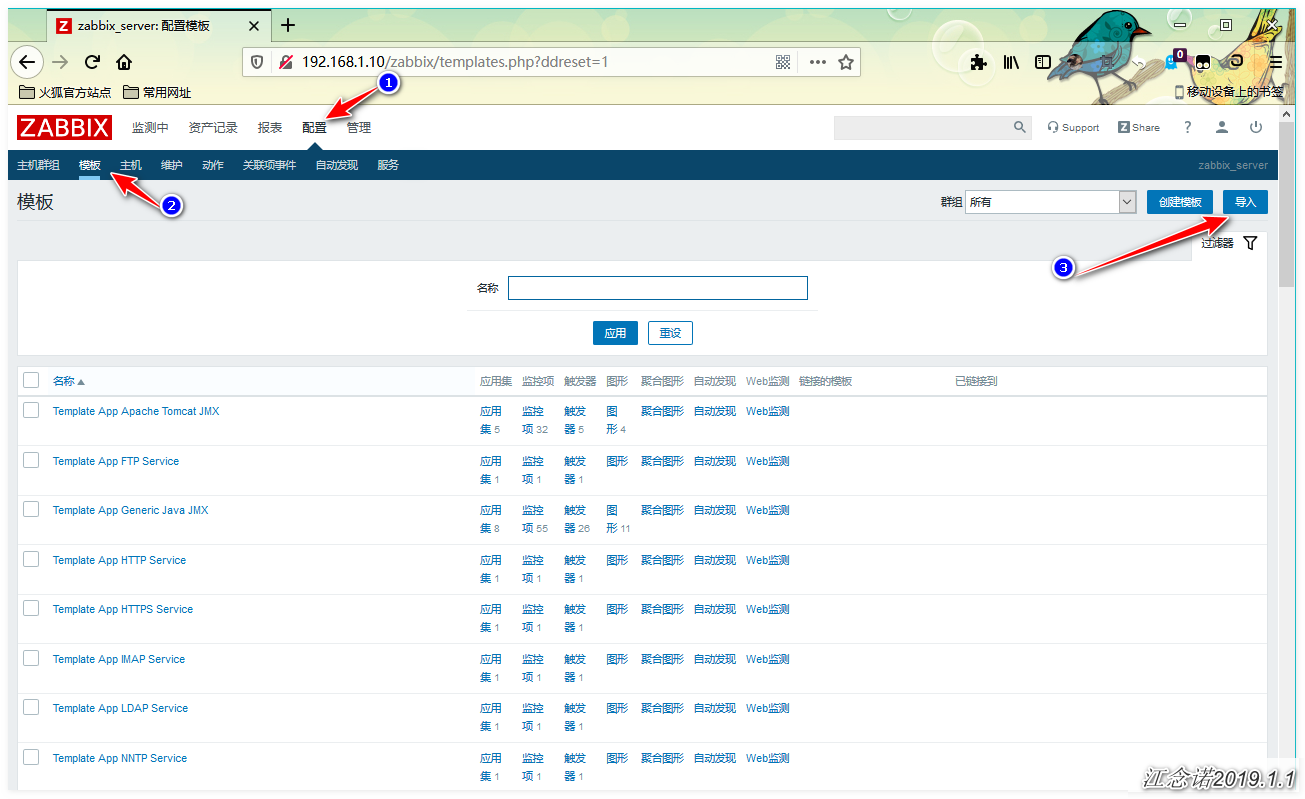
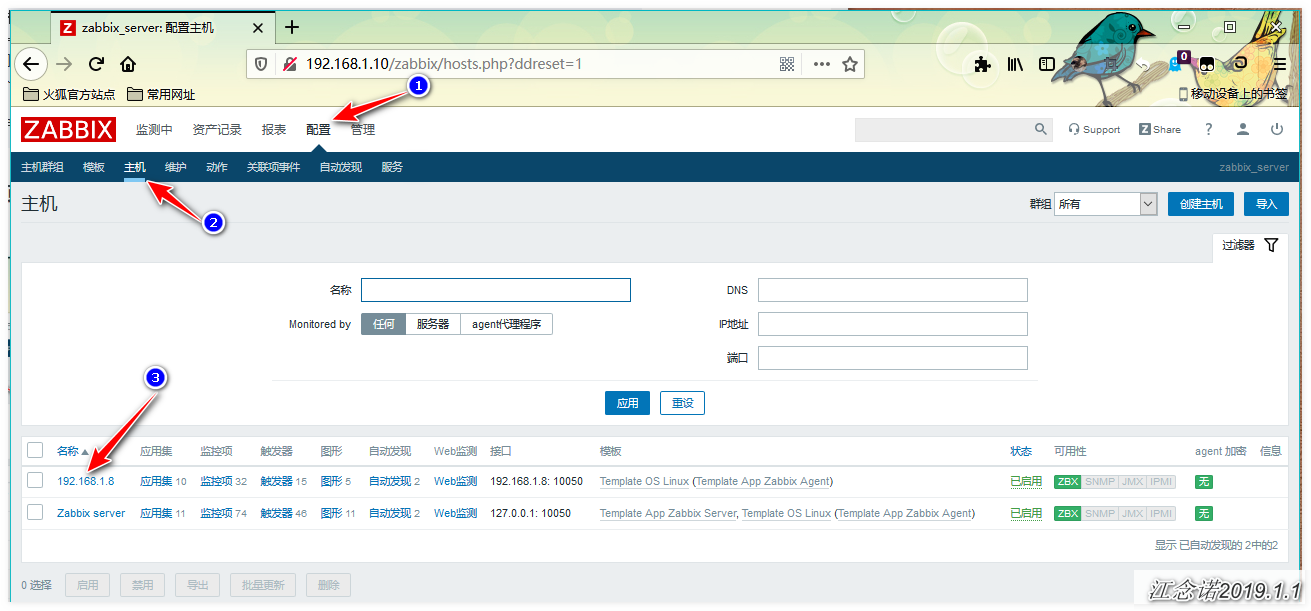
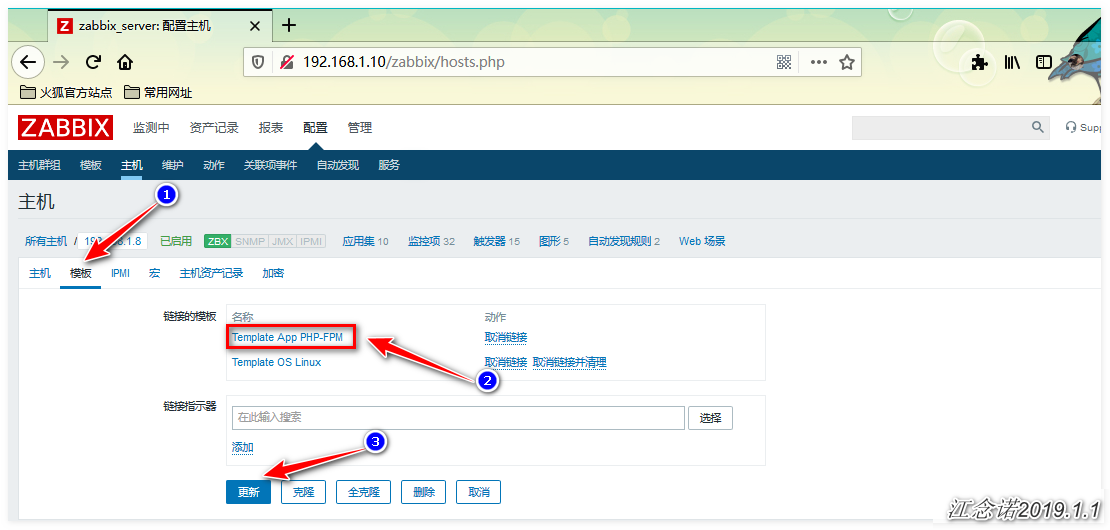
6) View php-fpm status data
Figure: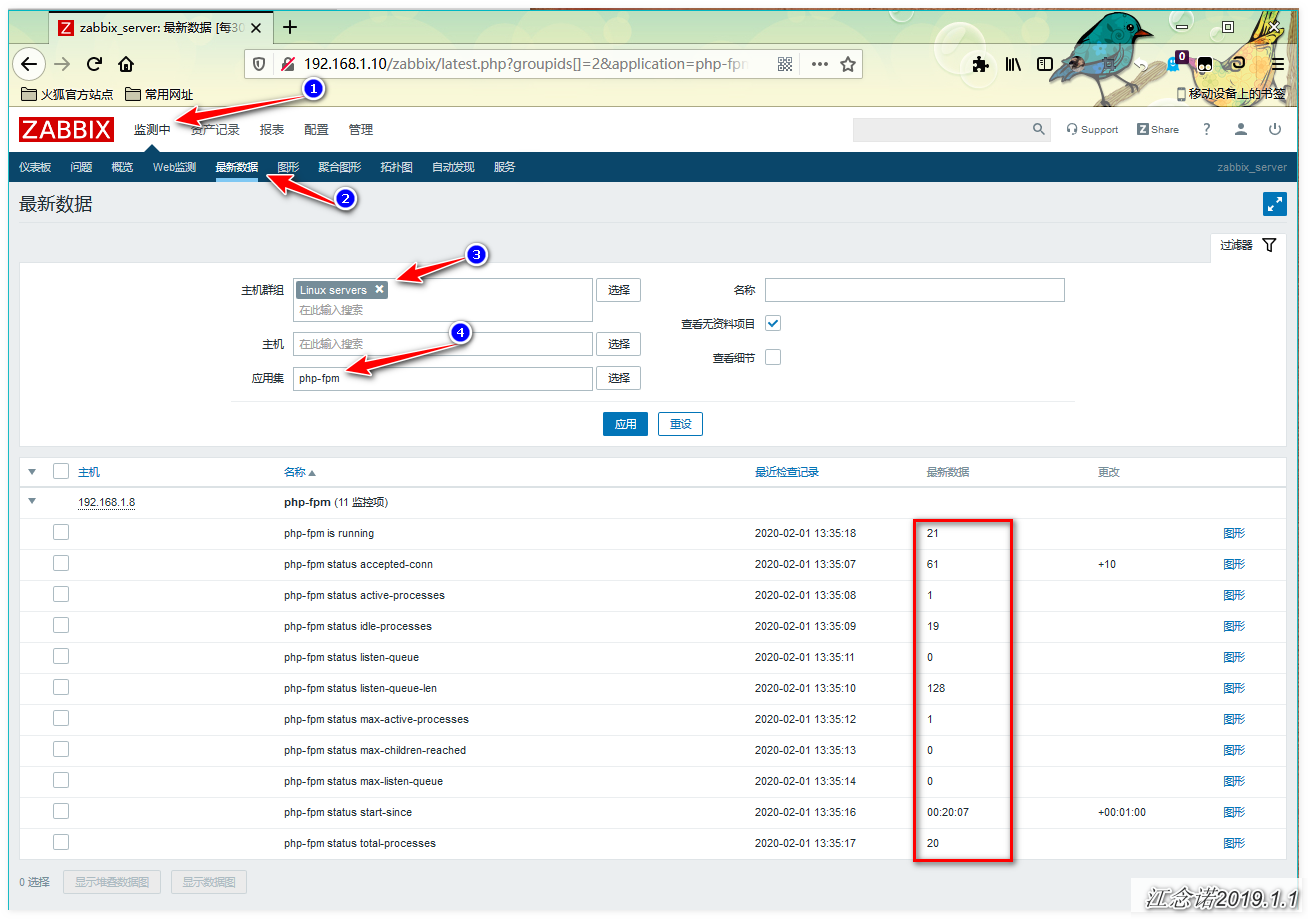
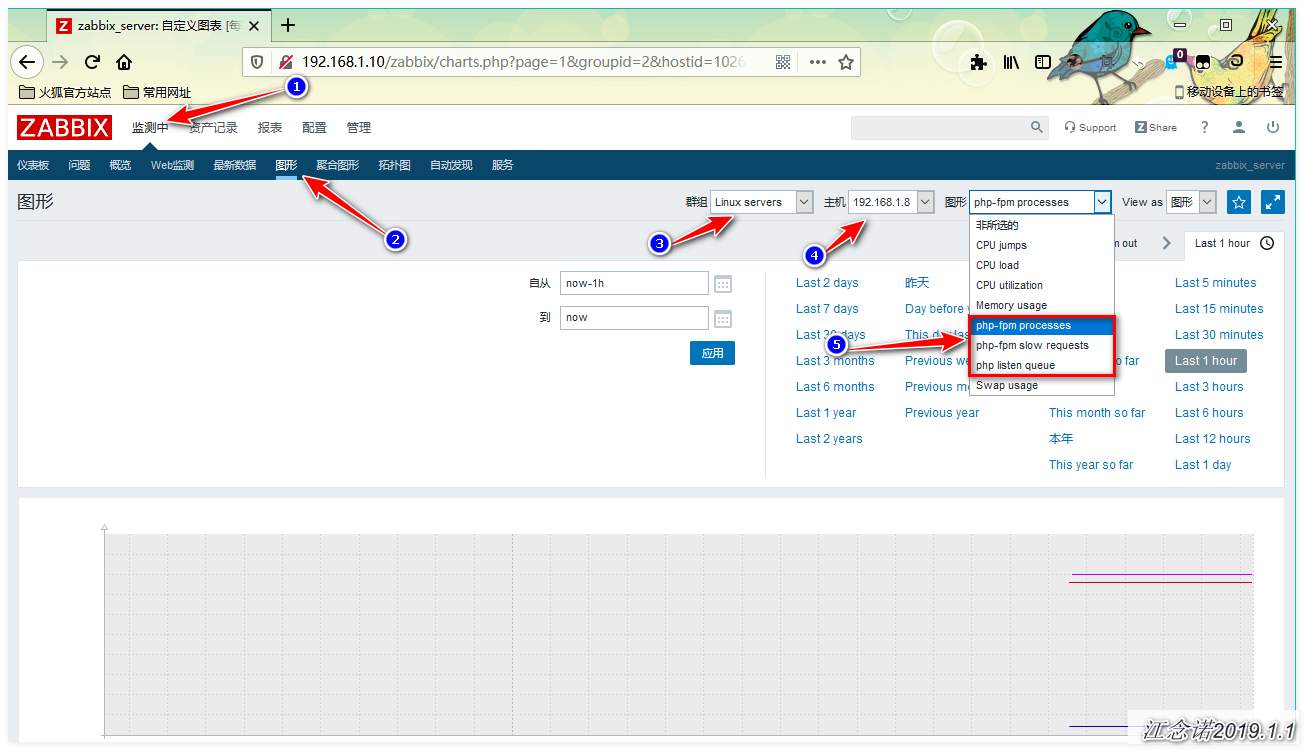
You can see from the diagram that the data is already available!
Configure php-fpm monitoring complete!
2. zabbix Monitoring tomcat Application
For some java-class applications using tomcat, monitoring Tomcat is especially important when the application system is abnormal and we need to know the running status of Tomcat and JVM to determine whether there are problems with program or system resources.The following details how to monitor the running status of Tomcat instances through zabbix.
ZABBIX monitors tomcat, preferring to open a java poller on the zabbix server and the zabbix_java process. When zabbix_java is turned on, it is equivalent to opening a JavaGateway with port 10052. Finally, it is necessary to open port 8888 on the Tomcat server to provide data output.
Therefore, zabbix monitors the tomcat data acquisition process, as shown in the following figure: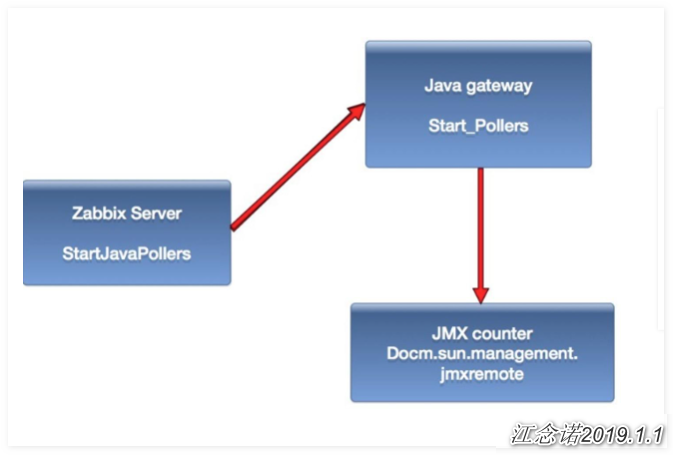
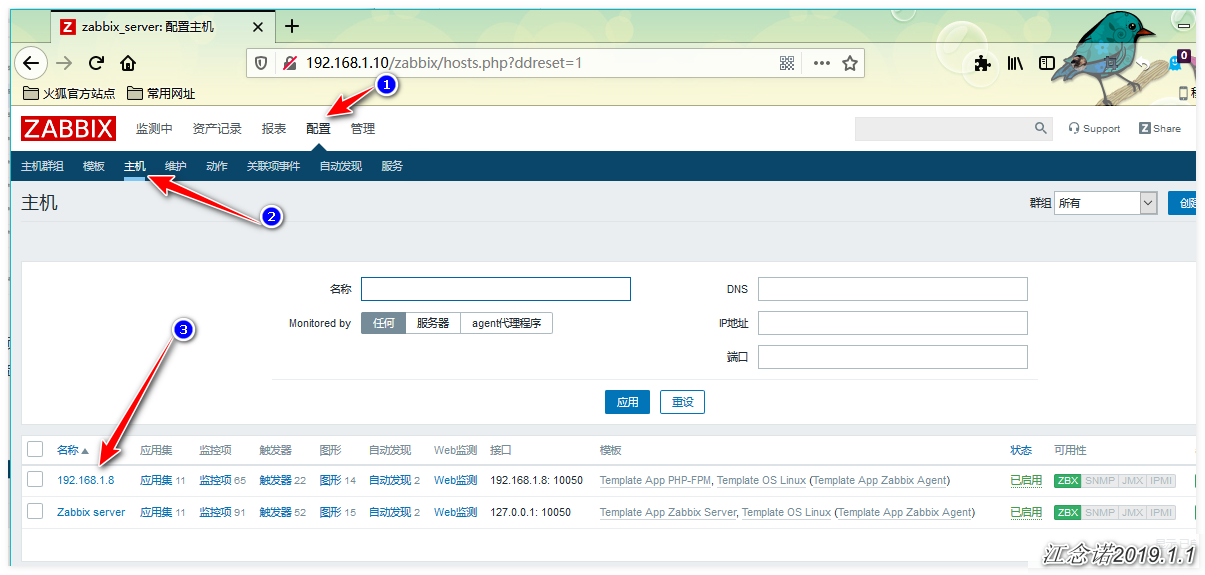
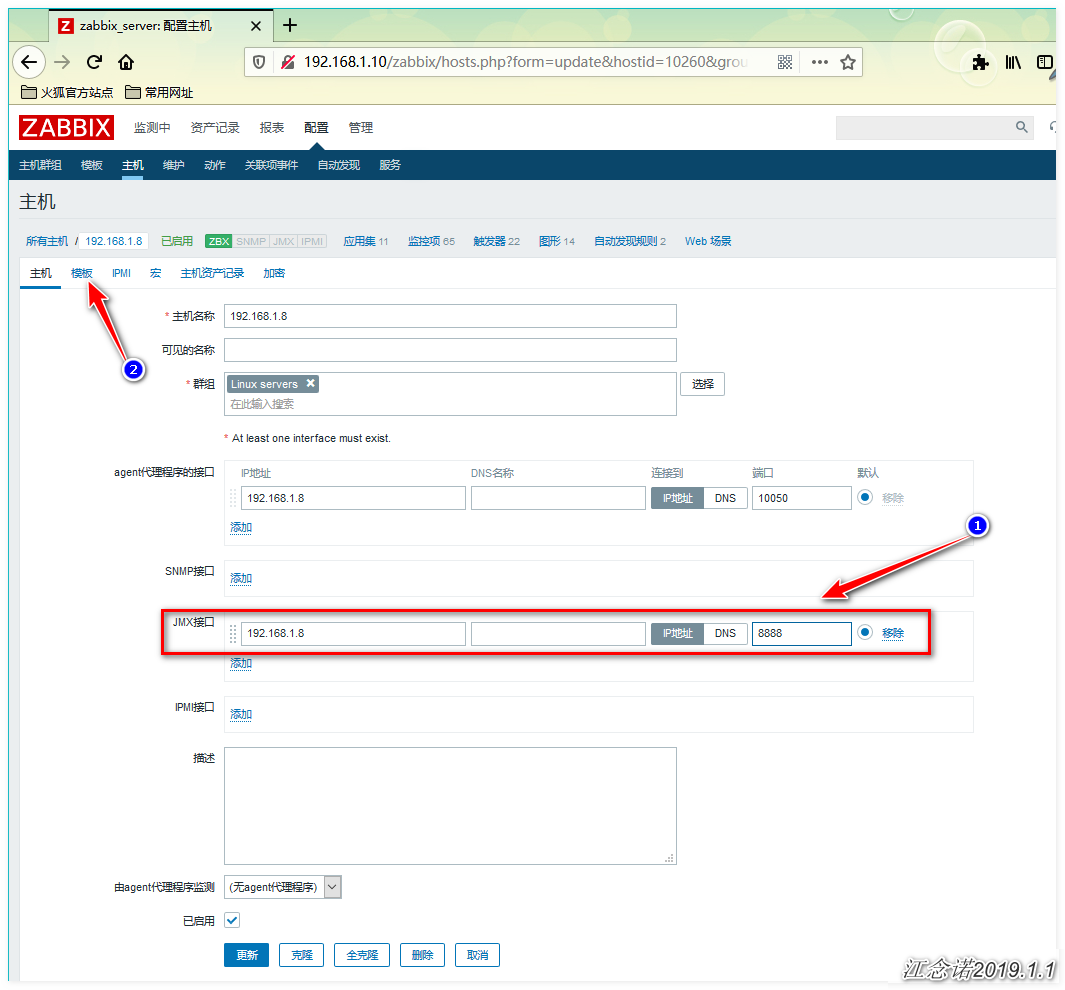
1) Install and configure Tomcat JMX
[root@agent ~]# java -version
openjdk version "1.8.0_161"
OpenJDK Runtime Environment (build 1.8.0_161-b14)
OpenJDK 64-Bit Server VM (build 25.161-b14, mixed mode)
[root@agent ~]# wget http://mirror.bit.edu.cn/apache/tomcat/tomcat-8/v8.5.50/bin/apache-tomcat-8.5.50.tar.gz
[root@agent ~]# tar zxf apache-tomcat-8.5.50.tar.gz
[root@agent ~]# mv apache-tomcat-8.5.50 /usr/local/tomcat
sed -i '308a CATALINA_OPTS=" $CATALINA_OPTS  -Dcom.sun.management.jmxremote  -Dcom.sun.management.jmxremote.port=8888 -Dcom.sun.management.jmxremote.ssl=false  -Djava.rmi.server.hostname=192.168.1.8  -Dcom.sun.management.jmxremote.authenticate=flase" ' /usr/local/tomcat/bin/catalina.sh
//You must ensure that the content is inserted in the following places (two #numbers)
# ----- Execute The Requested Command -----------------------------------------
CATALINA_OPTS=" $CATALINA_OPTS  -Dcom.sun.management.jmxremote  -Dcom.sun.management.jmxremote.port=8888 -Dcom.sun.management.jmxremote.ssl=false  -Djava.rmi.server.hostname=192.168.1.8  -Dcom.sun.management.jmxremote.authenticate=flase"

# Bugzilla 37848: only output this if we have a TTY
//Add content: IP is Tomcat's native IP, port "8888" can be customized, do not conflict!
[root@agent ~]# /usr/local/tomcat/bin/startup.sh //Start Tomcat service
[root@agent ~]# ss -lnt | grep 8080
LISTEN     0      100         :::8080                    :::*
[root@agent ~]# ss -lnt | grep 8888
LISTEN     0      50          :::8888                    :::*
2) Configure zabbix server and add java support
By default, ZABBIX servers are generally not supported with java, so to have ZABBIX monitor tomcat, you need to turn on ZABBIX monitor java's dedicated service zabbix-java.
Note that before enabling java monitoring support, you need to install JDK on the zabbix server server and set up JAVA_HOME to allow the system to recognize the path to jdk.
On the zabbix server, to compile and install the zabbix server, you need to add "--enable-java" to support jmx monitoring. If the previous zabbix server did not add this option at compile time, you will need to recompile the installation with the following compiled parameters:
./configure --prefix=/usr/local/zabbix --with-mysql --with-net-snmp --with-libcurl --enable-server --enable-agent --enable-proxy --enable-java --with-libxml2
If you don't want to recompile, you can also download the corresponding rpm package. This post is installed by downloading rpm.
[root@zabbix ~]# wget https://repo.zabbix.com/zabbix/4.0/rhel/7/x86_64/zabbix-java-gateway-4.0.0-2.el7.x86_64.rpm
[root@zabbix ~]# rpm -ivh zabbix-java-gateway-4.0.0-2.el7.x86_64.rpm
[root@zabbix ~]# /usr/sbin/zabbix_java_gateway
[root@zabbix ~]# ss -lnt | grep 10052
LISTEN     0      50          :::10052                   :::*
[root@zabbix ~]# vim /usr/local/zabbix/etc/zabbix_server.conf
//Modify the following
JavaGateway=127.0.0.1
JavaGatewayPort=10052
StartJavaPollers=5
[root@zabbix ~]# /etc/init.d/zabbix_server restart
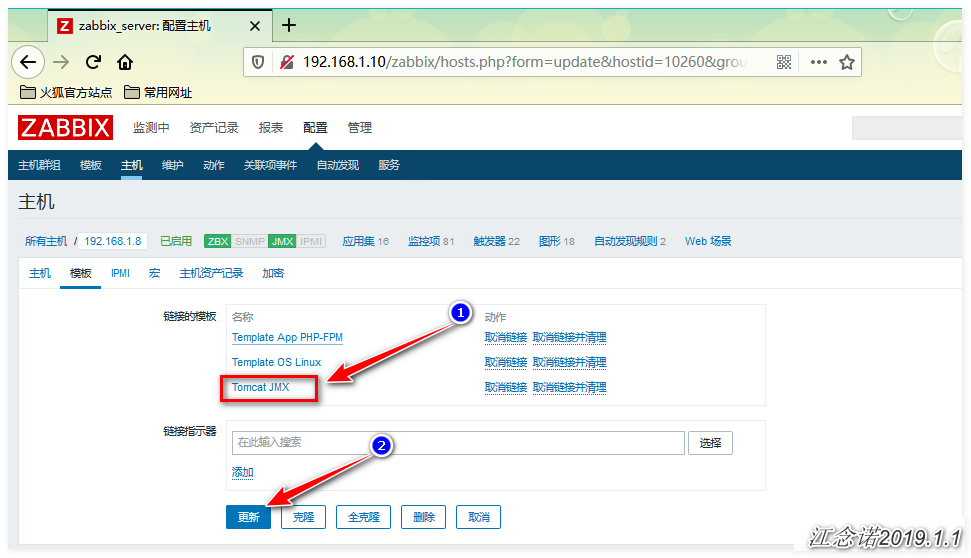
3) Zabbix web page configuration JMX monitoring
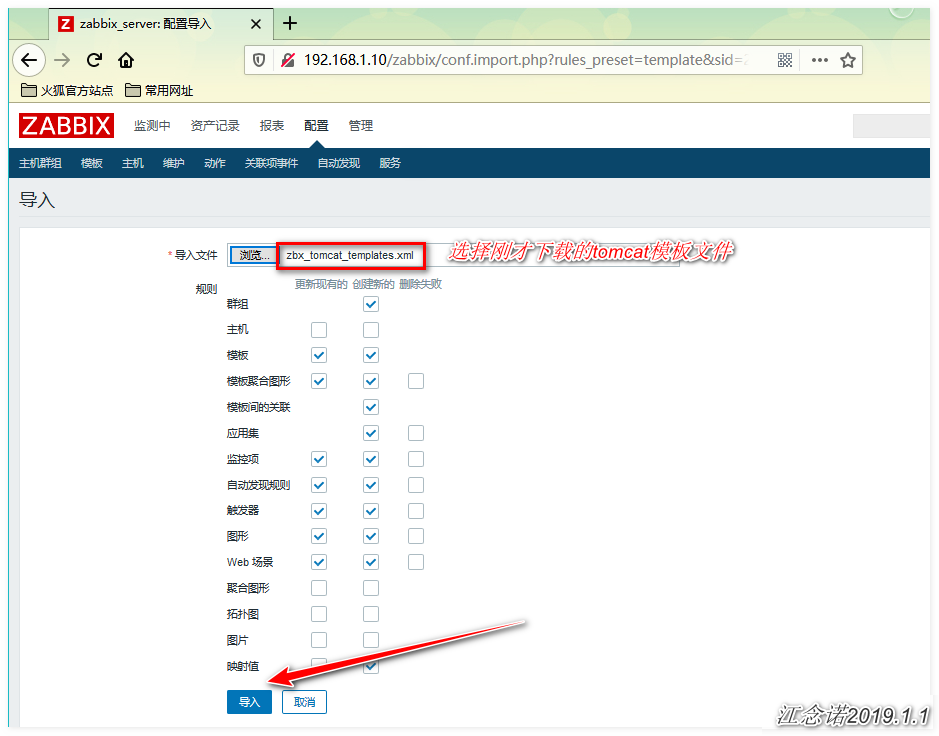
zabbix comes with tomcat's monitoring template by default, but there is a problem with the template by default. It is recommended to download the Tomcat template file at the following address.
[root@zabbix ~]# wget https://www.ixdba.net/zabbix/zbx_tomcat_templates.zip
[root@zabbix ~]# unzip zbx_tomcat_templates.zip
[root@zabbix ~]# ll zbx_tomcat_templates.xml
-rw-r--r-- 1 root root 40030 11 September 9, 2018 zbx_tomcat_templates.xml
//This is the monitoring template file for tomcat
Next, start importing the template, as shown in the following figure: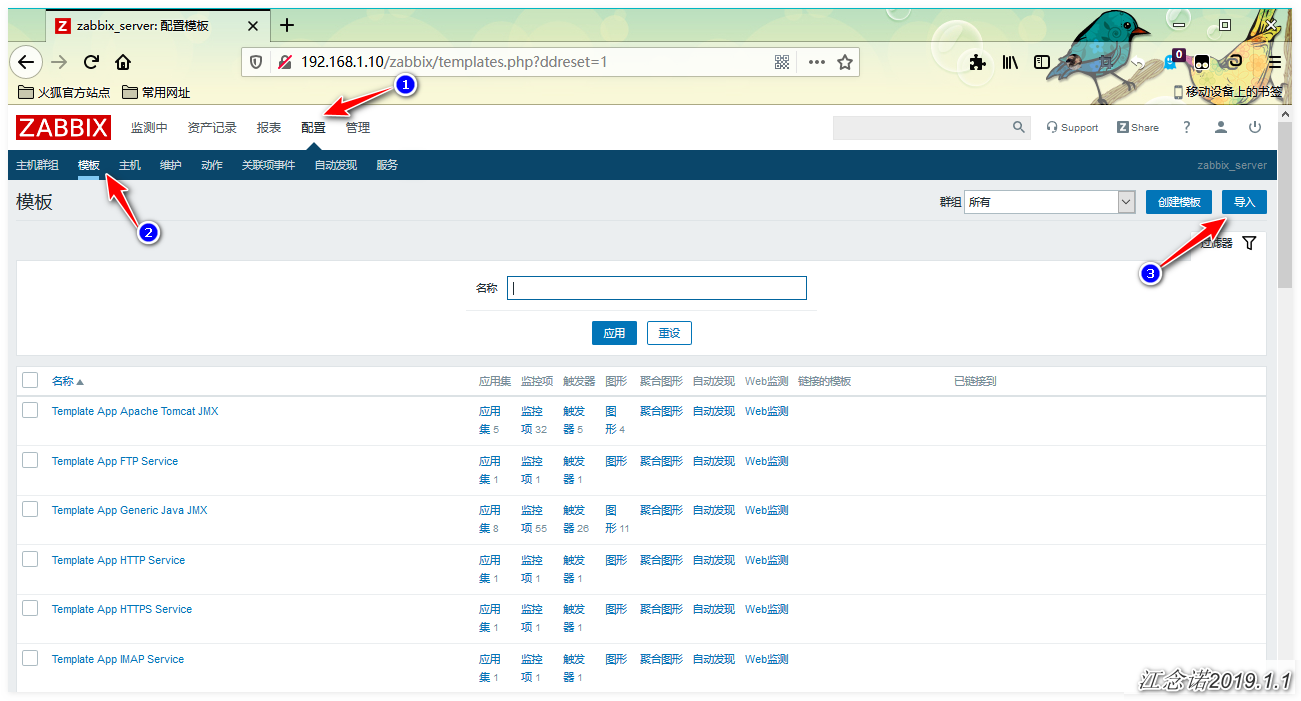
4) View tomcat monitoring status
Figure: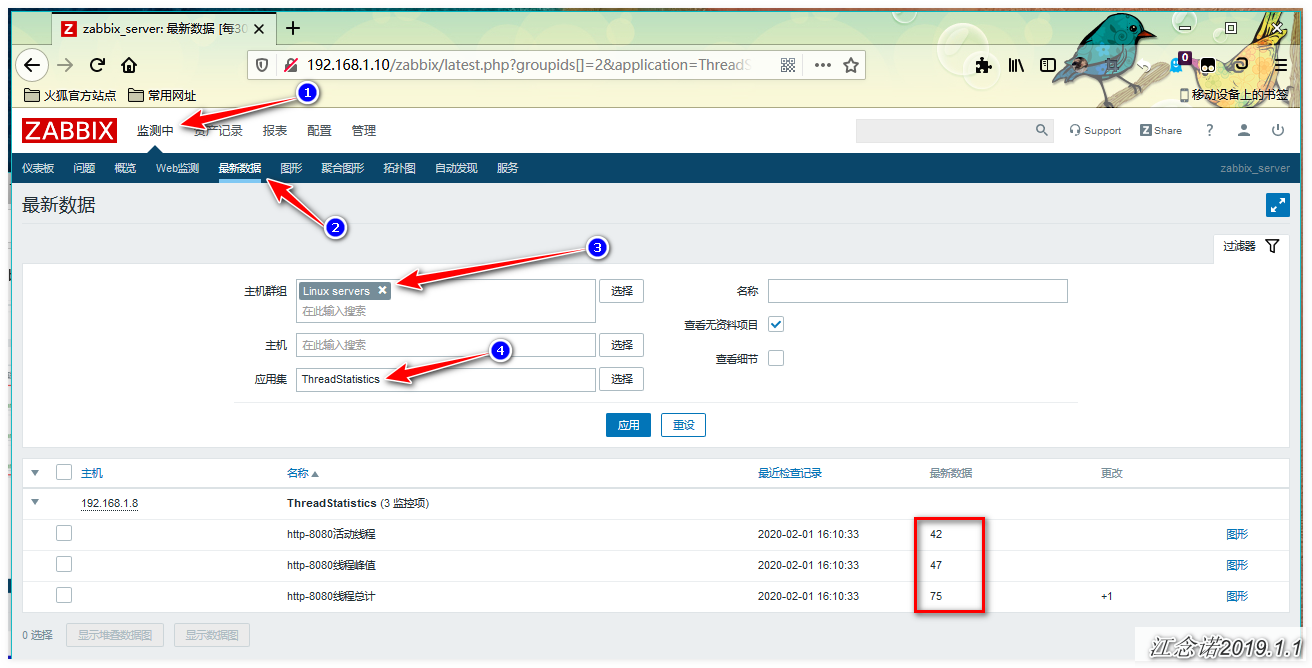
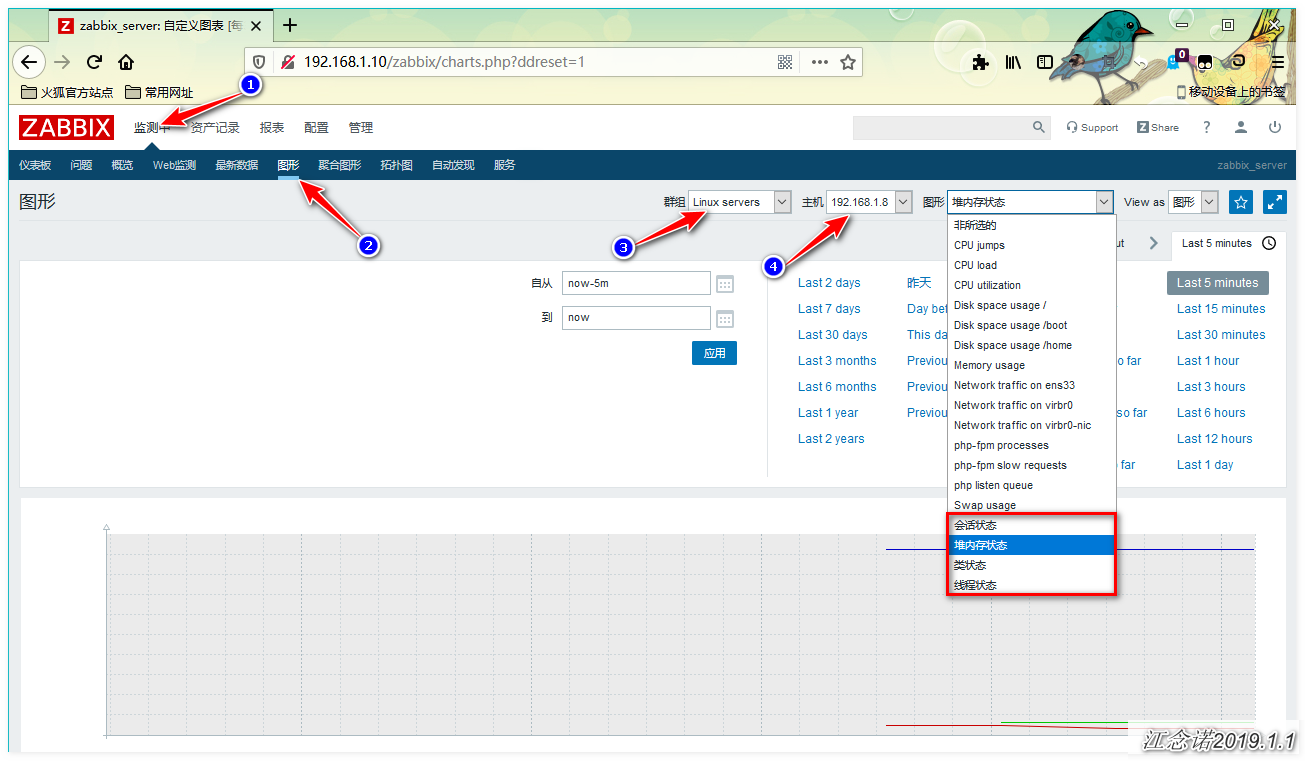
You can see from the diagram that the data is already available!
Configuring tomcat monitoring is complete!
3. zabbix monitoring Redis instance application
Redis has its own redis-cli client, through the redis info command you can query the operating status of redis, so the monitoring of redis by ZABBIX is to log in to redis through the client redis-cli, and then get the status data according to the info command. Based on this idea, we can write a script, and then call this script by zabbix, which will achieve the redis ofMonitor.
1) Install redis
[root@agent ~]# wget http://download.redis.io/releases/redis-5.0.7.tar.gz
[root@agent ~]# tar zxf redis-5.0.7.tar.gz
[root@agent ~]# cd redis-5.0.7/
[root@agent redis-5.0.7]# make && make install
[root@agent redis-5.0.7]# cd utils/
[root@agent utils]# ./install_server.sh
2) Use of info command in redis
To get the current state of redis, you can log in to the redis command line with the reids-cli tool and view it with the info command.
The redis-cli command format:
redis-cli -h [hostname or ip] -p [port] -a [password] info [parameter]
Common and optional parameters are:
1) General information about server:redis server;
2) clients: information about client connections;
3) Memory: Information about memory consumption;
4) persistence: information about RDB and AOF;
5) stats: general statistics;
6) replication: information about master-slave replication;
7) Statistics of CPu: CPU consumption;
8) Statistics of commandstas:redis commands;
9) Cluster:redis cluster related information;
10) keyspace: database-related statistics;
11) all: return all server information;
12) default: return only the default set of information;
Examples:
[root@agent ~]# redis-cli -h 127.0.0.1 -p 6379 info server
//Query information for redis server
# Server
redis_version:5.0.7
redis_git_sha1:00000000
redis_git_dirty:0
redis_build_id:97e1d29a41ca6e28
redis_mode:standalone
os:Linux 3.10.0-862.el7.x86_64 x86_64
arch_bits:64
multiplexing_api:epoll
atomicvar_api:atomic-builtin
gcc_version:4.8.5
process_id:109646
run_id:b2c500cea4663f4c3585748ed90eb79081daefff
tcp_port:6379
uptime_in_seconds:682
uptime_in_days:0
hz:10
configured_hz:10
lru_clock:3488956
executable:/usr/local/bin/redis-server
config_file:/etc/redis/6379.conf
The meaning of each option for output information is as follows:
1) the version information of the redis_version:redis server;
2)redis_git_sha1: Git SHA1;
3)redis_git_dirty: Git dirty flag;
4) host operating system of os:redis server;
5) arch_bits: Architecture (32-bit or 64-bit);
6) Event handling mechanism used by multiplexing_api:redis;
7) gcc_version: The version of GCC used when compiling reids;
8) process_id: PID of the server process;
9) run_id:random identifier for the redis server (for Sentinel and clusters);
10) tcp_port: TCP/IP listening port;
11) uptime_in_seconds: seconds since the redis server was started;
12) uptime_in_day: The number of days that have passed since the redis server was started;
13) lru_clock: A self-increasing clock in minutes for LRU management;
[root@agent ~]# redis-cli -h 127.0.0.1 -p 6379 info memory
//Query memory usage
# Memory
used_memory:853304
used_memory_human:833.30K
used_memory_rss:2699264
used_memory_rss_human:2.57M
used_memory_peak:854320
used_memory_peak_human:834.30K
used_memory_peak_perc:99.88%
used_memory_overhead:841078
used_memory_startup:791384
used_memory_dataset:12226
used_memory_dataset_perc:19.74%
allocator_allocated:1075920
allocator_active:1413120
allocator_resident:3993600
total_system_memory:1910050816
total_system_memory_human:1.78G
used_memory_lua:37888
used_memory_lua_human:37.00K
used_memory_scripts:0
used_memory_scripts_human:0B
number_of_cached_scripts:0
maxmemory:0
maxmemory_human:0B
maxmemory_policy:noeviction
allocator_frag_ratio:1.31
allocator_frag_bytes:337200
allocator_rss_ratio:2.83
allocator_rss_bytes:2580480
rss_overhead_ratio:0.68
rss_overhead_bytes:-1294336
mem_fragmentation_ratio:3.41
mem_fragmentation_bytes:1907864
mem_not_counted_for_evict:0
mem_replication_backlog:0
mem_clients_slaves:0
mem_clients_normal:49694
mem_aof_buffer:0
mem_allocator:jemalloc-5.1.0
active_defrag_running:0
lazyfree_pending_objects:0
The meaning of each option of the output:
1) used_memory: The total amount of memory allocated by the redis allocator in bytes;
2) used_memory_human: Returns the total amount of redis allocated memory in a human readable format;
3) used_memory_rss: Returns the total amount of memory (commonly referred to as the size of the resident set) redis allocated from the operating system perspective.This value is consistent with the output of top, ps, and other commands;
4) peak memory consumption in bytes for used_memory_peak:redis;
5) used_memory_peak_human: Returns the peak memory consumption of redis in a human-understandable way;
6) used_memory_lua: The size of memory (in bytes) used by the Lua engine;
7) ratio between mem_fragmentation_ratio:used_memory_rss and used_memory;
8) mem_allocator: The memory allocator used by redis as specified at compile time.libc, jemalloc, tcmalloc when possible;
[root@agent ~]# redis-cli -h 127.0.0.1 -p 6379 info clients
//Query client connection
# Clients
connected_clients:1
client_recent_max_input_buffer:0
client_recent_max_output_buffer:0
blocked_clients:0
The meaning of each option of the output:
1) connected_clients: The number of connected clients (excluding those connected through dependent servers);
2) client_recent_max_input_buffer: the largest input cache among currently connected clients;
3) client_recent_max_output_buffer: the largest output cache among currently connected clients;
4) client_recent_output_list: The largest output list of currently connected clients;
5) blocked_clients: The number of clients waiting for blocking commands (BLPOP, BRPOP, BRPOPLPUSH);
[root@agent ~]# redis-cli -h 127.0.0.1 -p 6379 info cpu
//View CPU usage
# CPU
used_cpu_sys:1.916430
used_cpu_user:2.779592
used_cpu_sys_children:0.000000
used_cpu_user_children:0.000000
The meaning of each option of the output:
1) System CPU consumed by used_cpu_sys:redis server;
2) User CPU consumed by used_cpu_use:redis server;
3) used_cpu_sys_children: System CPU consumed by background processes;
4) used_cpu_user_children: User CPU consumed by background processes;
[root@agent ~]# redis-cli -h 127.0.0.1 -p 6379 info Stats
//Query general statistics
# Stats
total_connections_received:8
total_commands_processed:7
instantaneous_ops_per_sec:0
total_net_input_bytes:200
total_net_output_bytes:8551
instantaneous_input_kbps:0.00
instantaneous_output_kbps:0.00
rejected_connections:0
sync_full:0
sync_partial_ok:0
sync_partial_err:0
expired_keys:0
expired_stale_perc:0.00
expired_time_cap_reached_count:0
evicted_keys:0
keyspace_hits:0
keyspace_misses:0
pubsub_channels:0
pubsub_patterns:0
latest_fork_usec:0
migrate_cached_sockets:0
slave_expires_tracked_keys:0
active_defrag_hits:0
active_defrag_misses:0
active_defrag_key_hits:0
active_defrag_key_misses:0
The meaning of each option of the output:
1) total_connections_received: The number of connection requests that the server has received;
2) total_commands_processed: The number of commands executed by the server;
3) instantaneous_ops_per_sec: The number of commands executed by the server per second;
4) rejected_connections: The number of connection requests rejected because of the maximum number of clients limit;
5) expired_keys: The number of database keys that were automatically deleted because they expired;
6) evicted_keys: The number of keys caught because of the maximum internal capacity limit;
7) keyspace_hits: The number of times a database key has been found successfully;
8) keyspace_misses: Number of failures to find database keys;
9) pubsub_channels: the number of channels currently subscribed to;
10) pubsub_patterns: Number of patterns currently being subscribed to;
11) latest_fork_usec: The number of milliseconds the last fork() operation took;
[root@agent ~]# redis-cli -h 127.0.0.1 -p 6379 info Replication
//Query redis master-slave replication information
# Replication
role:master
connected_slaves:0
master_replid:b6c25ae1598c2460bb30e45139823e08ff5116a4
master_replid2:0000000000000000000000000000000000000000
master_repl_offset:0
second_repl_offset:-1
repl_backlog_active:0
repl_backlog_size:1048576
repl_backlog_first_byte_offset:0
repl_backlog_histlen:0
The meaning of each option of the output:
1) role: If the current server is not replicating any server, the value of this field is master; otherwise, the value of this field is slave.Note that when creating a replication chain, one slave server may also be the master server of another server;
2) connected_slaves: The number of Redis slaves connected;
3) master_repl_offset: global replication offset;
4) repl_backlog_active: A flag indicating whether the redis server has turned on the replication backup log function for partial synchronization;
5) repl_backlog_size: Indicates the size of the backlog, which is a buffer that stores data to be synchronized to the slave when the slave side is disconnected, so when a slave is reconnected, full synchronization is often not required, local synchronization is sufficient!The larger the backlog setting, the longer the slave can be disconnected;
6) repl_backlog_first_byte_offse: The copy offset of the first byte of the backup log buffer;
7) repl_backlog_histlen: The actual data length of the backup log;
3) Write scripts and templates to monitor redis status
The script code is large and can be downloaded as follows:
[root@agent ~]# wget https://www.ixdba.net/zabbix/zbx-redis-template.zip
[root@agent ~]# unzip zbx-redis-template.zip
[root@agent ~]# ll redis_status zbx-redis-template.xml
-rw-r--r-- 1 root root  3968 11 January 11, 2018 redis_status
-rw-r--r-- 1 root root 46397 11 September 9, 2018 zbx-redis-template.xml
//redis_status: Script to monitor redis status
//zbx-redis-template.xml: template file for monitoring redis status
[root@agent ~]# mkdir /etc/zabbix/shell
[root@agent ~]# mv redis_status /etc/zabbix/shell/
[root@agent ~]# chmod 755 /etc/zabbix/shell/redis_status
[root@agent ~]# chown zabbix.zabbix /etc/zabbix/shell/redis_status
//Delete the password field used in the script yourself
//Change the storage path of the reids-cli tool
[root@agent ~]# /etc/zabbix/shell/redis_status used_memory
853304
//Test whether scripts are available
4) Modify configuration on zabbix agent side
[root@agent ~]# vim /etc/zabbix/zabbix_agentd.d/userparameter_redis.conf
UserParameter=Redis.Info[*],/etc/zabbix/shell/redis_status $1 $2
UserParameter=Redis.Status,/usr/local/bin/redis-cli -h 127.0.0.1 -p 6379 ping | grep -c PONG
[root@agent ~]# systemctl restart zabbix-agent
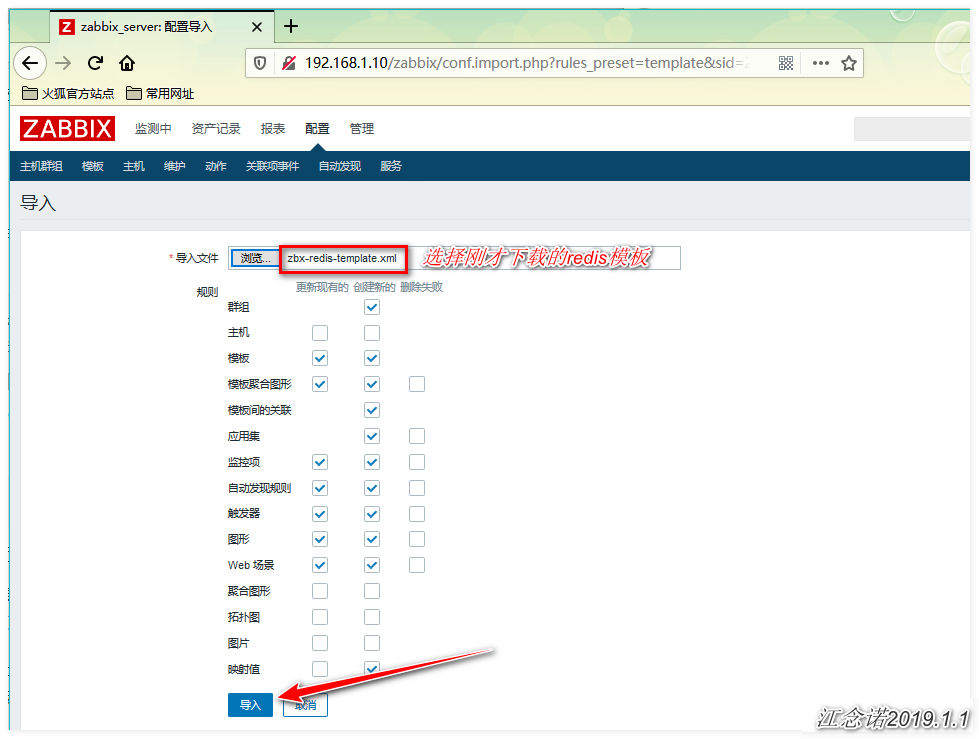
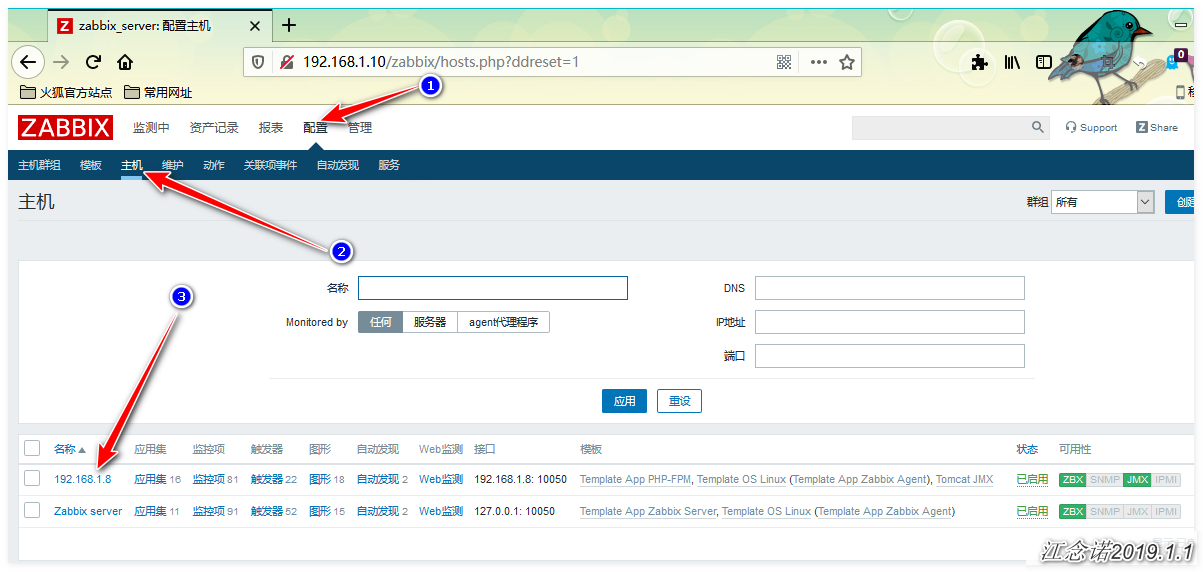
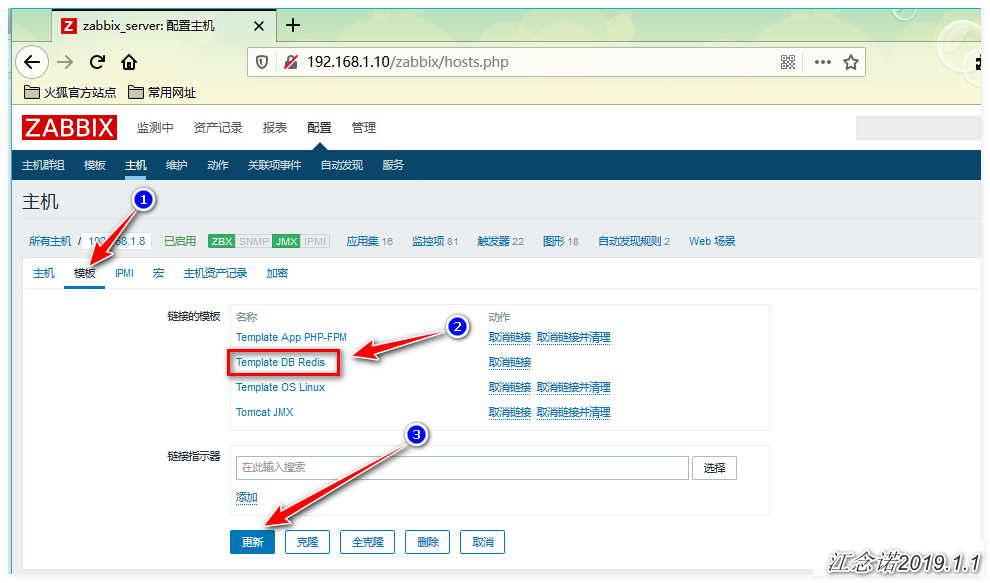
5) zabbix web interface import template
Figure: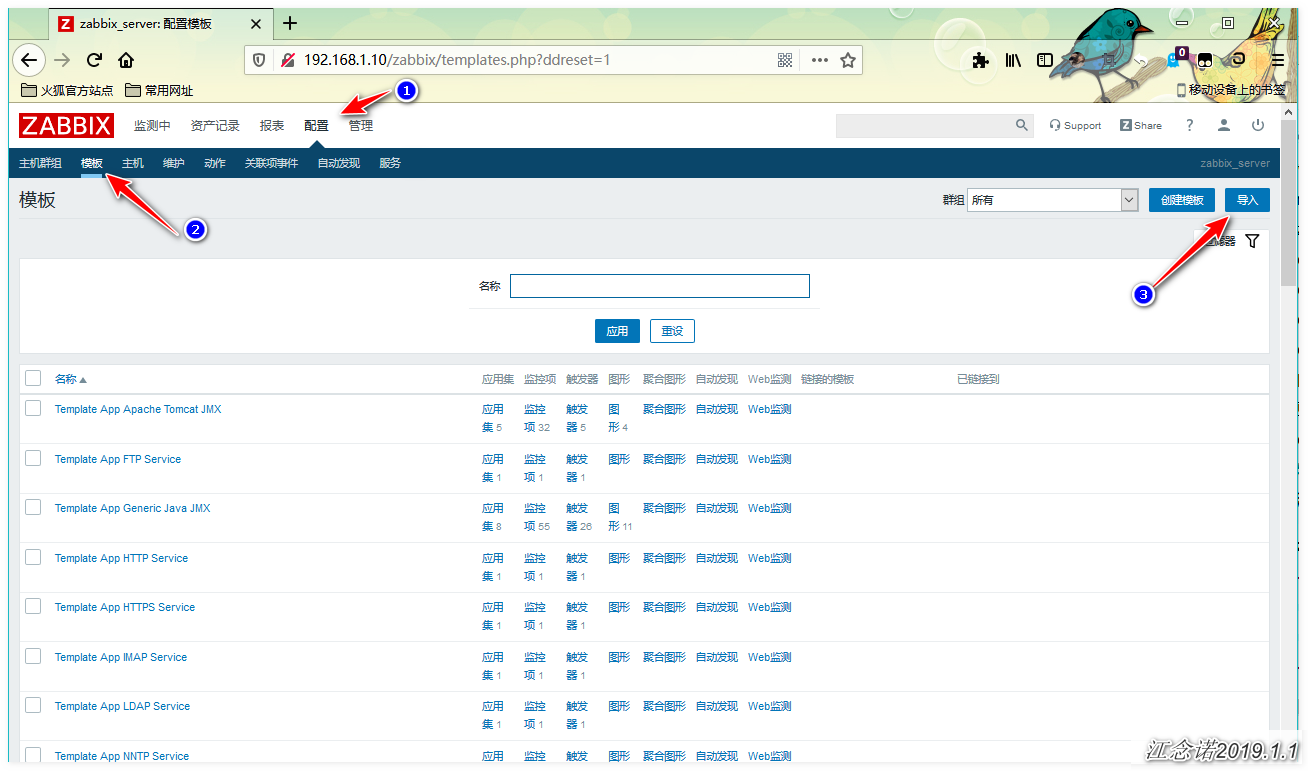
6) View redis monitoring status
Figure: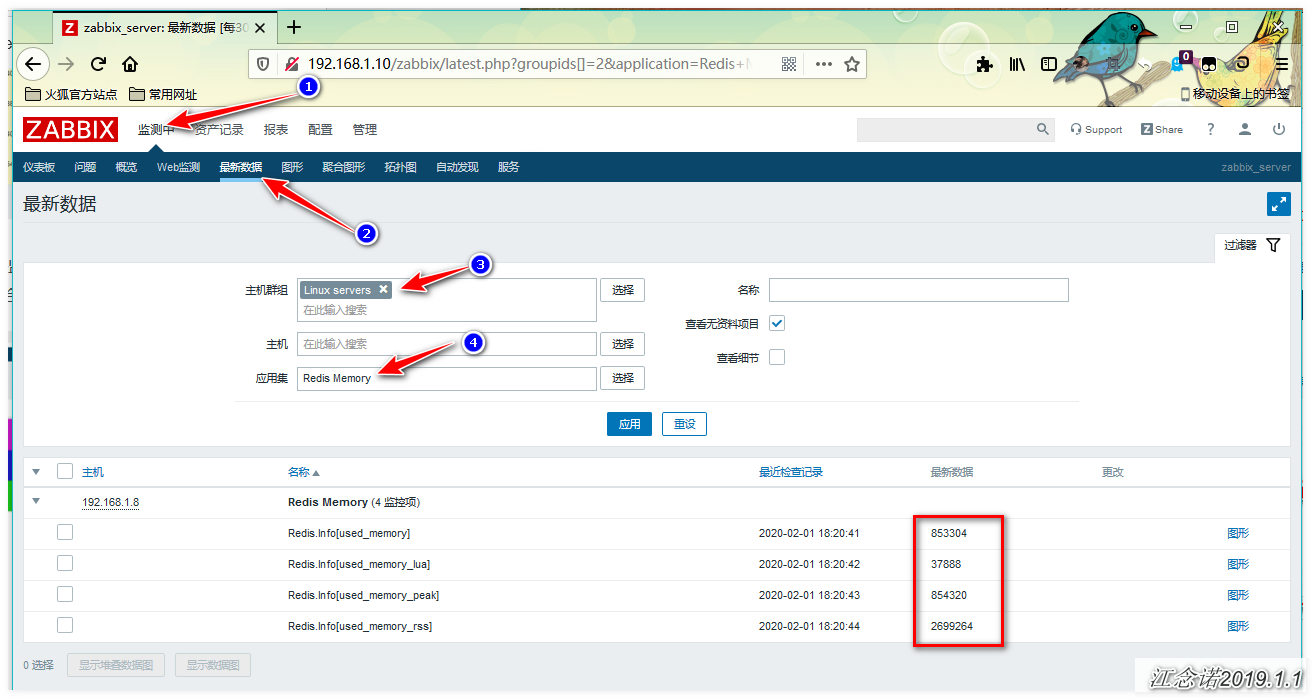
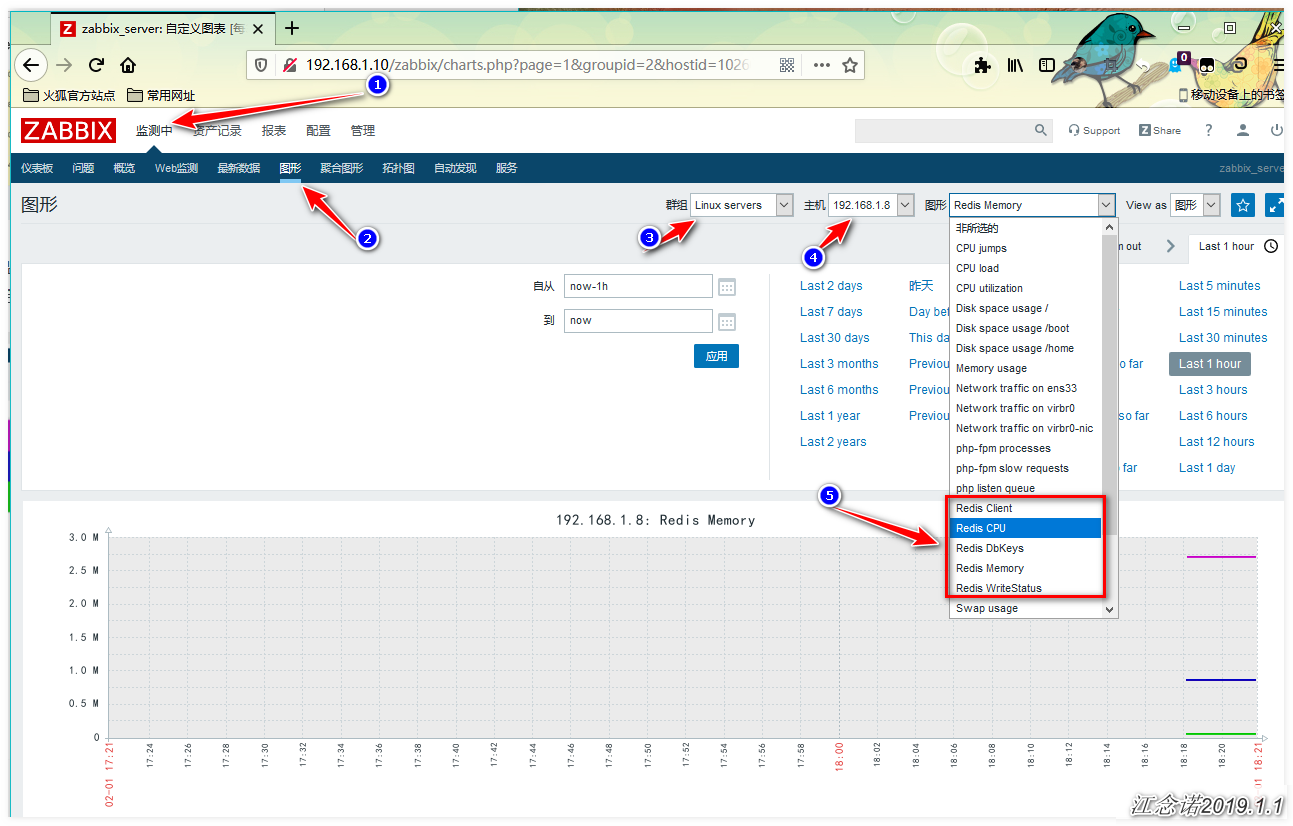
You can see from the diagram that the data is already available!
Configuration reidst monitoring complete!
This is the end of this blog. Thank you for reading it.