The following operations are performed on the ZABBIX agent side:
- Initialize (execute script)
sh init.sh
- httpd installation and startup (binary)
yum install -y httpd* #Install httpd
systemctl start httpd.service;systemctl enable httpd.service #Service startup and startup
ss -ant |grep :80 #Check whether the 80 of httpd is up
LISTEN     0      128          *:10050                    *:*                   users:(("zabbix_agentd",pid=16735,fd=4),("zabbix_agentd",pid=16734,fd=4),("zabbix_agentd",pid=16733,fd=4),("zabbix_agentd",pid=16732,fd=4),("zabbix_agentd",pid=16731,fd=4),("zabbix_agentd",pid=16730,fd=4))
LISTEN     0      128         :::10050                   :::*                   users:(("zabbix_agentd",pid=16735,fd=5),("zabbix_agentd",pid=16734,fd=5),("zabbix_agentd",pid=16733,fd=5),("zabbix_agentd",pid=16732,fd=5),("zabbix_agentd",pid=16731,fd=5),("zabbix_agentd",pid=16730,fd=5))
Add the following code at the end of / etc/httpd/conf/httpd.conf
ExtendedStatus On
<location /server-status>
   SetHandler server-status
   Order Allow,Deny
   Allow from all
</location>
systemctl restart httpd.service #Restart the service after modifying the configuration file
#Execute the following command to see if status is configured successfully
/usr/bin/curl --insecure --silent --location http://localhost/server-status?auto
Total Accesses: 146
Total kBytes: 97
Uptime: 226
ReqPerSec: .646018
BytesPerSec: 439.504
BytesPerReq: 680.329
BusyWorkers: 1
IdleWorkers: 5
Scoreboard: _W____..........................................................................................................................................................................................................................................................
-
Deploy ZABBIX agent
- One key deployment
- Step by step deployment:
-Configure ZABBIX repo
rpm -Uvh https://repo.zabbix.com/zabbix/3.4/rhel/7/x86_64/zabbix-release-3.4-1.el7.centos.noarch.rpm
-Install agent software
yum install zabbix-agent
-Modify the configuration to start the agent service
 vim /etc/zabbix/zabbix_agentd.conf
Server=192.168.122.105           //Passive mode ZABBIX server IP
ServerActive=192.168.122.105    //Active mode ZABBIX server IP
Hostname=Zabbix server         //The host name of the Agent, which is finally displayed on the monitoring page
UnsafeUserParameters=1        //Whether to restrict the use of special characters in user-defined keys
-Service startup and startup
systemctl start zabbix-agent
netstat -antp | grep agent
LISTEN     0      128          *:10050                    *:*                   users:(("zabbix_agentd",pid=16735,fd=4),("zabbix_agentd",pid=16734,fd=4),("zabbix_agentd",pid=16733,fd=4),("zabbix_agentd",pid=16732,fd=4),("zabbix_agentd",pid=16731,fd=4),("zabbix_agentd",pid=16730,fd=4))
LISTEN     0      128         :::10050                   :::*                   users:(("zabbix_agentd",pid=16735,fd=5),("zabbix_agentd",pid=16734,fd=5),("zabbix_agentd",pid=16733,fd=5),("zabbix_agentd",pid=16732,fd=5),("zabbix_agentd",pid=16731,fd=5),("zabbix_agentd",pid=16730,fd=5))
- configure snmp
yum -y install net-snmp net-snmp-utils
vim /etc/snmp/snmpd.conf
com2sec notConfigUser  192.168.122.105    public
access  notConfigGroup ""  any  noauth  exact  all none none
view all    included  .1    80
systemctl start snmpd;systemctl enable snmpd
ss -anup |grep snmp
UNCONN     0      0            *:161                      *:*                   users:(("snmpd",pid=4315,fd=6))
- Script to get status (script content:
cd /etc/zabbix
mkdir scripts
touch apache_status.sh
chomd +x apache_status.sh
While executing the script, check whether the script can get the value normally.
sh apache_status.sh TotalAccesses
37552
- Custom key
cd /etc/zabbix/zabbix_agentd.d
touch apache_status.conf
cat apache_status.conf
UserParameter=apache.status[*],/etc/zabbix/scripts/apache_status.sh $1
- Add monitoring items to zabbix

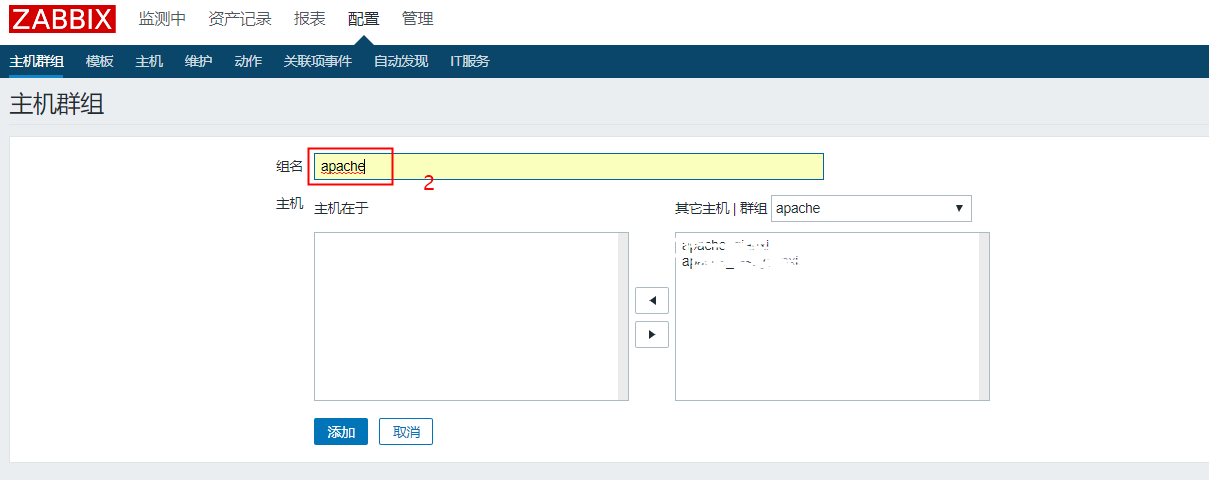

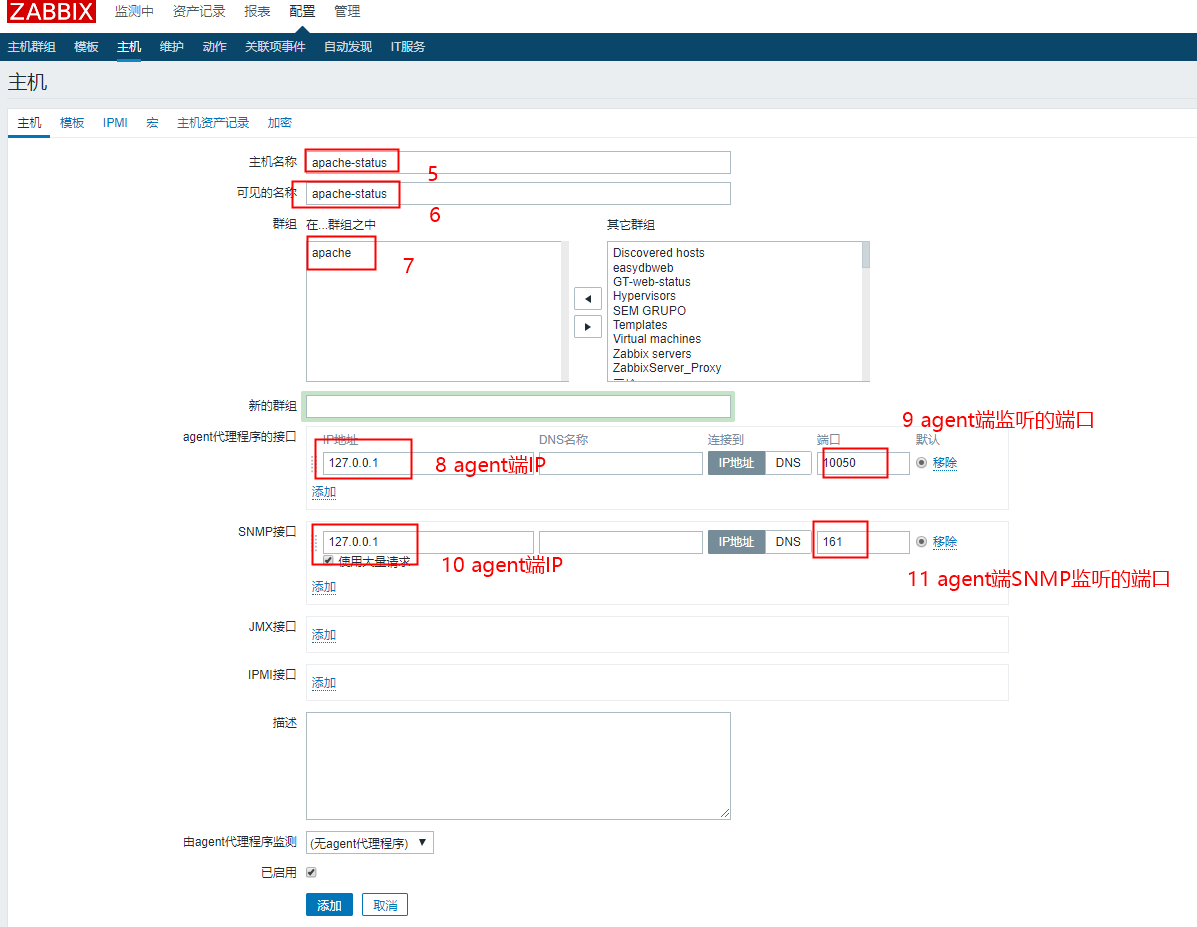
After creating a host, first check the status of the host. If it is green, it is normal. If it is red or gray, you need to troubleshoot.

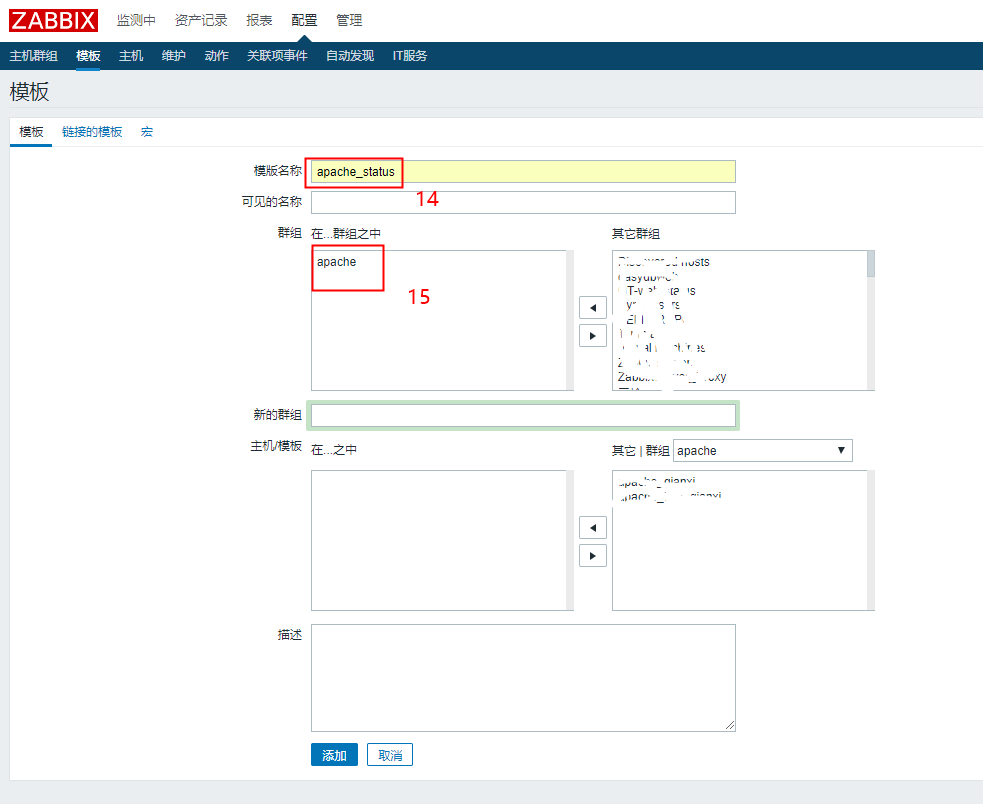


Add all the values obtained in the script as the monitoring items according to the figure above
Check whether the status is enabled. If not, check it.

If there is the latest data, the monitoring item is configured successfully.
Configure triggers according to business conditions.