(1) Introduction
1. Introduction to JMX
The full name of JMX is Java Management Extensions (Java Management Extensions), which is a framework for implanting management functions for applications, devices, systems, etc. JMX can flexibly develop seamlessly integrated systems, networks and service management across a range of heterogeneous operating system platforms, system architectures, and network transport protocols.Use).Java programs open ports to get health.Zabbix 2.0 started with a built-in capability to monitor JMX called the Zabbix Java Gateway, which starts a process called the Zabbix Java Gateway on Zabbix Server and Zabbix Proxy. When JMX data is needed, Zabbix Server "asks" the JMX Gateway, and then JMX Gateway queries the data it needs based on the JMX management API.When using Java programs, you don't need to add anything new to your code; you just need to add some JVM parameters at startup so that it can support monitoring JMX using ports.
2. Monitoring Principle: When Zabbix-Server needs to know a performance of a Java application, it starts its own Zabbix-JavaPollers process to connect to Zabbix-JavaGateway requesting data, and ZabbixJavagateway receives the request and uses the JMXmanagement API to query a specific application, provided that the application requires'-Dcom.sun.management.jmxremo'when it startsTe"parameter to open JMX remote queries.The Java program starts its own simple applet port 12345 to provide the requested data to Zabbix-JavaGateway.
From the schematic diagram above, you can see that the key points to configuring Zabbix monitoring Java applications are configuring Zabbix-JavaGateway, enabling Zabbix-Server to connect to Zabbix-JavaGateway, Tomcat to turn on JVM remote monitoring capabilities, and so on.
3. Monitoring Architecture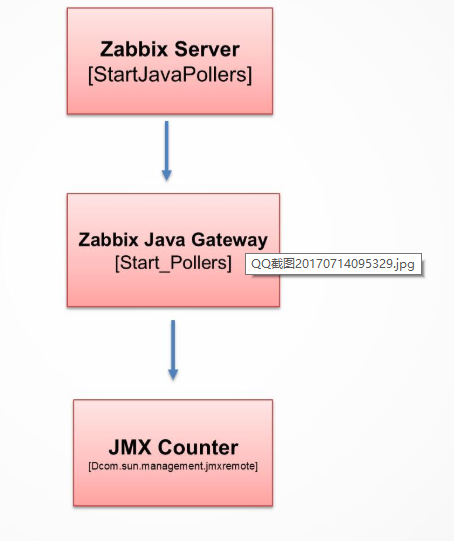
* (2) Installation services are required:
JDK Environment Deployment (omitted)
- zabbix-server side compile install Zabbix-Java-gateway option
- Modify the zabbix_server configuration file
- Restart zabbix_server
- Modify the startup file of the JAR package (agent side)
- Download the jar package for the corresponding JMX and verify it on the zabbix-server side
- Modify the template to modify it on the zabbix Web page
**
(3) Specific installation and configuration
1. JDK Environment Deployment (omitted)
2. Installation and configuration of Zabbix-Java-gateway
Method 1. Compile and install.Compilation is required with --enable-java to enable support for tomcat monitoring via JMX, see documentation on the site for zabbix server installation
./configure --prefix=/usr/local/zabbix --enable-server --enable-agent --with-mysql --enable-java --enable-ipv6 --with-net-snmp --with-libcurl --with-libxml2
Method 2. Direct installation of yum.
yum -y install zabbix-java-gateway
3. Modify zabbix java configuration
[root@zabbix-server ~]# vim /etc/zabbix/zabbix_server.conf

JavaGateway=172.19.152.247
JavaGatewayPort=10052
StartJavaPollers=5
4. Restart zabbix-server and see if the port is started
[root@zabbix-server ~]# systemctl restart zabbix-server
[root@zabbix-server ~]# systemctl status zabbix-server
● zabbix-server.service - Zabbix Server
   Loaded: loaded (/usr/lib/systemd/system/zabbix-server.service; enabled; vendor preset: disabled)
   Active: active (running) since 2 2019-05-21 15:03:20 CST; 8s ago
  Process: 5974 ExecStop=/bin/kill -SIGTERM $MAINPID (code=exited, status=0/SUCCESS)
  Process: 5977 ExecStart=/usr/sbin/zabbix_server -c $CONFFILE (code=exited, status=0/SUCCESS)
 Main PID: 5979 (zabbix_server)
   CGroup: /system.slice/zabbix-server.service
           ├─6067 /usr/sbin/zabbix_server: java poller #1 [got 0 values in 0.000018 sec, idle 5 sec]
           ├─6068 /usr/sbin/zabbix_server: java poller #2 [got 0 values in 0.000010 sec, idle 5 sec]
           ├─6069 /usr/sbin/zabbix_server: java poller #3 [got 0 values in 0.000016 sec, idle 5 sec]
           ├─6070 /usr/sbin/zabbix_server: java poller #4 [got 0 values in 0.000013 sec, idle 5 sec]
           ├─6071 /usr/sbin/zabbix_server: java poller #5 [got 0 values in 0.000011 sec, idle 5 sec]
[root@zabbix-server ~]# netstat -lntp|grep java tcp 0 0 0.0.0.0:8009 0.0.0.0:* LISTEN 3646/java tcp 0 0 0.0.0.0:8081 0.0.0.0:* LISTEN 3646/java tcp 2 0 127.0.0.1:32000 0.0.0.0:* LISTEN 2477/java tcp 0 0 172.19.152.247:10052 0.0.0.0:* LISTEN 8809/java tcp 0 0 127.0.0.1:8005 0.0.0.0:* LISTEN 3646/java
5. Monitored clients add JMX support.Add parameters to the startup script to turn on JMX
######## Add the following code before Execute The Requested Command (without authentication encryption):
 -Dcom.sun.management.jmxremote
 -Djava.rmi.server.hostname=172.19.195.148
 -Dcom.sun.management.jmxremote.port=10053
 -Dcom.sun.management.jmxremote.ssl=false
 -Dcom.sun.management.jmxremote.authenticate=false
Restart to see if the port is running
[appuser@preuser195147 ~]$ netstat -lntp|grep 10053
(Not all processes could be identified, non-owned process info
 will not be shown, you would have to be root to see it all.)
tcp        0      0 0.0.0.0:10053           0.0.0.0:*               LISTEN      25200/java
6. Download the jar package for the corresponding JMX (link: https://pan.baidu.com/s/1FzslYQZ7snw38EMDsh2c9A Extraction Code: g3ie), validated on the zabbix-server side
[root@zabbix-server opt]# cd /data/tomcat/
[root@zabbix-server tomcat]# java -jar cmdline-jmxclient-0.10.3.jar - 172.19.195.148:10053 java.lang:type=Memory NonHeapMemoryUsage
05/21/2019 17:15:55 +0800 org.archive.jmx.Client NonHeapMemoryUsage:
committed: 212074496
init: 2555904
max: 1862270976
used: 201090744
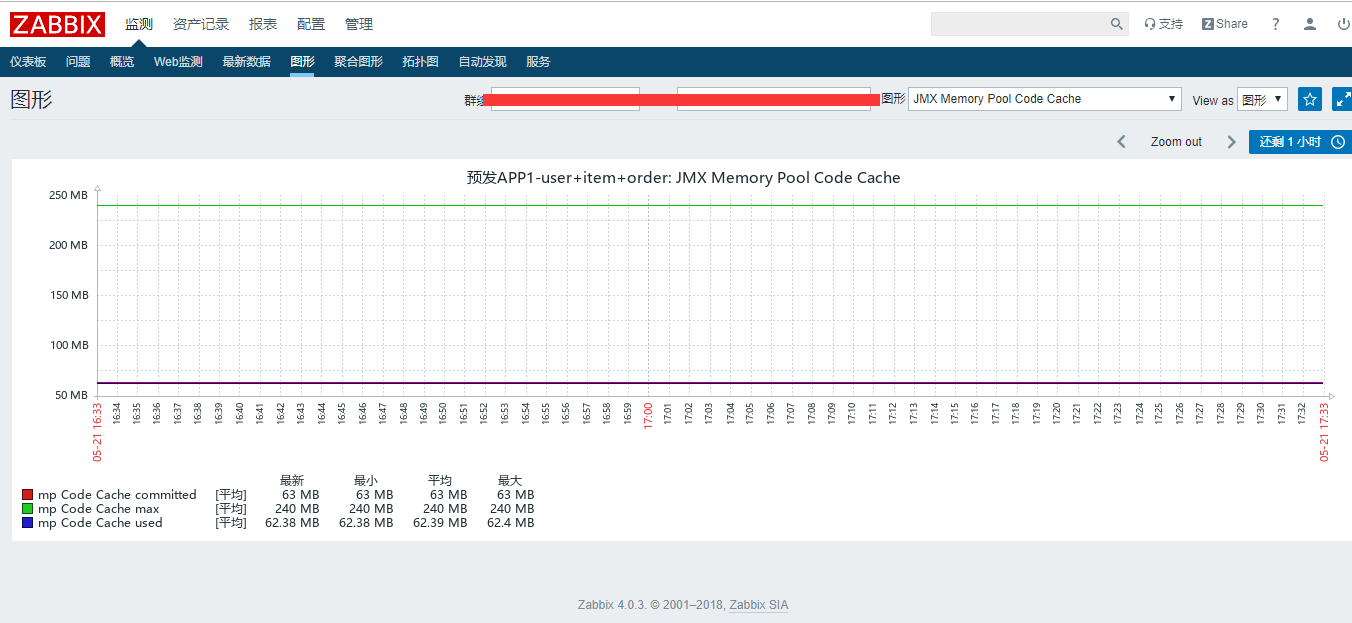
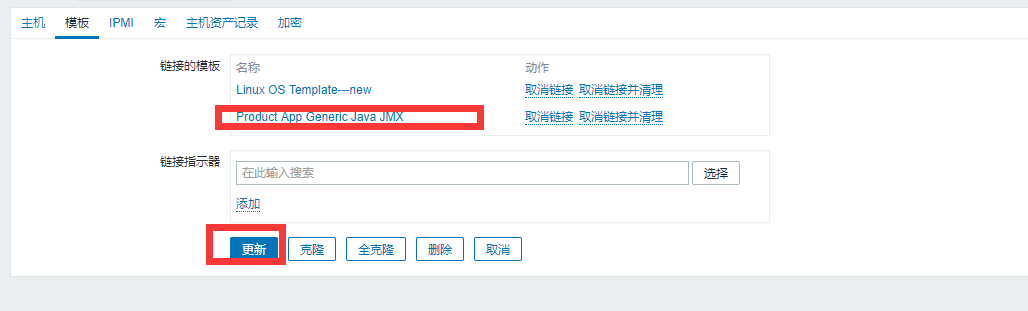
7. Import templates to add monitoring and monitoring.Host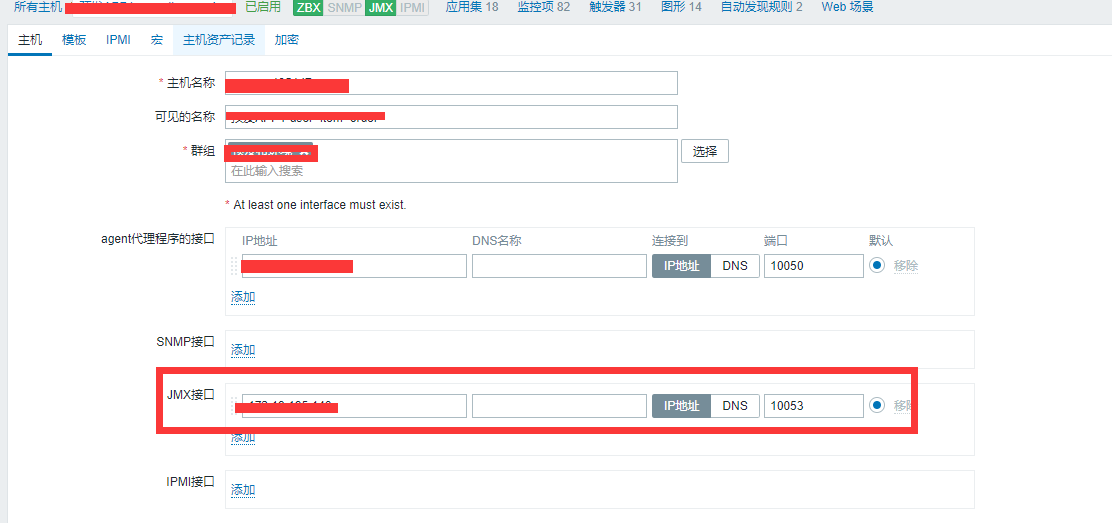
View monitoring graphics