4 - website log analysis cases - log data statistical analysis
1, Environment preparation and data import
1. Start hadoop
If it is enabled in a virtual environment such as lsn, you need to perform formatting first
hadoop namenode -format
Start Hadoop
start-dfs.sh
start-yarn.sh
Check to see if it starts
jps
2. Import data
Upload the data to the node where the hadoop cluster is located
Create hdfs directory
hadoop fs -mkdir -p /sx/cleandlog
Upload the data to hdfs and rename it log2015_ 05_ thirty
hadoop fs -put /home/ubuntu/Code/part-r-00000 /sx/log2015_05_30
2, Statistics with Hive
1.1 preparation: establish partition table
HIVE
In order to make statistical analysis with Hive, first we need to store the cleaned data in Hive, so we need to create a table first. Here we select the partition table and take the date as the partition index. The table creation statement is as follows: (the key here is to determine the mapped HDFS location. Here I am / project / techbbs / cleared, that is, the location where the cleaned data is stored)
hive>CREATE EXTERNAL TABLE logtable (ip string, atime string, url string) PARTITIONED BY (logdate string) ROW FORMAT DELIMITED FIELDS TERMINATED BY '\t' LOCATION '/sx/cleandlog';
After the partition table is established, you need to add a partition. The statement to add a partition is as follows: (this is mainly for the log of 20150530)
hive>ALTER TABLE logtable ADD PARTITION(logdate='2015_05_30') LOCATION '/sx/cleanedlog/2015_05_30';

hive>LOAD DATA INPATH '/sx/log2015_05_30' INTO TABLE logtable PARTITION (logdate ='2015_05_30');
1.2 use HQL to count key indicators
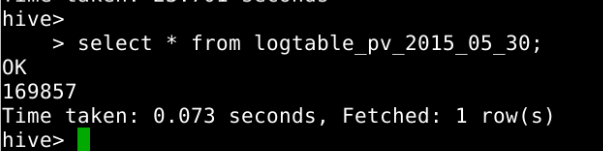
(1) One of the key indicators: PV volume
Page views are PV(Page View), which refers to the total number of pages viewed by all users. Every time an independent user opens a page, it is recorded once. Here, we only need to count the number of records in the log. The HQL code is as follows:
hive>CREATE TABLE logtable_pv_2015_05_30 AS SELECT COUNT(1) AS PV FROM logtable WHERE logdate='2015_05_30';

select * from logtable_pv_2015_05_30;
(2) Key indicator 2: number of registered users
The user registration page of the forum is member PHP, and when the user clicks register, the request is member php? Mod = URL of register. Therefore, we only need to count that the URL accessed in the log is member php? Mod = register, HQL code is as follows:
hive>CREATE TABLE logtable_reguser_2015_05_30 AS SELECT COUNT(1) AS REGUSER FROM logtable WHERE logdate='2015_05_30' AND INSTR(url,'member.php?mod=register')>0;

select * from logtable_reguser_2015_05_30;

(3) Key indicator 3: number of independent IP S
Within one day, the number of different independent IPS accessing the website is added. No matter how many pages the same IP accesses, the number of independent IPS is 1. Therefore, we only need to count the number of independent IPS processed in the log. In SQL, we can use the DISTINCT keyword, and in HQL, we can also use this keyword:
hive>CREATE TABLE logtable_ip_2015_05_30 AS SELECT COUNT(DISTINCT ip) AS IP FROM logtable WHERE logdate='2015_05_30';

select * from logtable_ip_2015_05_30 ;

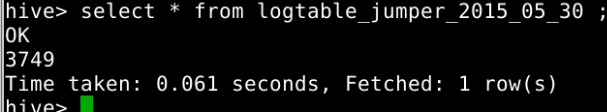
(4) Key indicator 4: number of users jumping out
The number of visits that leave the website after browsing only one page, that is, the number of visits that no longer visit after browsing only one page. Here, we can group through the user's IP. If there is only one record after grouping, it means that the user jumps out. Add the number of these users to get the number of jump out users. The HQL code is as follows:
hive>CREATE TABLE logtable_jumper_2015_05_30 AS SELECT COUNT(1) AS jumper FROM (SELECT COUNT(ip) AS times FROM logtable WHERE logdate='2015_05_30' GROUP BY ip HAVING times=1) e;

select * from logtable_jumper_2015_05_30 ;
PS: bounce rate refers to the percentage of visits that leave the website after browsing only one page in the total visits, that is, the visits that browse only one page / the summary of all visits. Here, we can get the jump out rate by the number of jump out users / PV obtained here.
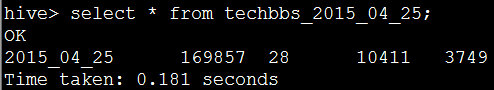
(5) Put all key indicators into a summary table so that they can be exported to MySQL through Sqoop
In order to facilitate the unified export to MySQL through Sqoop, we use a summary table to integrate the just counted results through table connection. The HQL code is as follows:
hive>CREATE TABLE logtable_2015_05_30 AS SELECT '2015_05_30', a.pv, b.reguser, c.ip, d.jumper FROM logtable_pv_2015_05_30 a JOIN logtable_reguser_2015_05_30 b ON 1=1 JOIN logtable_ip_2015_05_30 c ON 1=1 JOIN logtable_jumper_2015_05_30 d ON 1=1;

select * from logtable_2015_05_30 ;
Importing into MySQL using Sqoop and visual presentation will not be introduced. For details, please refer to
https://www.cnblogs.com/edisonchou/p/4464349.html
summary
This paper is the fourth part of the website log analysis case. Based on the data after MR cleaning, it is imported into HIVE and then statistically analyzed.