preface
The text and pictures of this article are from the Internet, only for learning and communication, and do not have any commercial use. The copyright belongs to the original author. If you have any questions, please contact us in time for handling.
Project background
2018 is known as the winter year of the Internet. Companies, big and small, have embarked on the road of layoffs, and some of them are more miserable and close their doors directly. In the first half of 2019, Oracle has laid off a large number of programmers who are about 35 years old! And inner OS: my mortgage has not been paid off yet....
Suppose you are the director of human resources, who should you start with? Answer the following questions first.
- How many employees are there in each department?
- What is the overall turnover rate?
- What is the average salary of employees?
- What is the average length of service of employees?
- Who are the three longest serving employees in the company?
- How satisfied are the employees?

data processing
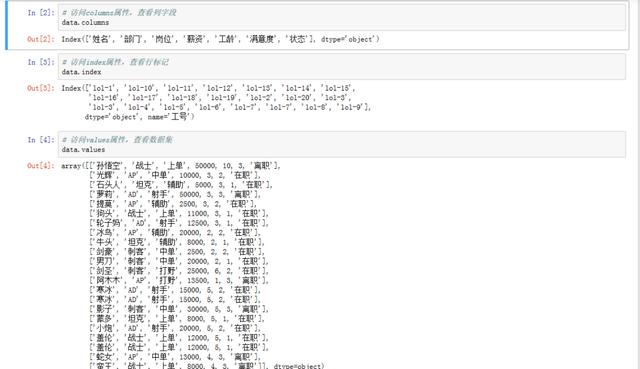
import pandas as pd
data = pd.read_excel(r'c:\Users\Administrator\Desktop\Heroic alliance employee information form.xlsx',index_col = u'Job No')
# visit columns Properties, view column fields
data.columns
# visit index Property, view row Tags
data.index
# visit values Properties, viewing datasets
data.values
# Add a bonus column of 20% of salary to the metadata set%
data[u'bonus'] = data[u'salary']*0.2
data[u'bonus'].head()
# loc Method to access the dataset based on the index column
idx = ['lol-1','lol-2','lol-3','lol-7']
data.loc[idx]
# Add a bonus column of 20% of salary to the metadata set%
data[u'bonus'] = data[u'salary']*0.2
data[u'bonus'].head()
# loc Method to access the dataset based on the index column
idx = ['lol-1','lol-2','lol-3','lol-7']
data.loc[idx]
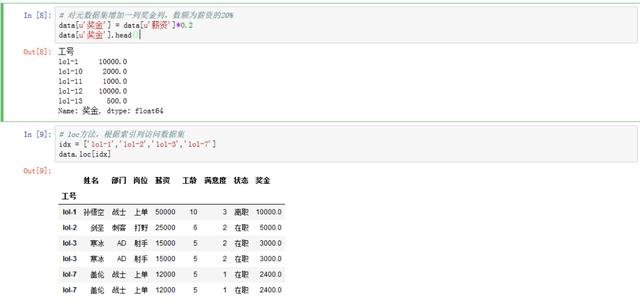
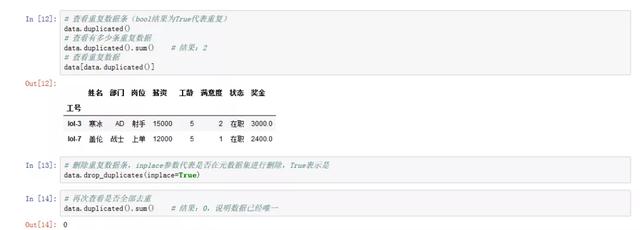
At this time, we found in the above results: cold ice and Galen are duplicate data bars. In the process of data analysis, we must pay attention to the impact of duplicate data, so we need to carry out the de duplication operation.
# View duplicate bars( bool The result is True Repeat on behalf of)
data.duplicated()
# See how many duplicate data there are
data.duplicated().sum()    # Result: 2
# View duplicate data
data[data.duplicated()]
# Delete duplicate data bars, inplace The parameter indicates whether to delete in the metadata set, True It means yes
data.drop_duplicates(inplace=True)
# Check again to see if they are all de duplicated
data.duplicated().sum()    # Result: 0, indicating that the data is unique
Data analysis
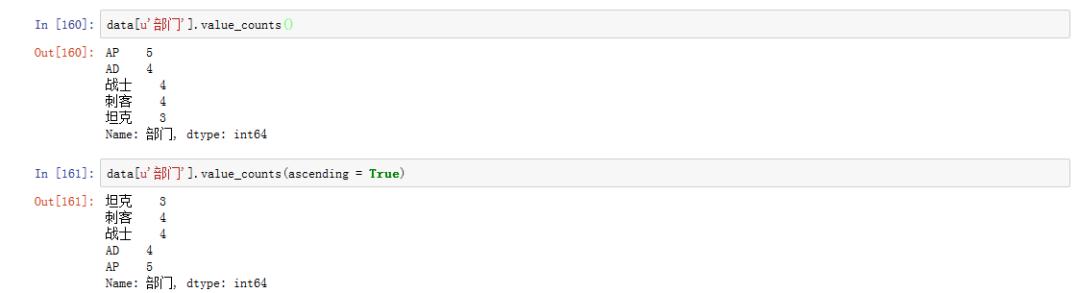
1. How many employees are there in each department?
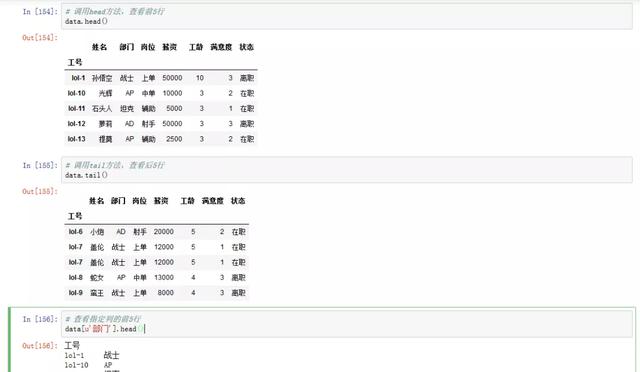
# frequency statistic
data[u'department'].value_counts()
# ascending = True Representative ascending display
data[u'department'].value_counts(ascending = True)
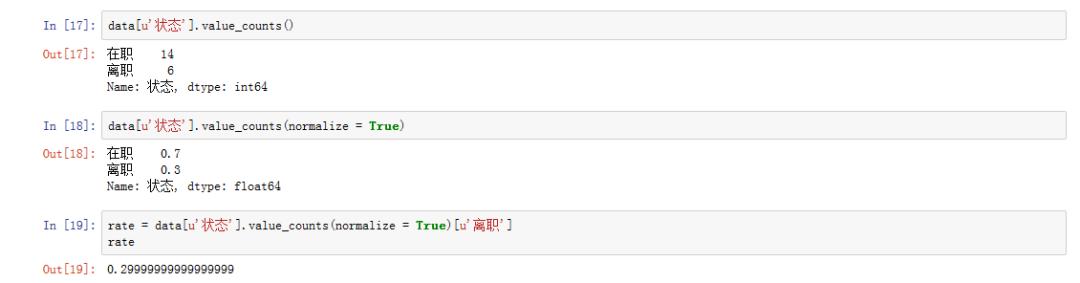
2. What is the overall turnover rate of employees?
# frequency statistic
data[u'state'].value_counts()
# normalize = True Standardized counting results were obtained
data[u'state'].value_counts(normalize = True)
# Show the overall turnover rate of employees
rate = data[u'state'].value_counts(normalize = True)[u'quit']
rate
3. What is the average salary?

As can be seen from the above figure, the average salary is 16800 yuan. Have you reached it?! You are allowed to cry for a while!
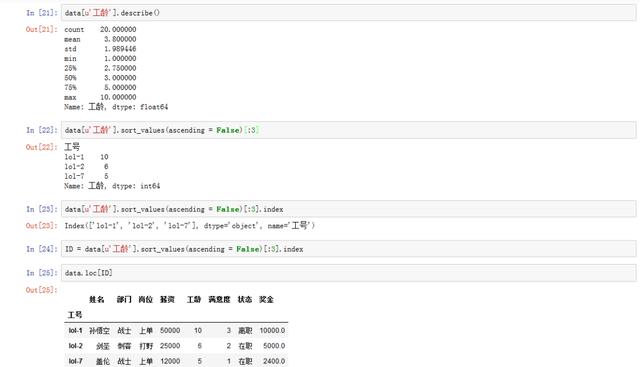
4. Who are the three employees who have been in the company for the longest time?
# describe Method is also a common method, and the results are more comprehensive.
data[u'working years'].describe()
# Through descending sorting and slicing, find the three employees who have been waiting for the longest time
data[u'working years'].sort_values(ascending = False)[:3]
ID = data[u'working years'].sort_values(ascending = False)[:3].index
data.loc[ID]
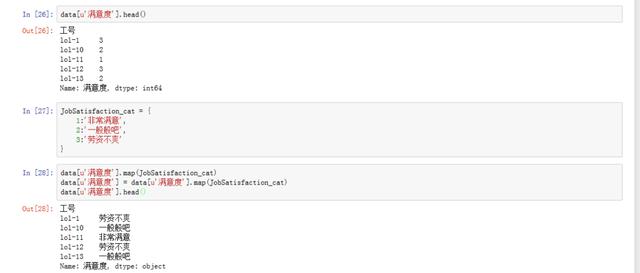
6. How satisfied are the employees?
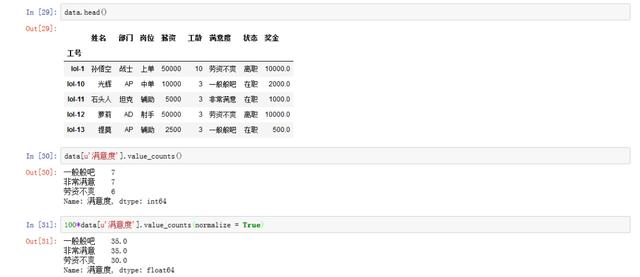
data[u'Satisfaction'].head()
# By looking at the first five lines of satisfaction, we found that they are not intuitive, and we can use map To map, first create a mapping dictionary
JobSatisfaction_cat = {
    1:'Very satisfied',
    2:'General',
    3:'Dissatisfaction between labor and capital'
}
data[u'Satisfaction'].map(JobSatisfaction_cat)
# Satisfaction mapping of metadata set
data[u'Satisfaction'] = data[u'Satisfaction'].map(JobSatisfaction_cat)
data[u'Satisfaction'].head()
Next, the overall satisfaction of employees is analyzed. Through calculation, it can be concluded that 70% of the employees agree with the company, but 30% of the employees are not satisfied with the company. The HR supervisor and department head need to further explore the situation of these 30% employees, because they are dissatisfied with whether they have left the company? Or is there a hidden danger? Whether it is in the core position and so on is worth our further exploration.
data.head()
# frequency statistic
data[u'Satisfaction'].value_counts()
# The standardized counting results are obtained. Considering that the percentage can better explain the satisfaction, multiply 100 to display
100*data[u'Satisfaction'].value_counts(normalize = True)