1, Introduction to sift algorithm
Scale invariant feature transform (SIFT) is a computer vision algorithm used to detect and describe local features in images. It looks for extreme points in spatial scale and extracts their position, scale and rotation invariants. This algorithm was published by David Lowe in 1999 and summarized in 2004.
Its applications include object recognition, robot map perception and navigation, image stitching, 3D model establishment, gesture recognition, image tracking and action comparison.
SIFT algorithm features:
-
SIFT feature is the local feature of image, which maintains invariance to rotation, scale scaling and brightness change, and also maintains a certain degree of stability to viewing angle change, affine transformation and noise;
-
With good uniqueness and rich information, it is suitable for fast and accurate matching in massive feature database;
-
Multiplicity, even a few objects can produce a large number of SIFT feature vectors;
-
The optimized SIFT matching algorithm can even meet the requirements of real-time;
-
Scalability, it can be easily combined with other forms of eigenvectors.
David G. Lowe, Professor, Department of computer science, University of British Columbia, Canada, published the paper entitled "distinctive image features from scale - invariant keypoints" in Int Journal of Computer Vision,2(60):91-110 in 2004. The author published the Matlab program code on his academic website (note that the initial version of this program code is D. Alvaro and J.J. Guerrero, from Universidad de Zaragoza.)
The above code can be easily retrieved: http://www.cs.ubc.ca/~lowe/keypoints/
2, matlab implementation of sift algorithm
1.sift.m detect feature points + construct feature point descriptor
% [image, descriptors, locs] = sift(imageFile)
%
% This function reads an image and returns its SIFT keypoints.
%   Input parameters:
%     imageFile: the file name for the image.
%
%   Returned:
%     image: the image array in double format
%     descriptors: a K-by-128 matrix, where each row gives an invariant
%         descriptor for one of the K keypoints.  The descriptor is a vector
%         of 128 values normalized to unit length.
%     locs: K-by-4 matrix, in which each row has the 4 values for a
%         keypoint location (row, column, scale, orientation).  The
%         orientation is in the range [-PI, PI] radians.
%
% Credits: Thanks for initial version of this program to D. Alvaro and
%          J.J. Guerrero, Universidad de Zaragoza (modified by D. Lowe)

function [image, descriptors, locs] = sift(imageFile)

% Load image
image = imread(imageFile);

% If you have the Image Processing Toolbox, you can uncomment the following
%   lines to allow input of color images, which will be converted to grayscale.
% if isrgb(image)
%    image = rgb2gray(image);
% end

[rows, cols] = size(image);

% Convert into PGM imagefile, readable by "keypoints" executable
f = fopen('tmp.pgm', 'w');
if f == -1
    error('Could not create file tmp.pgm.');
end
fprintf(f, 'P5\n%d\n%d\n255\n', cols, rows);
fwrite(f, image', 'uint8');
fclose(f);

% Call keypoints executable
if isunix
    command = '!./sift ';
else
    command = '!siftWin32 ';
end
command = [command ' <tmp.pgm >tmp.key'];
eval(command);

% Open tmp.key and check its header
g = fopen('tmp.key', 'r');
if g == -1
    error('Could not open file tmp.key.');
end
[header, count] = fscanf(g, '%d %d', [1 2]);
if count ~= 2
    error('Invalid keypoint file beginning.');
end
num = header(1);
len = header(2);
if len ~= 128
    error('Keypoint descriptor length invalid (should be 128).');
end

% Creates the two output matrices (use known size for efficiency)
locs = double(zeros(num, 4));
descriptors = double(zeros(num, 128));

% Parse tmp.key
for i = 1:num
    [vector, count] = fscanf(g, '%f %f %f %f', [1 4]); %row col scale ori
    if count ~= 4
        error('Invalid keypoint file format');
    end
    locs(i, :) = vector(1, :);

    [descrip, count] = fscanf(g, '%d', [1 len]);
    if (count ~= 128)
        error('Invalid keypoint file value.');
    end
    % Normalize each input vector to unit length
    descrip = descrip / sqrt(sum(descrip.^2));
    descriptors(i, :) = descrip(1, :);
end
fclose(g);
end
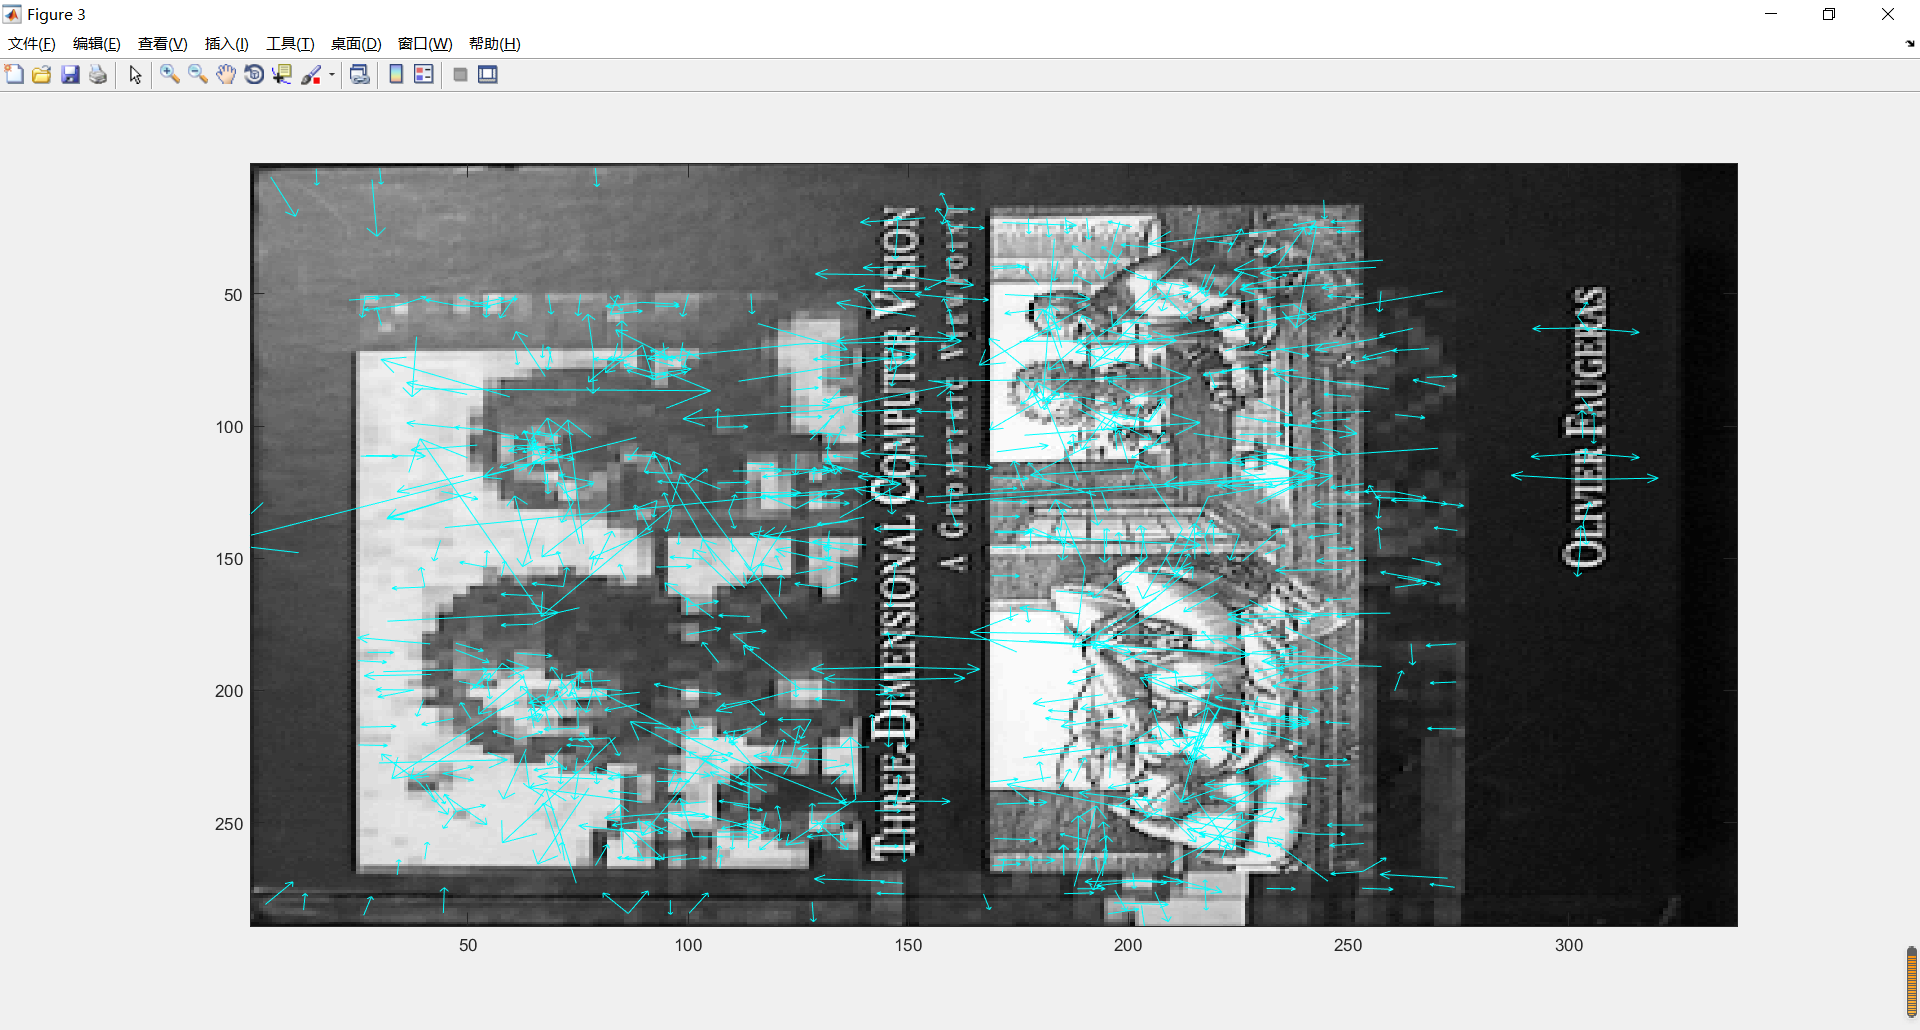
2.showkeys.m draw images with feature points
% showkeys(image, locs)
%
% This function displays an image with SIFT keypoints overlayed.
%   Input parameters:
%     image: the file name for the image (grayscale)
%     locs: matrix in which each row gives a keypoint location (row,
%           column, scale, orientation)

function showkeys(image, locs)

disp('Drawing SIFT keypoints ...');

% Draw image with keypoints
figure('Position', [50 50 size(image,2) size(image,1)]);
colormap('gray');
imagesc(image);
hold on;
imsize = size(image);
for i = 1: size(locs,1)
    % Draw an arrow, each line transformed according to keypoint parameters.
    TransformLine(imsize, locs(i,:), 0.0, 0.0, 1.0, 0.0);
    TransformLine(imsize, locs(i,:), 0.85, 0.1, 1.0, 0.0);
    TransformLine(imsize, locs(i,:), 0.85, -0.1, 1.0, 0.0);
end
hold off;


% ------ Subroutine: TransformLine -------
% Draw the given line in the image, but first translate, rotate, and
% scale according to the keypoint parameters.
%
% Parameters:
%   Arrays:
%    imsize = [rows columns] of image
%    keypoint = [subpixel_row subpixel_column scale orientation]
%
%   Scalars:
%    x1, y1; begining of vector
%    x2, y2; ending of vector
end

function TransformLine(imsize, keypoint, x1, y1, x2, y2)

% The scaling of the unit length arrow is set to approximately the radius
%   of the region used to compute the keypoint descriptor.
len = 6 * keypoint(3);

% Rotate the keypoints by 'ori' = keypoint(4)
s = sin(keypoint(4));
c = cos(keypoint(4));

% Apply transform
r1 = keypoint(1) - len * (c * y1 + s * x1);
c1 = keypoint(2) + len * (- s * y1 + c * x1);
r2 = keypoint(1) - len * (c * y2 + s * x2);
c2 = keypoint(2) + len * (- s * y2 + c * x2);

line([c1 c2], [r1 r2], 'Color', 'c');
end
3.appendimages.m draw an image after feature matching of two images
% im = appendimages(image1, image2)
%
% Return a new image that appends the two images side-by-side.

function im = appendimages(image1, image2)

% Select the image with the fewest rows and fill in enough empty rows
%   to make it the same height as the other image.
rows1 = size(image1,1);
rows2 = size(image2,1);

if (rows1 < rows2)
     image1(rows2,1) = 0;
else
     image2(rows1,1) = 0;
end

% Now append both images side-by-side.
im = [image1 image2];
end
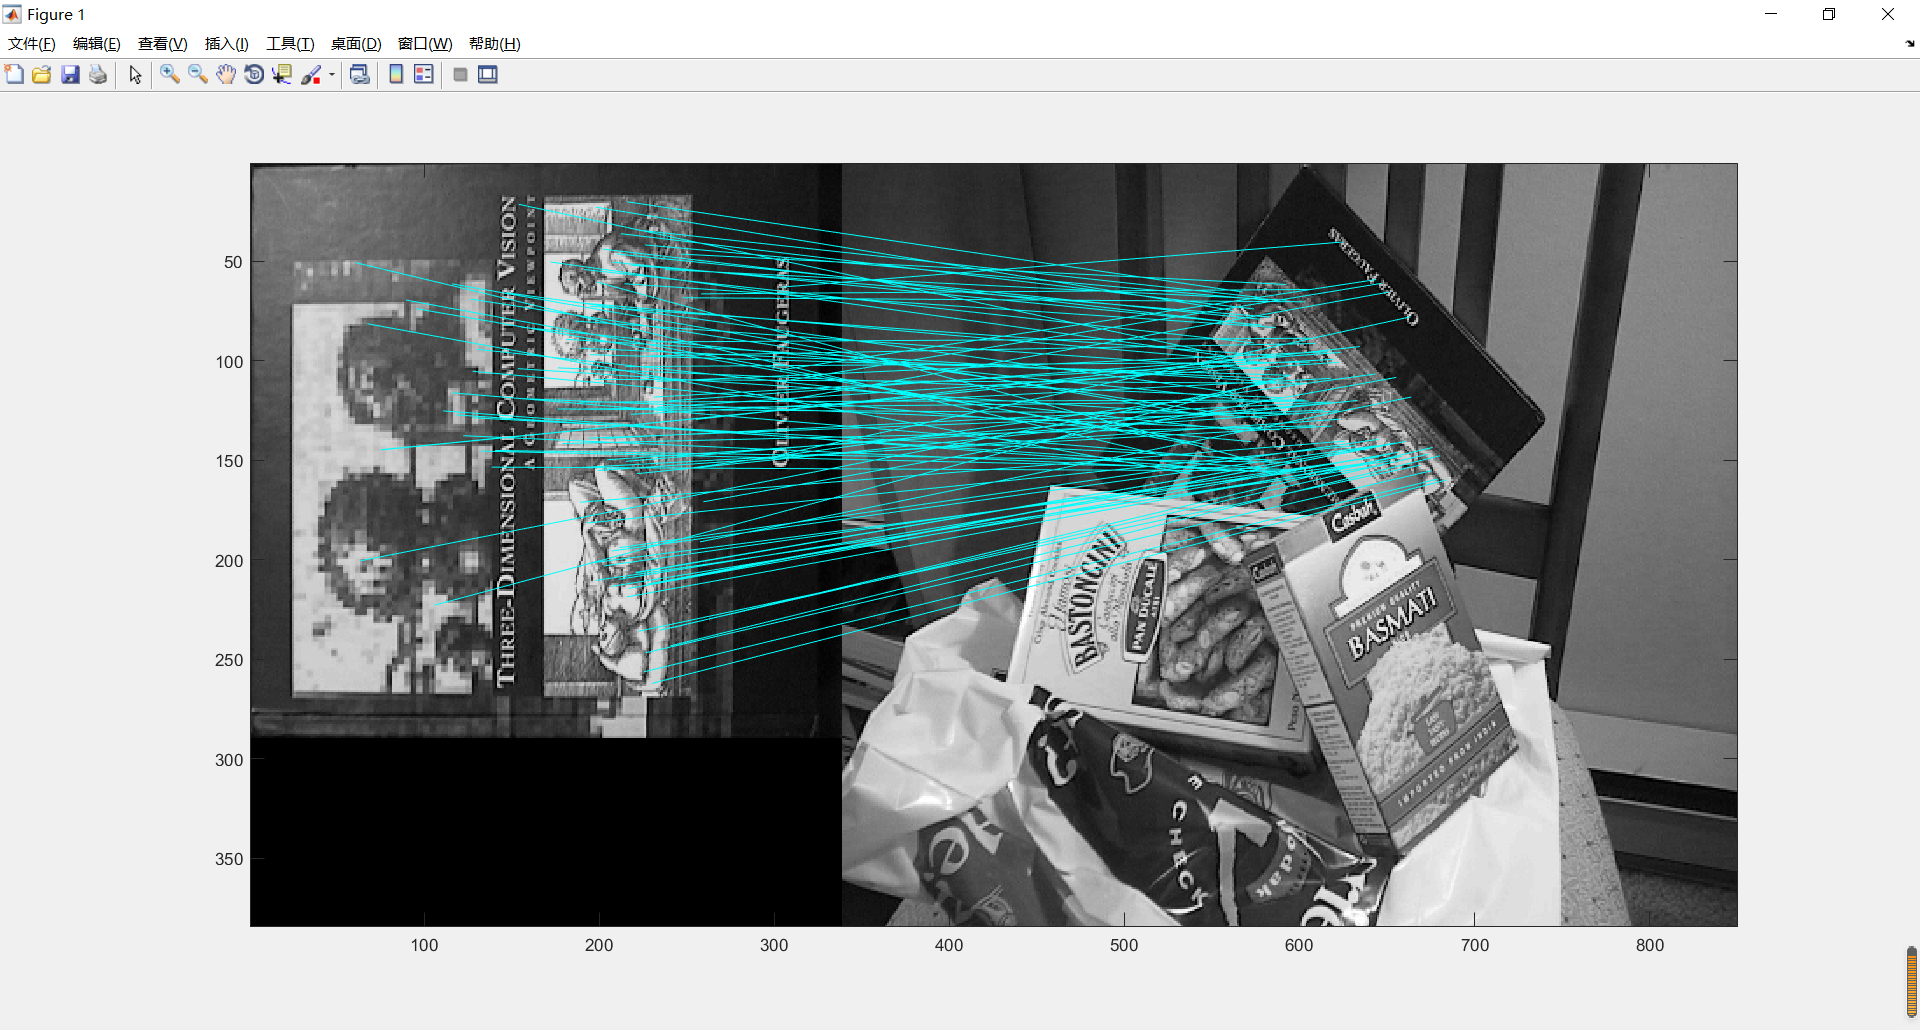
4.match.m read two images, extract their key points and match them respectively
% num = match(image1, image2)
%
% This function reads two images, finds their SIFT features, and
%   displays lines connecting the matched keypoints.  A match is accepted
%   only if its distance is less than distRatio times the distance to the
%   second closest match.
% It returns the number of matches displayed.
%
% Example: match('scene.pgm','book.pgm');

function num = match(image1, image2)

% Find SIFT keypoints for each image
[im1, des1, loc1] = sift(image1);
[im2, des2, loc2] = sift(image2);

% For efficiency in Matlab, it is cheaper to compute dot products between
%  unit vectors rather than Euclidean distances.  Note that the ratio of
%  angles (acos of dot products of unit vectors) is a close approximation
%  to the ratio of Euclidean distances for small angles.
%
% distRatio: Only keep matches in which the ratio of vector angles from the
%   nearest to second nearest neighbor is less than distRatio.
distRatio = 0.6;

% For each descriptor in the first image, select its match to second image.
des2t = des2';                          % Precompute matrix transpose
for i = 1 : size(des1,1)
   dotprods = des1(i,:) * des2t;        % Computes vector of dot products
   [vals,indx] = sort(acos(dotprods));  % Take inverse cosine and sort results

   % Check if nearest neighbor has angle less than distRatio times 2nd.
   if (vals(1) < distRatio * vals(2))
      match(i) = indx(1);
   else
      match(i) = 0;
   end
end

% Create a new image showing the two images side by side.
im3 = appendimages(im1,im2);

% Show a figure with lines joining the accepted matches.
figure('Position', [100 100 size(im3,2) size(im3,1)]);
colormap('gray');
imagesc(im3);
hold on;
cols1 = size(im1,2);
for i = 1: size(des1,1)
  if (match(i) > 0)
    line([loc1(i,2) loc2(match(i),2)+cols1], ...
         [loc1(i,1) loc2(match(i),1)], 'Color', 'c');
  end
end
hold off;
num = sum(match > 0);
fprintf('Found %d matches.\n', num);
end
4, Explain
1 match.m
Function: this function reads in two (grayscale) images, finds out their SIFT features, and displays two matching feature points (the matched keys) straight lines (connecting the corresponding feature points) in the two images. The criterion for judging the matching is that the matching distance is less than distratio times the distance of the next nearest matching ( A match is accepted only if its distance is less than distRatio times the distance to the second closest match.
It returns the number of matches displayed
Call instance: match('desk.jpg ',' book.jpg ');
(test the feature matching between the image of a desktop containing a book and the image of a Book)
be careful:
(1) The image is a gray image. If it is a color image, it should be converted to a gray image by RGB 2 gray before calling.
(2) parameter distRatio is the coefficient to control the number of matching points. Here we take 0.6, which determines the number of matching points and adjusts the parameter in the Match.m file to get the most appropriate number of matching points.
2. Sift. M: the core of SIFT algorithm
For the specific principle, see the paper entitled "discrete image features from scale - invariant keypoints" published by David G. Lowe in Int Journal of Computer Vision,2(60):91-110 in 2004
Function: this function reads in grayscale images and returns SIFT keypoints
Calling method: [image, descriptors, locs] = sift(imageFile)
Input parameter: imageFile: image file name
Return parameters: Image: is an image matrix in double format, descriptors: a matrix x of K-by-128, where each line is an invariant descriptor for the K key feature points found, and this descriptor It is a K-by-4 matrix with 128 values and normalized to the unit length vector; locks: it is a K-by-4 matrix, in which each row has four values, indicating the position information of key points (row coordinates and column coordinates in the image. Note that the upper left corner of the general image is the coordinate origin); scale, a parameter of Gaussian scale space, in which this parameter also determines the frame (structure) Determines the size of the image disk. The last parameter is orientation. The range of the orientation parameter is [- PI, PI], and the unit is radian.
3.appendimages.m
This function creates a new image containing two matching images and the matching connecting lines between them.
4. For other detailed explanations, please refer to the blog https://www.cnblogs.com/xfzhang/articles/1878089.html
3, Results
1. Feature point matching results of two images:
2. Feature point detection of single image