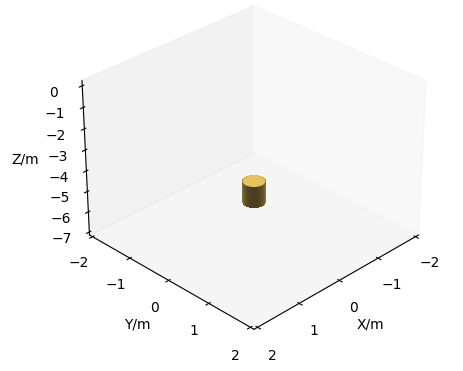
Introduce the following requirements: use matplotlib to draw a cylinder with any position and attitude under a 3D coordinate axis.

Analysis: it can be seen that there are two main problems to be solved here, one is to draw the cylinder, and the other is the attitude control of the cylinder. For attitude control, Euler rotation matrix is needed.
Core idea:
- Firstly, draw the cylindrical surface with radius 1 and height 1 (equivalent to the cylindrical surface of unit 1) with center coordinate (0, 0, 0). Note that there is no upper bottom and lower bottom drawn at this time. The cylindrical surface is drawn mainly by dividing the height coordinate 1 into two parts (- 0.5, 0.5), that is, the height of the bottom edge and the top edge corresponds to the z coordinate, dividing the angle u of 2*pi into several parts, and sin(u) corresponds to the x coordinate, cos(u) corresponds to y coordinate (polar coordinate formula with circle center of (0, 0) is used here)
- Each height z corresponds to x and Y respectively. At this time, the three-dimensional coordinates of the upper and lower bottom of the cylinder are obtained. At this time, the three-dimensional coordinates of the upper and lower bottom of the cylinder with different positions, attitudes and sizes can be constructed by adjusting the x, y and z coordinates accordingly
- Using plot in matplotlib_ The surface method can draw a circular cylindrical surface. At this time, only the cylindrical surface is drawn. In addition, the two bottom surfaces need to be supplemented. Using the three-dimensional coordinates of the upper bottom and the lower bottom obtained above, add_collection3d method can fill the bottom and top surfaces.
About cylinder drawing
plot_ The surface function is defined as follows:
def plot_surface(self, X, Y, Z, *args, norm=None, vmin=None,
                 vmax=None, lightsource=None, **kwargs):
    """
    Create a surface plot.
    Parameters
    ----------
    X, Y, Z : 2d arrays

    color : color-like
    Color of the surface patches.Hexadecimal can be set rgb colour

    rstride=1,  # rstride (row) specifies the span of the row
    cstride=1,  # cstride(column) specifies the span of the column
add_ Definition of collection3d function
def add_collection3d(self, col, zs=0, zdir='z'):
    """
    Add a 3D collection object to the plot.

    2D collection types are converted to a 3D version by
    modifying the object and adding z coordinate information.

    Supported are:
        - PolyCollection
        - LineCollection
        - PatchCollection
    """
PolyCollection represents the collection class of 3D polygons, which can give correct filling appearance to planar polygons. The definition of this class is as follows:
def __init__(self, verts, *args, zsort='average', **kwargs):

    """
    Parameters
    ----------
    verts : list of array-like Nx3
        Each element describes a polygon as a sequence of ``N_i`` points
        ``(x, y, z)``.
    facecolors: You can set hexadecimal for the plane rgb colour
    """
Notes:
For the drawing of cylindrical surface, you can refer to https://blog.csdn.net/weixin_41494909/article/details/86257870
The verts parameter in the PolyCollection class is a list containing tuples representing the coordinates of the polygon, and then through add_ The collection3d function draws a plane of fill color on the 3D axis. Polygon fill reference: https://stackoverflow.com/questions/64029288/plotting-poly3dcollection-using-add-collection3d
Attitude problem of cylinder
Explain Euler angle:
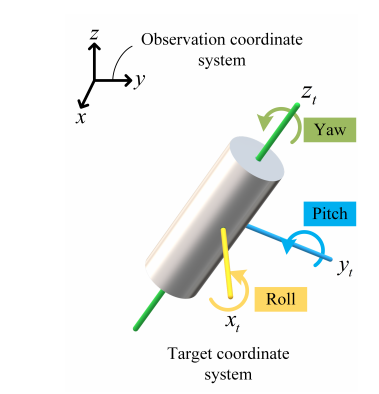
As shown in the figure above, the Euler angles Yaw, Pitch and Roll can determine the attitude of the object. The Euler rotation matrix can be calculated from these three angles. When the attitude of the object changes relative to the observation coordinate system, the coordinates of the object in the observation coordinate system can be obtained by multiplying the original position coordinates by the Euler rotation matrix.
For more details, please refer to: https://www.cnblogs.com/flyinggod/p/8144100.html
From the above figure, it can be seen that for the cylinder, no matter how the Yaw angle changes, the attitude of the object does not change. Therefore, for the cylinder, only the pitch and Roll angles control the attitude of the object.
The implementation code of Euler rotation matrix is as follows:
def RotationMatrix(theta, phi, psi):
    '''The vector in the coordinate system will be observed v Convert to vector in object coordinate system v'Or put the vector(coordinate)Rotate around origin.

    Notes
    -----
    This program rotation order(z->y->x),Internal rotation.
    .Each specific order of external rotation is equivalent to its opposite order of internal rotation,vice versa.
    .The rotation matrix of the coordinate system rotating around the origin and the rotation matrix of the vector (coordinate) rotating around the origin are transposed to each other.
    .The rotation matrix of the world coordinate system rotating to the target coordinate system and the rotation matrix of the target coordinate system rotating to the world coordinate system are transposed to each other.
    '''

    theta, phi, psi = theta * pi / 180, phi * pi / 180, psi * pi / 180

    Rz = np.mat([[cos(psi), sin(psi), 0],
                 [-sin(psi), cos(psi), 0],
                 [0, 0, 1]])

    Ry = np.mat([[cos(theta), 0, -sin(theta)],
                 [0, 1, 0],
                 [sin(theta), 0, cos(theta)]])

    Rx = np.mat([[1, 0, 0],
                 [0, cos(phi), sin(phi)],
                 [0, -sin(phi), cos(phi)]])

    return Rx * Ry * Rz
Code example
Example:
import numpy as np
from math import *

from mpl_toolkits.mplot3d.art3d import Poly3DCollection
import matplotlib.pyplot as plt


class Target(object):
    """Refer in particular to cylinder targets.

    Attributes
    ----------

    radius: float
        The radius of the base of a cylinder
    pitch: float
        the pitch angle of the cylinder
    roll: float
        the roll angle of the cylinder
    yaw: float
    	the roll angle of the cylinder
    length: float
        the length of the target
    position: list
        the position of the target, [x, y, z]

    """

    def __init__(self, radius, pitch, roll, yaw, length, position_x, position_y, position_z, **kwargs):
        self.radius = radius
        self.pitch = pitch
        self.roll = roll
        self.yaw = yaw
        self.length = length
        self.position = [position_x, position_y, position_z]


def RotationMatrix(theta, phi, psi):
    '''The vector in the coordinate system will be observed v Convert to vector in object coordinate system v'Or put the vector(coordinate)Rotate around origin.

    Notes
    -----
    This program rotation order(z->y->x),Internal rotation.
    .Each specific order of external rotation is equivalent to its opposite order of internal rotation,vice versa.
    .The rotation matrix of the coordinate system rotating around the origin and the rotation matrix of the vector (coordinate) rotating around the origin are transposed to each other.
    .The rotation matrix of the world coordinate system rotating to the target coordinate system and the rotation matrix of the target coordinate system rotating to the world coordinate system are transposed to each other.
    '''

    theta, phi, psi = theta * pi / 180, phi * pi / 180, psi * pi / 180

    Rz = np.mat([[cos(psi), sin(psi), 0],
                 [-sin(psi), cos(psi), 0],
                 [0, 0, 1]])

    Ry = np.mat([[cos(theta), 0, -sin(theta)],
                 [0, 1, 0],
                 [sin(theta), 0, cos(theta)]])

    Rx = np.mat([[1, 0, 0],
                 [0, cos(phi), sin(phi)],
                 [0, -sin(phi), cos(phi)]])

    return Rx * Ry * Rz


def show_cylinder(fig, target):
    """In 3 D Display a cylinder with any position and attitude under the coordinate axis

    Parameters
    ----------
    fig : matplotlib.figure.Figure
        Pass in a blank fig
    target : class Target
        A cylinder

    """

    fig.clf()  # Clear the figure in different detection scene
    # show the metal cylinder

    u = np.linspace(0, 2 * np.pi, 50)  # Divide the circle into 50 equal parts
    h = np.linspace(-0.5, 0.5, 2)  # Divide the height (1m) into two equal parts, corresponding to the upper bottom and the lower bottom

    x = target.radius * np.sin(u)
    y = target.radius * np.cos(u)

    x = np.outer(x, np.ones(len(h)))  # 20*2
    y = np.outer(y, np.ones(len(h)))  # 20*2
    z = np.outer(np.ones(len(u)), h)  # 20*2
    z = z * target.length

    x_rotation = np.ones(x.shape)  # Coordinates after rotation 20 * 2
    y_rotation = np.ones(y.shape)
    z_rotation = np.ones(z.shape)

    th1 = target.pitch
    th2 = target.roll
    th3 = target.yaw
    a = np.array(RotationMatrix(th1, th2, th3))  # 3*3 pitch,roll
    for i in range(2):
        r = np.c_[x[:, i], y[:, i], z[:, i]]  # 20*3
        rT = r @ a  # 20*3
        x_rotation[:, i] = rT[:, 0]
        y_rotation[:, i] = rT[:, 1]
        z_rotation[:, i] = rT[:, 2]
    ax = fig.add_subplot(projection='3d')
    ax.view_init(30, 45)

    ax.plot_surface(x_rotation + target.position[0], y_rotation + target.position[1], z_rotation + target.position[2],
                    color='#E7C261', alpha=1, antialiased=False)

    verts = [list(zip(x_rotation[:, 0] + target.position[0], y_rotation[:, 0] + target.position[1],
                      z_rotation[:, 0] + target.position[2]))]

    ax.add_collection3d(Poly3DCollection(verts, facecolors='#E7C261'))
    verts = [list(zip(x_rotation[:, 1] + target.position[0], y_rotation[:, 1] + target.position[1],
                      z_rotation[:, 1] + target.position[2]))]

    ax.add_collection3d(Poly3DCollection(verts, facecolors='#E7C261'))

    ax.set_xticks(np.arange(-2, 3, 1))
    ax.set_yticks(np.arange(-2, 3, 1))
    ax.set_xlabel('X/m')
    ax.set_ylabel('Y/m')
    ax.set_zlabel('Z/m')
    ax.set_xlim(-2, 2)
    ax.set_ylim(-2, 2)
    ax.set_zlim(target.position[2] - 2, 0.1)

    ax.grid(None)  # delete the background grid


target = Target(0.2, 0, 0, 0, 1, 0, 0, -5)
fig = plt.figure()
show_cylinder(fig, target)
plt.show()
Operation results: