
stay Did you use Kubernetes autoscale correctly The article describes in detail how to use Kubernetes' automatic scaling. There are three main types of elastic expansion in Kubernetes: HPA, VPA and CA. This article will not be explained in detail. Those who are interested can see that article. Here we mainly focus on the horizontal scaling of the lower Pod HPA.
With kubernetes v1 The API of HPA came to the stable version of autoscaling/v2 after the release of 23:
- Scaling based on custom metrics
- Scaling based on multiple indicators
- Configurable scaling behavior
From the initial v1 version, HPA only supported the scaling of CPU and memory utilization, to the later support of custom indicators and aggregation layer API s, to v1 Version 18 adds the support of configuring scaling behavior, and HPA is becoming more and more useful and reliable.
The expansion relying on CPU or memory indicators does not use all systems, and it does not seem so reliable. For most web back-end systems, it is more reliable to handle sudden traffic based on the elastic scaling of RPS (requests per second).
Prometheus is also a popular open source monitoring system. Through Prometheus, we can obtain the real-time traffic load index of the system. Today, we will try to scale flexibly based on the user-defined index of Prometheus.
Note: for the current HPA scale to 0, you need to open the alpha version of HPAScaleToZero in the feature gate and configure an object or external indicator. Even if it is turned on, the capacity expansion from 0 to 1 requires scheduling, IP allocation, image pull and other processes, which has a certain overhead. If this part of the cost is reduced, we will sell it here and supplement it in the subsequent articles.
All the code used in this article is OK Download from here.
Overall architecture
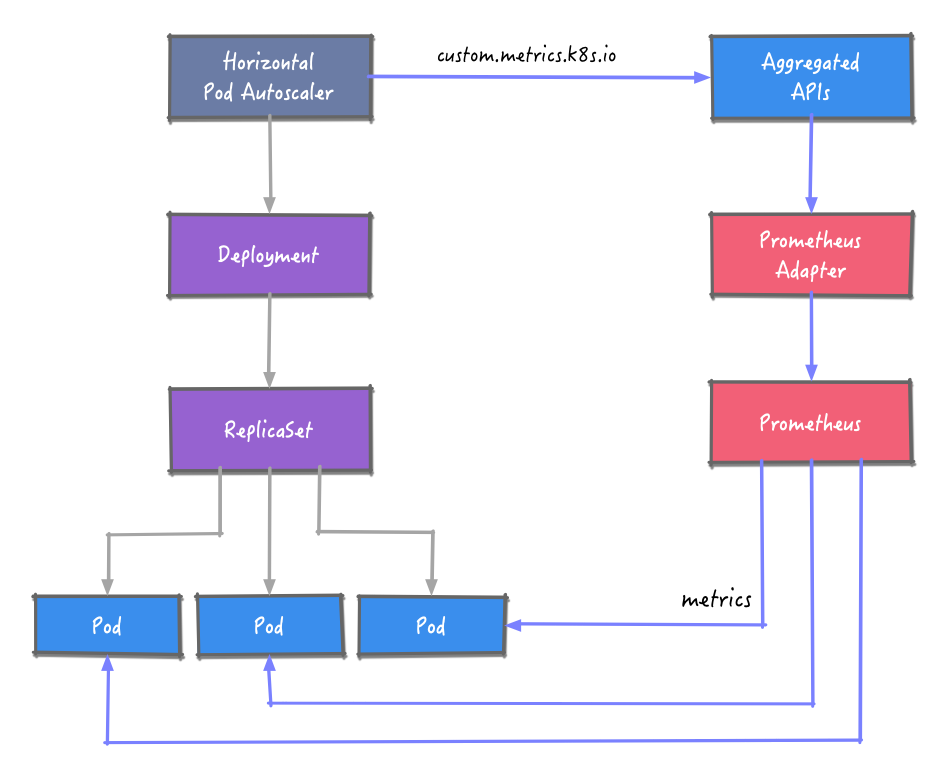
HPA needs to obtain the index data of Prometheus, which is introduced here Prometheus Adapter Components. Prometheus Adapter implements resource metrics,custom metrics and external metrics APIs API, HPA supporting autoscaling/v2.
After obtaining the indicator data, adjust the number of samples of the workload according to the predefined rules.
Environment construction
K3s
We use the latest version 1.23 of K3s as the Kubernetes environment.
export INSTALL_K3S_VERSION=v1.23.1+k3s2
curl -sfL https://get.k3s.io | sh -s - --write-kubeconfig-mode 644 --write-kubeconfig ~/.kube/config
Example application
We prepare a simple web application that can record the number of requests and output the HTTP index in Prometheus format through the / metrics endpoint_ requests_ total.
func main() {
	metrics := prometheus.NewCounterVec(
		prometheus.CounterOpts{
			Name:        "http_requests_total",
			Help:        "Number of total http requests",
		},
		[]string{"status"},
	)
	prometheus.MustRegister(metrics)

	http.HandleFunc("/", func(w http.ResponseWriter, r *http.Request) {
		path := r.URL.Path
		statusCode := 200
		switch path {
		case "/metrics":
			promhttp.Handler().ServeHTTP(w, r)
		default:
			w.WriteHeader(statusCode)
			w.Write([]byte("Hello World!"))
		}
		metrics.WithLabelValues(strconv.Itoa(statusCode)).Inc()
	})
	http.ListenAndServe(":3000", nil)
}
Deploy the application to the cluster:
kubectl apply -f kubernetes/sample-httpserver-deployment.yaml
Prometheus
To install prometheus using Helm, first add the chart warehouse of prometheus:
helm repo add prometheus-community https://prometheus-community.github.io/helm-charts
The test here only needs Prometheus server, and other components are disabled during installation. At the same time, in order to demonstrate the effectiveness of the effect, the pull interval of the index is set to 10s.
# install prometheus with some components disabled
# set scrape interval to 10s
helm install prometheus prometheus-community/prometheus -n default --set alertmanager.enabled=false,pushgateway.enabled=false,nodeExporter.enabled=false,kubeStateMetrics.enabled=false,server.global.scrape_interval=10s
Through port forwarding, web pages can be accessed in the browser.
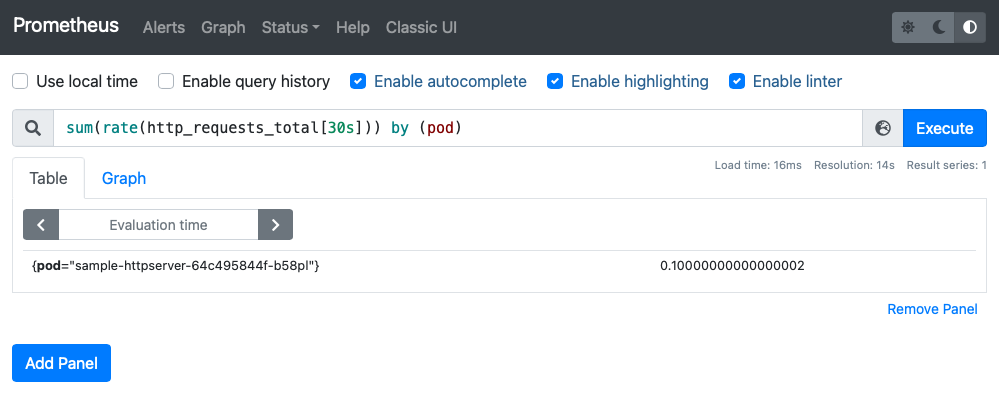
# port forward
kubectl port-forward svc/prometheus-server 9090:80 -n prometheus
Here, the RPS of Pod is queried using sum (rate (http_requests_total [30s]) by (Pod) statement:
Prometheus Adapter
Also use Helm to install the Produmetheus Adapter. Additional configuration is required here.
helm install prometheus-adapter prometheus-community/prometheus-adapter -n default -f kubernetes/values-adapter.yaml
In addition to configuring the access method of Prometheus server, you should also configure the calculation rules of custom indicators to tell the adapter how to obtain indicators from Prometheus and calculate the indicators we need:
rules:
  default: false
  custom:
   - seriesQuery: '{__name__=~"^http_requests.*_total$",container!="POD",namespace!="",pod!=""}'
     resources:
       overrides:
         namespace: { resource: "namespace" }
         pod: { resource: "pod" }
     name:
       matches: "(.*)_total"
       as: "${1}_qps"
     metricsQuery: sum(rate(<<.Series>>{<<.LabelMatchers>>}[30s])) by (<<.GroupBy>>)
Refer to the detailed Adapter Configuration.
After the promethues adapter pod runs successfully, execute custom metrics. k8s. IO request:
kubectl get --raw '/apis/custom.metrics.k8s.io/v1beta1/namespaces/default/pods/*/http_requests_qps' | jq .
{
  "kind": "MetricValueList",
  "apiVersion": "custom.metrics.k8s.io/v1beta1",
  "metadata": {
    "selfLink": "/apis/custom.metrics.k8s.io/v1beta1/namespaces/default/pods/%2A/http_requests_qps"
  },
  "items": [
    {
      "describedObject": {
        "kind": "Pod",
        "namespace": "default",
        "name": "sample-httpserver-64c495844f-b58pl",
        "apiVersion": "/v1"
      },
      "metricName": "http_requests_qps",
      "timestamp": "2022-01-18T03:32:51Z",
      "value": "100m",
      "selector": null
    }
  ]
}
Note: the value here is 100m, and the suffix "m" of the value identifies milli requests per seconds, so the 100m here means 0.1/s and 0.1 requests per second.
HPA
Finally, the configuration of HPA:
- The minimum and maximum number of copies are set to 1 and 10 respectively
- In order to test the effectiveness of the effect, set the behavior of expansion and contraction
- Specify metric http_requests_qps, type Pods and target value 50000m: represents the average RPS 50 of each pod. For example, if you access with 300 RPS, the number of copies is 300 / 50 = 6.
kind: HorizontalPodAutoscaler
apiVersion: autoscaling/v2
metadata:
  name: sample-httpserver
spec:
  scaleTargetRef:
    apiVersion: apps/v1
    kind: Deployment
    name: sample-httpserver
  minReplicas: 1
  maxReplicas: 10
  behavior:
    scaleDown:
      stabilizationWindowSeconds: 30
      policies:
        - type: Percent
          value: 100
          periodSeconds: 15
    scaleUp:
      stabilizationWindowSeconds: 0
      policies:
        - type: Percent
          value: 100
          periodSeconds: 15
  metrics:
    - type: Pods
      pods:
        metric:
          name: http_requests_qps
        target:
          type: AverageValue
          averageValue: 50000m
test
Selection of test tools vegeta , because it can specify RPS.
First create a NodePort service for the application:
kubectl expose deploy sample-httpserver --name sample-httpserver-host --type NodePort --target-port 3000

kubectl get svc sample-httpserver-host
NAME                     TYPE       CLUSTER-IP     EXTERNAL-IP   PORT(S)          AGE
sample-httpserver-host   NodePort   10.43.66.206   <none>        3000:31617/TCP   12h
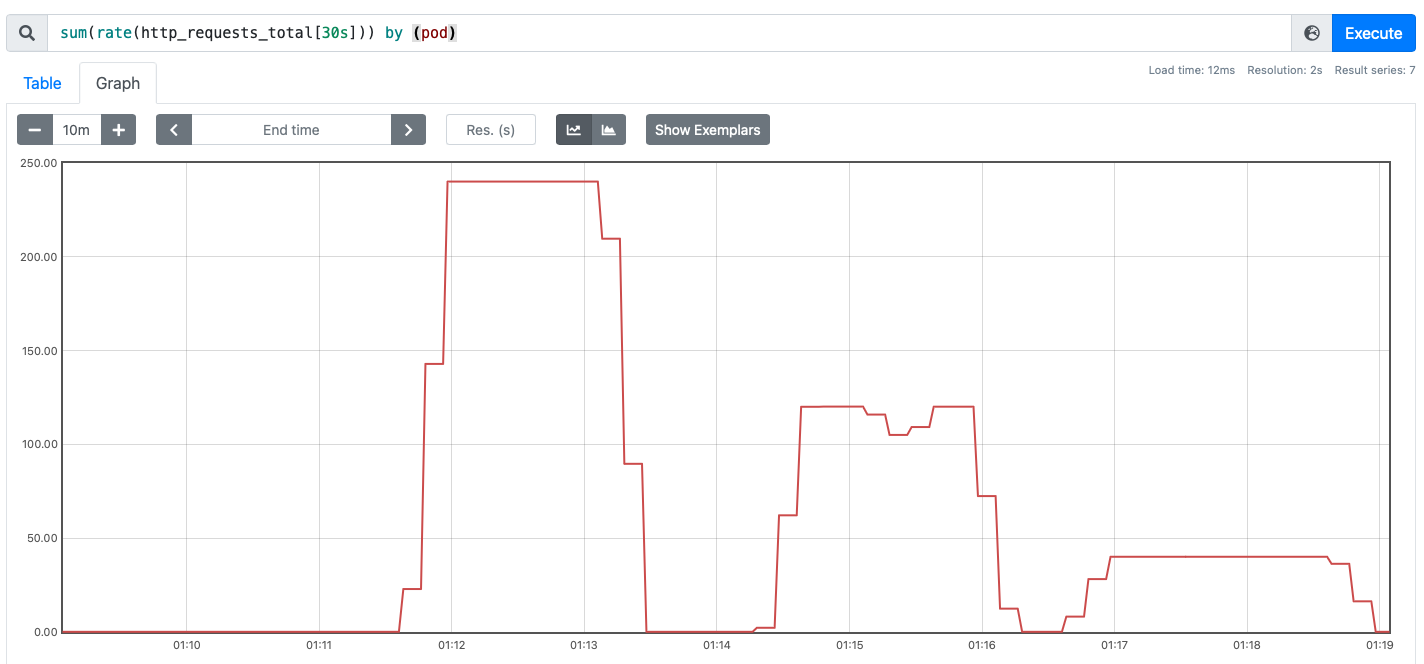
The RPS of 240, 120 and 40 are used to initiate the request respectively:
# 240
echo "GET http://192.168.1.92:31617" | vegeta attack -duration 60s -connections 10 -rate 240 | vegeta report
# 120
echo "GET http://192.168.1.92:31617" | vegeta attack -duration 60s -connections 10 -rate 120 | vegeta report
# 40
echo "GET http://192.168.1.92:31617" | vegeta attack -duration 60s -connections 10 -rate 40 | vegeta report
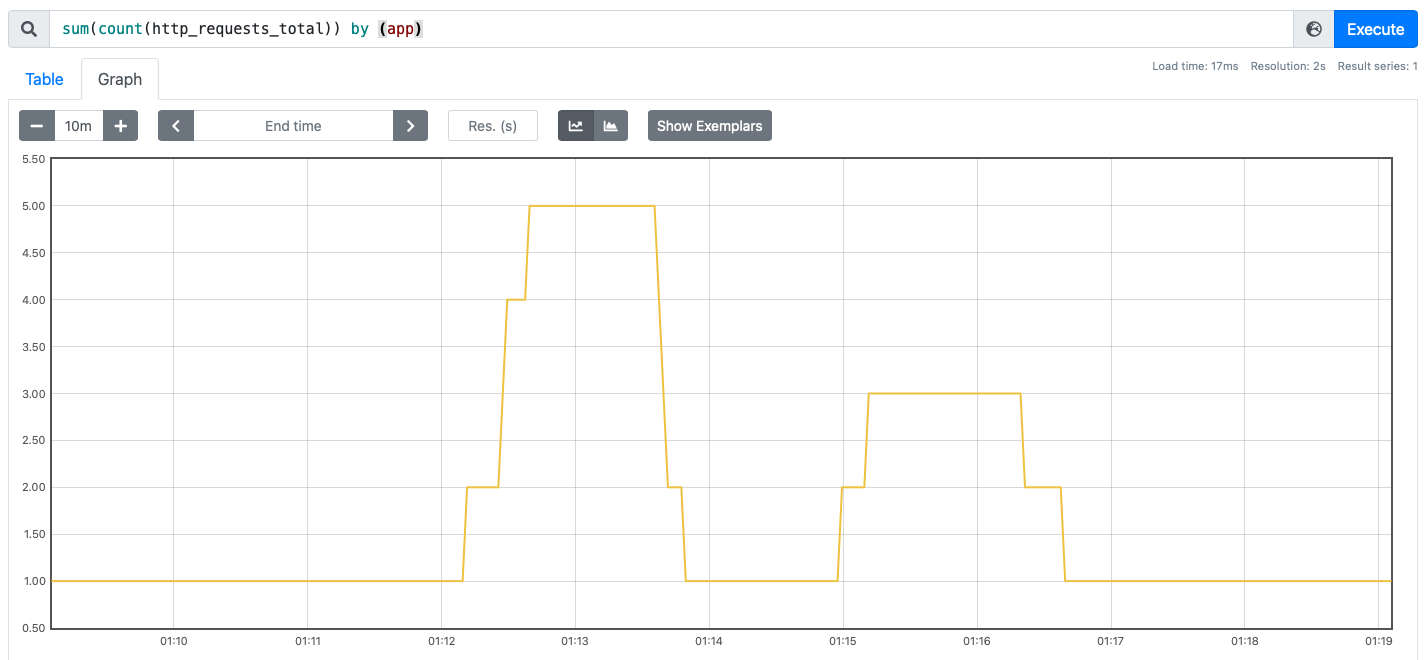
Observe the changes in the number of requests and examples from the web interface of Prometheus:
kubectl describe hpa sample-httpserver
Warning: autoscaling/v2beta2 HorizontalPodAutoscaler is deprecated in v1.23+, unavailable in v1.26+; use autoscaling/v2 HorizontalPodAutoscaler
Name:                           sample-httpserver
Namespace:                      default
Labels:                         <none>
Annotations:                    <none>
CreationTimestamp:              Mon, 17 Jan 2022 23:18:46 +0800
Reference:                      Deployment/sample-httpserver
Metrics:                        ( current / target )
  "http_requests_qps" on pods:  100m / 50
Min replicas:                   1
Max replicas:                   10
Behavior:
  Scale Up:
    Stabilization Window: 0 seconds
    Select Policy: Max
    Policies:
      - Type: Percent  Value: 100  Period: 15 seconds
  Scale Down:
    Stabilization Window: 30 seconds
    Select Policy: Max
    Policies:
      - Type: Percent  Value: 100  Period: 15 seconds
Deployment pods:       1 current / 1 desired
Conditions:
  Type            Status  Reason              Message
  ----            ------  ------              -------
  AbleToScale     True    ReadyForNewScale    recommended size matches current size
  ScalingActive   True    ValidMetricFound    the HPA was able to successfully calculate a replica count from pods metric http_requests_qps
  ScalingLimited  False   DesiredWithinRange  the desired count is within the acceptable range
Events:
  Type    Reason             Age                  From                       Message
  ----    ------             ----                 ----                       -------
  Normal  SuccessfulRescale  25m                  horizontal-pod-autoscaler  New size: 6; reason: pods metric http_requests_qps above target
  Normal  SuccessfulRescale  19m                  horizontal-pod-autoscaler  New size: 4; reason: All metrics below target
  Normal  SuccessfulRescale  12m (x2 over 9h)     horizontal-pod-autoscaler  New size: 4; reason: pods metric http_requests_qps above target
  Normal  SuccessfulRescale  11m                  horizontal-pod-autoscaler  New size: 5; reason: pods metric http_requests_qps above target
  Normal  SuccessfulRescale  9m40s (x2 over 12m)  horizontal-pod-autoscaler  New size: 2; reason: pods metric http_requests_qps above target
  Normal  SuccessfulRescale  9m24s (x4 over 10h)  horizontal-pod-autoscaler  New size: 3; reason: pods metric http_requests_qps above target
  Normal  SuccessfulRescale  7m54s (x3 over 9h)   horizontal-pod-autoscaler  New size: 2; reason: All metrics below target
  Normal  SuccessfulRescale  7m39s (x4 over 9h)   horizontal-pod-autoscaler  New size: 1; reason: All metrics below target
summary
The horizontal expansion of applications based on user-defined indicators, such as requests per second, is more reliable than CPU / memory, and is suitable for most web systems. In case of sudden traffic, the capacity can be expanded quickly. By controlling the scaling behavior, the jitter of the number of copies can be reduced. Promeheus, as a monitoring system for popular applications, can be used as a scaling indicator with the support of Adapter and Aggregate API.
At present, scale to 0 of HPA is still in the alpha stage, and we need to pay attention to the effectiveness of replicas from 0 to N. If the minimum number of replicas is greater than 0, it will occupy resources for some services. Next, we will try to solve the problem of 0 to N performance and resource occupation.
The article is unified in the official account of the cloud.