Apache Kafka is an open source stream processing platform managed by Apache and written by Scala and Java. It provides unified, high throughput and low latency features for processing real-time data.
Its persistence layer is essentially a "large-scale publish / subscribe message queue according to the distributed transaction log architecture", which makes it very valuable as an enterprise infrastructure to process streaming data. At present, it has been used by thousands of Companies in the fields of high-performance data pipeline, flow analysis, data integration and mission critical applications.
Implementation method: Kafka logger
Apache APIs IX has provided the support of Kafka logger plug-in since version 1.2, and has been strengthened for many times. At present, it has very mature and perfect functions. It supports pushing API request logs, even request bodies and response bodies to Kafka cluster in JSON format.
When using Kafka logger, users can send a variety of data and customize the sending log format. At the same time, it also supports the functions of packaging and sending logs in batch processing or automatic retry.
How to use
Step 1: start Kafka cluster
This example only demonstrates one startup mode, and the details of other startup modes can be referred to Official documents.
# Start a cluster with one zookeeper node and three kafka nodes using docker compose
# At the same time, an EFAK is also started for data monitoring.
version: '3'

services:
  zookeeper:
    image: confluentinc/cp-zookeeper:6.2.1
    hostname: zookeeper
    ports:
      - "2181:2181"
    environment:
      ZOOKEEPER_CLIENT_PORT: 2181
      ZOOKEEPER_SERVER_ID: 1
      ZOOKEEPER_SERVERS: zookeeper:2888:3888

  kafka1:
    image: confluentinc/cp-kafka:6.2.1
    hostname: kafka1
    ports:
      - "9092:9092"
    environment:
      KAFKA_ADVERTISED_LISTENERS: LISTENER_DOCKER_INTERNAL://kafka1:19092,LISTENER_DOCKER_EXTERNAL://${DOCKER_HOST_IP:-127.0.0.1}:9092
      KAFKA_LISTENER_SECURITY_PROTOCOL_MAP: LISTENER_DOCKER_INTERNAL:PLAINTEXT,LISTENER_DOCKER_EXTERNAL:PLAINTEXT
      KAFKA_INTER_BROKER_LISTENER_NAME: LISTENER_DOCKER_INTERNAL
      KAFKA_ZOOKEEPER_CONNECT: "zookeeper:2181"
      KAFKA_BROKER_ID: 1
      KAFKA_LOG4J_LOGGERS: "kafka.controller=INFO,kafka.producer.async.DefaultEventHandler=INFO,state.change.logger=INFO"
    depends_on:
      - zookeeper

  kafka2:
    image: confluentinc/cp-kafka:6.2.1
    hostname: kafka2
    ports:
      - "9093:9093"
    environment:
      KAFKA_ADVERTISED_LISTENERS: LISTENER_DOCKER_INTERNAL://kafka2:19093,LISTENER_DOCKER_EXTERNAL://${DOCKER_HOST_IP:-127.0.0.1}:9093
      KAFKA_LISTENER_SECURITY_PROTOCOL_MAP: LISTENER_DOCKER_INTERNAL:PLAINTEXT,LISTENER_DOCKER_EXTERNAL:PLAINTEXT
      KAFKA_INTER_BROKER_LISTENER_NAME: LISTENER_DOCKER_INTERNAL
      KAFKA_ZOOKEEPER_CONNECT: "zookeeper:2181"
      KAFKA_BROKER_ID: 2
      KAFKA_LOG4J_LOGGERS: "kafka.controller=INFO,kafka.producer.async.DefaultEventHandler=INFO,state.change.logger=INFO"
    depends_on:
      - zookeeper


  kafka3:
    image: confluentinc/cp-kafka:6.2.1
    hostname: kafka3
    ports:
      - "9094:9094"
    environment:
      KAFKA_ADVERTISED_LISTENERS: LISTENER_DOCKER_INTERNAL://kafka3:19094,LISTENER_DOCKER_EXTERNAL://${DOCKER_HOST_IP:-127.0.0.1}:9094
      KAFKA_LISTENER_SECURITY_PROTOCOL_MAP: LISTENER_DOCKER_INTERNAL:PLAINTEXT,LISTENER_DOCKER_EXTERNAL:PLAINTEXT
      KAFKA_INTER_BROKER_LISTENER_NAME: LISTENER_DOCKER_INTERNAL
      KAFKA_ZOOKEEPER_CONNECT: "zookeeper:2181"
      KAFKA_BROKER_ID: 3
      KAFKA_LOG4J_LOGGERS: "kafka.controller=INFO,kafka.producer.async.DefaultEventHandler=INFO,state.change.logger=INFO"
    depends_on:
      - zookeeper

  efak:
    image: nickzurich/kafka-eagle:2.0.9
    hostname: efak
    ports:
      - "8048:8048"
    depends_on:
      - kafka1
      - kafka2
      - kafka3
Step 2: create Topic
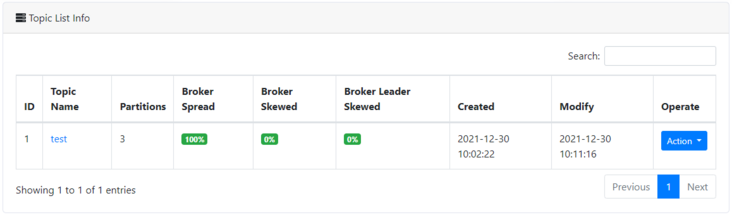
Next, we create a test Topic to collect logs.
Step 3: create a route and open the plug-in
Route creation and Kafka logger plug-in can be started through the following command.
curl -XPUT 'http://127.0.0.1:9080/apisix/admin/routes/r1' \
--header 'X-API-KEY: edd1c9f034335f136f87ad84b625c8f1' \
--header 'Content-Type: application/json' \
--data-raw '{
    "uri": "/*",
    "plugins": {
        "kafka-logger": {
            "batch_max_size": 1,
            "broker_list": {
                "127.0.0.1": 9092
            },
            "disable": false,
            "kafka_topic": "test",
            "producer_type": "sync"
        }
    },
    "upstream": {
        "nodes": {
            "httpbin.org:80": 1
        },
        "type": "roundrobin"
    }
}'
The above code configures the kafka broker address, target Topic, synchronous production mode and the maximum number of logs contained in each batch. Here we can first batch_ max_ If the size is set to 1, a message will be written to Kafka every time a log is generated.
Through the above settings, you can send the API request log under the / * path to Kafka.
Step 4: send request
Next, we send some requests through the API and record the number of requests.
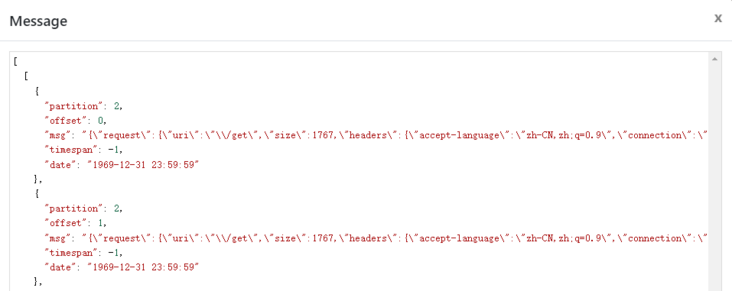
# Send 10 requests to API
curl http://127.0.0.1:9080/get
As can be seen from the following figure, some log messages have been written to the test topic we created. Click to view the log content, and you can find that the above API request log has been written.

Custom log structure
Of course, during use, we can also set the log data structure sent to Kafka through the metadata configuration provided by Kafka logger plug-in. By setting log_format data, which can control the type of data sent.
For example, $host, $time in the following data_ Iso8601, etc. are all from the built-in variables provided by Nginx; It also supports such as $route_id and $service_id and other variables provided by apisik.
curl -XPUT 'http://127.0.0.1:9080/apisix/admin/plugin_metadata/kafka-logger' \
--header 'X-API-KEY: edd1c9f034335f136f87ad84b625c8f1' \
--header 'Content-Type: application/json' \
--data-raw '{
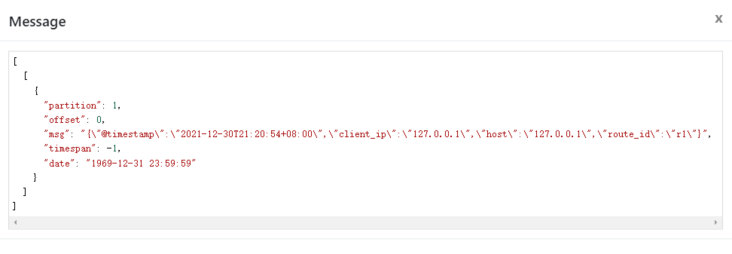
"log_format": {
"host": "$host",
"@timestamp": "$time_iso8601",
"client_ip": "$remote_addr",
"route_id": "$route_id"
}
}'By sending a request for a simple test, you can see that the above log structure settings have taken effect. At present, Apache APISIX provides a variety of log format templates, which has great flexibility in configuration. For more details of log format, please refer to Official documents.
Close plug-in
If it is used, just remove the configuration of Kafka logger plug-in in the routing configuration and save it to close the plug-in on the routing. Thanks to the dynamic advantages of Apache APIs IX, it is very convenient to start and close the plug-in without restarting Apache APIs IX.
$ curl http://127.0.0.1:9080/apisix/admin/routes/1  -H 'X-API-KEY: edd1c9f034335f136f87ad84b625c8f1' -X PUT -d '
{
    "methods": ["GET"],
    "uri": "/hello",
    "plugins": {},
    "upstream": {
        "type": "roundrobin",
        "nodes": {
            "127.0.0.1:1980": 1
        }
    }
}'
summary
This article introduces the function prospect and use steps of Kafka logger plug-in. For more instructions and complete configuration list of Kafka logger plug-in, you can refer to Official documents.
At present, we are also developing other log plug-ins to integrate with more related services. If you are interested in such integration projects, please feel free to GitHub Discussions Initiate discussion or adopt mailing list Communicate.