The previous article introduced the business background of the website click stream data analysis project; this blogger will continue to share the relevant knowledge of website analysis.
I. Overall technical process and architecture
1.1. Data Processing Flow
This project is a pure data analysis project, and its overall process is basically based on the data processing process. There are the following major steps:
1) Data acquisition
First, access behavior is acquired by embedding JS code into the page and sent to the background log of the web service.
Next, the click-stream logs generated on each server are aggregated into the HDFS file system in real time or in batches.
Of course, in a comprehensive analysis system, the data source may not only contain click stream data, but also business data in the database (such as user information, commodity information, order information, etc.) and useful external data for analysis.
2) Data preprocessing
Pre-process the collected click stream data through mapreduce program, such as cleaning, formatting, filtering dirty data, etc.
3) Data warehousing
Import the pre-processed data into the corresponding libraries and tables in the HIVE warehouse
4) Data analysis
The core content of the project is to develop ETL analysis statements according to the requirements and get various statistical results.
5) Data presentation
Visualize the data from the analysis
1.2. Project structure
Since this project is a pure data analysis project, its overall structure matches the analysis process, and there is no particularly complex structure, as shown in the following figure:

Among them, it should be emphasized that the data analysis of the system is not one-time, but is calculated repeatedly according to a certain time and frequency, so the links in the whole processing chain need to be closely linked according to a certain sequence dependency relationship, which involves the management and scheduling of a large number of task units, so a task scheduling module needs to be added to the project (here can be done). From what I said before azkaban Replace OOZIE.
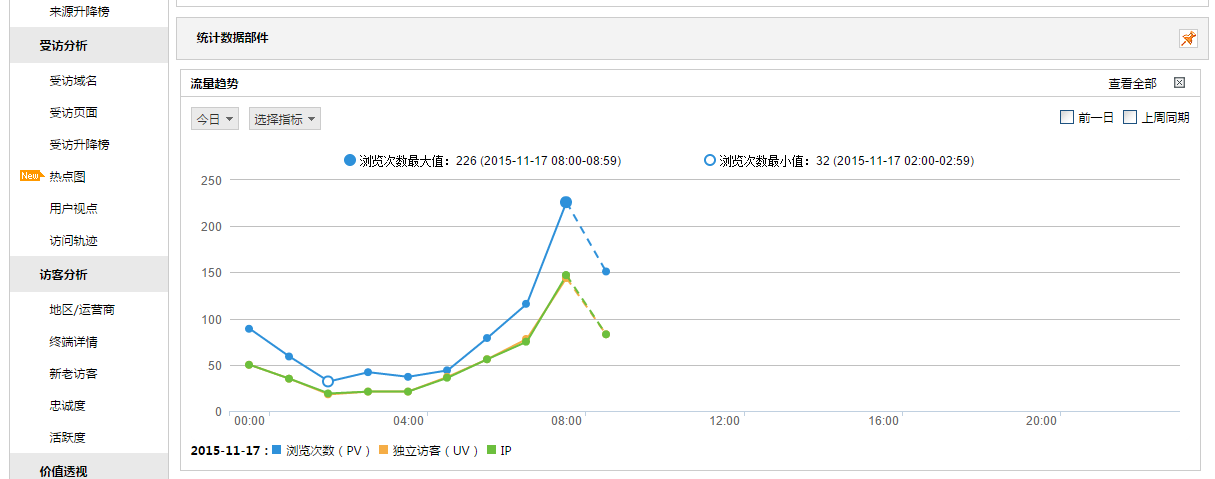
1.3. Data presentation
The purpose of data presentation is to visualize the data obtained from the analysis so that operational decision makers can obtain data more easily and understand the data more quickly and simply. Spring MVC + echarts can be implemented with a simple architecture.
Module Development-Data Acquisition
2.1. Demand
Data acquisition needs are broadly divided into two parts.
1) It collects user's access behavior on the page and develops it specifically:
1. Developing Page Buried Point js to Collect User Access Behavior
Background acceptance page js request log
This part of the work can also be attributed to the "data source", whose development is usually undertaken by the web development team.
2) It gathers logs from web servers to HDFS, which is the data acquisition of data analysis system. This part of the work is undertaken by the data analysis platform construction team. Specific technologies are implemented in many ways:
Shell script
Advantages: Lightweight, simple development
Disadvantage: Inconvenient control of fault-tolerant processing in log acquisition
Java Collector
Advantages: fine control of the collection process
Disadvantage: High development workload
Flume Log Collection Framework
A mature open source log collection system, which is itself a member of hadoop ecosystem, has a natural affinity and scalability with various framework components in hadoop system.
2.2. Technical Selection
In the scenario of click-stream log analysis, the reliability and fault tolerance requirements of data acquisition are usually not very strict, so the general flume log acquisition framework can fully meet the requirements.
This project uses flume to collect logs.
Flume Log Acquisition System
1. Data Source Information
The data analyzed in this project are stored on various nginx servers using traffic logs generated by nginx servers, such as:
/var/log/httpd/access_log.2015-11-10-13-00.log
/var/log/httpd/access_log.2015-11-10-14-00.log
/var/log/httpd/access_log.2015-11-10-15-00.log
/var/log/httpd/access_log.2015-11-10-16-00.log
2. Sample data content
The specific content of data need not be paid much attention in the collection stage.
58.215.204.118 - - [18/Sep/2013:06:51:35 +0000] "GET /wp-includes/js/jquery/jquery.js?ver=1.10.2 HTTP/1.1" 304 0 "http://blog.fens.me/nodejs-socketio-chat/" "Mozilla/5.0 (Windows NT 5.1; rv:23.0) Gecko/20100101 Firefox/23.0"
Field resolution:
Visitor ip address: 58.215.204.118
2. Visitor user information:--
3. Request time: [18/Sep/2013:06:51:35+0000]
4. Request mode: GET
5. url:/wp-include/js/jquery/jquery.js?Ver=1.10.2
6. Protocol used for requests: HTTP/1.1
7. Response code: 304
8. Data flow returned: 0
9. Source url of visitors: http://blog.fens.me/nodejs-socketio-chat/
10. Visitor's browser: Mozilla/5.0 (Windows NT 5.1; rv: 23.0) Gecko/2010 101 Firefox/23.0
3. Generation Rules of Log Files
The basic law is:
The file currently being written is access_log.
The volume of the file is 256M, or the interval is 60 minutes, that is, scrolling rename to switch to history log file;
access_log.2015-11-10-13-00.log
Of course, each company's web server log strategy is different and can be defined in the log4j.properties of the web program as follows:
log4j.appender.logDailyFile = org.apache.log4j.DailyRollingFileAppender
log4j.appender.logDailyFile.layout = org.apache.log4j.PatternLayout
log4j.appender.logDailyFile.layout.ConversionPattern = [%-5p][%-22d{yyyy/MM/dd HH:mm:ssS}][%l]%n%m%n
log4j.appender.logDailyFile.Threshold = DEBUG
log4j.appender.logDailyFile.ImmediateFlush = TRUE
log4j.appender.logDailyFile.Append = TRUE
log4j.appender.logDailyFile.File = /var/logs/access_log
log4j.appender.logDailyFile.DatePattern = '.'yyyy-MM-dd-HH-mm'.log'
log4j.appender.logDailyFile.Encoding = UTF-8
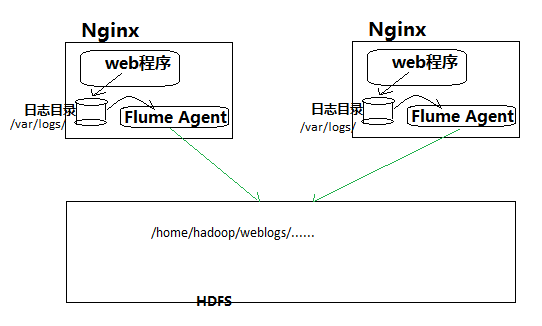
4. Implementation of Flume Acquisition
Flume acquisition system is relatively simple to build.
1. Deploy agent nodes on a web server and modify configuration files
2. Start the agent node to aggregate the collected data into the specified HDFS directory
The following picture:
Version selection: apache-flume-1.7.0
Collection rule design:
Collection Source: nginx Server Log Directory
2. Deposit: hdfs directory / home/hadoop/weblogs/
Collect Rule Configuration Details
agent1.sources = source1
agent1.sinks = sink1
agent1.channels = channel1

# Describe/configure spooldir source1
#agent1.sources.source1.type = spooldir
#agent1.sources.source1.spoolDir = /var/logs/nginx/
#agent1.sources.source1.fileHeader = false

# Describe/configure tail -F source1
#Using exec as data source source component
agent1.sources.source1.type = exec
#Real-time collection of newly generated log data using tail-F command
agent1.sources.source1.command = tail -F /var/logs/nginx/access_log
agent1.sources.source1.channels = channel1

#configure host for source
#Configure an interceptor plug-in
agent1.sources.source1.interceptors = i1
agent1.sources.source1.interceptors.i1.type = host
#Use the interceptor plug-in to get the host name of the server where the agent is located
agent1.sources.source1.interceptors.i1.hostHeader = hostname

#Configure sink component to hdfs
agent1.sinks.sink1.type = hdfs
#a1.sinks.k1.channel = c1

#agent1.sinks.sink1.hdfs.path=hdfs://hdp-node-01:9000/weblog/flume-collection/%y-%m-%d/%H%M%S
#Specify the path from file sink to hdfs
agent1.sinks.sink1.hdfs.path=
hdfs://hdp-node-01:9000/weblog/flume-collection/%y-%m-%d/%H-%M_%hostname
#Specify filename prefix
agent1.sinks.sink1.hdfs.filePrefix = access_log
agent1.sinks.sink1.hdfs.maxOpenFiles = 5000
#Specify the number of records for each batch of sinking data
agent1.sinks.sink1.hdfs.batchSize= 100
agent1.sinks.sink1.hdfs.fileType = DataStream
agent1.sinks.sink1.hdfs.writeFormat =Text
#Specify that the sinking file scrolls by 1G size
agent1.sinks.sink1.hdfs.rollSize = 1024*1024*1024
#Specify that the sinking file scrolls by 1000000 bars
agent1.sinks.sink1.hdfs.rollCount = 1000000
#Specify a sink file to scroll in 30 minutes
agent1.sinks.sink1.hdfs.rollInterval = 30
#agent1.sinks.sink1.hdfs.round = true
#agent1.sinks.sink1.hdfs.roundValue = 10
#agent1.sinks.sink1.hdfs.roundUnit = minute
agent1.sinks.sink1.hdfs.useLocalTimeStamp = true

# Use a channel which buffers events in memory
#Use memory type channel
agent1.channels.channel1.type = memory
agent1.channels.channel1.keep-alive = 120
agent1.channels.channel1.capacity = 500000
agent1.channels.channel1.transactionCapacity = 600

# Bind the source and sink to the channel
agent1.sources.source1.channels = channel1
agent1.sinks.sink1.channel = channel1
Start the acquisition
On the nginx server where flume is deployed, start the agent of flume with the following commands:
bin/flume-ng agent --conf ./conf -f ./conf/weblog.properties.2 -n agent
Note: The - n parameter in the startup command gives the agent name to be configured in the configuration file
3. Module Development-Data Preprocessing
3.1 Main purposes: a. filtering "irregular" data; b. format conversion and adjustment; c. filtering and separating the basic data of different topics (different column paths) according to the follow-up statistical requirements
3.2 Implementation: Develop a mr program WeblogPreProcess (too long, see Log analysis of large Internet e-commerce companies with big data hadoop,web Log Data Cleaning)
public class WeblogPreProcess {
	static class WeblogPreProcessMapper extends Mapper<LongWritable, Text, Text, NullWritable> {
		Text k = new Text();
		NullWritable v = NullWritable.get();
		@Override
		protected void map(LongWritable key, Text value, Context context) throws IOException, InterruptedException {
			String line = value.toString();
			WebLogBean webLogBean = WebLogParser.parser(line);
//			WebLogBean productWebLog = WebLogParser.parser2(line);
//			WebLogBean bbsWebLog = WebLogParser.parser3(line);
//			WebLogBean cuxiaoBean = WebLogParser.parser4(line);
			if (!webLogBean.isValid())
				return;
			k.set(webLogBean.toString());
			context.write(k, v);
//			k.set(productWebLog);
//			context.write(k, v);
		}
	}
	public static void main(String[] args) throws Exception {

		Configuration conf = new Configuration();
		Job job = Job.getInstance(conf);
		job.setJarByClass(WeblogPreProcess.class);
		job.setMapperClass(WeblogPreProcessMapper.class);
		job.setOutputKeyClass(Text.class);
		job.setOutputValueClass(NullWritable.class);
		FileInputFormat.setInputPaths(job, new Path(args[0]));
        FileOutputFormat.setOutputPath(job, new Path(args[1]));
		job.waitForCompletion(true);

	}
}
Running mr to preprocess data
hadoop jar weblog.jar cn.itcast.bigdata.hive.mr.WeblogPreProcess /weblog/input /weblog/preout
3.3 Click Stream Model Data Combing
Since a large number of statistical indicators are easier to derive from the click-stream model, in the pre-processing stage, the mr program can be used to generate the data of the click-stream model.
3.3.1 Click Stream Model pageviews table
Pageviews table model data generation
See Engineering for Code
hadoop jar weblogpreprocess.jar  \
cn.itcast.bigdata.hive.mr.ClickStreamThree   \
/user/hive/warehouse/dw_click.db/test_ods_weblog_origin/datestr=2013-09-20/ /test-click/pageviews/
Table structure:
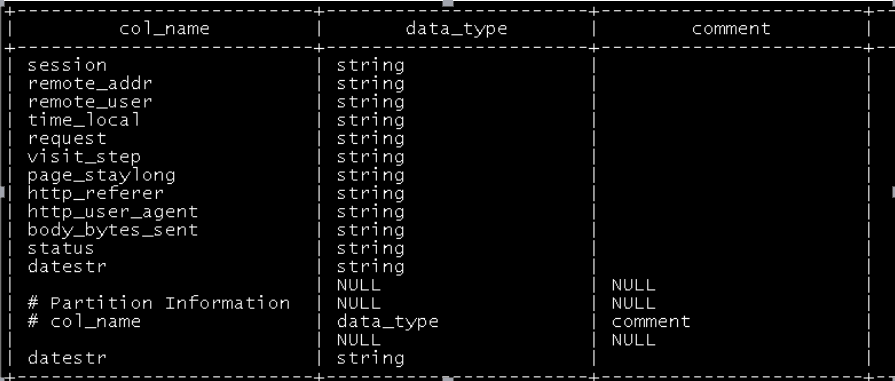
(See Section 6.2 for table definition and data import)
3.3.2 Click Flow Model visit Information Table
Note: "One visit" = "N consecutive requests"
It is difficult to get the "secondary" access information of each person directly from the original data using hql grammar. mapreduce program can be used to analyze the original data to get the "secondary" information data, and then use hql to do more dimension statistics.
Using MR program to sort out the start and end time and page information of each visit from pageviews data
See Engineering for Code
hadoop jar weblogpreprocess.jar cn.itcast.bigdata.hive.mr.ClickStreamVisit /weblog/sessionout /weblog/visitout
Next, build the Click Flow visit Model Table in the hive Warehouse
load data inpath '/weblog/visitout' into table click_stream_visit partition(datestr='2013-09-18');