
Summary
Previously, Ofter detailed how to write visualization screens from scratch using Vue. Today, we'll show you how to write visualization charts using React. Why are we still learning React? Because of its lightweight nature, visualization charts like antv are all in React, although antv has one viser (React/Vue/Angular three front-end languages are supported), but the chart is not antv complete and the documentation is unclear.
Knowledge Point 1: Differences between React and Vue
| React | Vue | |
| assembly | React is lightweight and refines the component functionality, which is what you need, and then introduces it one by one (for example, to use link functionality, you need to introduce <Link>components). Therefore, React requires developers to have a certain front-end foundation, which is more suitable for professionals to build lightweight systems. | Vue encapsulation components are more powerful, even for beginners, you can introduce components without knowing many principles. As a result, Vue introduces more component redundancy as functions become more and more. |
| data | react as a whole is a function-based idea, which designs components as pure components. State and logic are passed in through parameters and belong to one-way data flow. Data visualization often does not require two-way data flow. | The idea of vue is responsive, that is, based on data variability, by establishing a Watcher for each attribute to listen for, when the attribute changes, a responsive update of the corresponding virtual dom. |
| js | react is all in js, generates html through js, and manipulates css, styled-component, jss, and so on through js. | vue is a combination of html, css and js. vue has a single file component which can write html, css and JS to a file. HTML provides a template engine to process them. |
I. Preparations
Compilation tool: Pycharm
Point 2: Front-end building tools: Vite
New front-end building tools can significantly enhance the front-end development experience. Previously, Ofter introduced that the vue project creation tool is webpack, but it has a big disadvantage that the packaging will be slower as the project gets bigger. This set of visualization library charts is more, so Amway vite is a front-end construction tool.
Point 3: Front-end compiler: TypeScript
TypeScript is a type-defined superset of JS compiled to pure JS, suitable for large-scale JavaScript applications. TS has obvious benefits in terms of teamwork, maintainability, readability, stability (exposing bug s ahead of time during compilation).
1. Create a project
1.1 Create react project with vite
The lower left Terminal terminal executes the following commands
npm create @vitejs/app
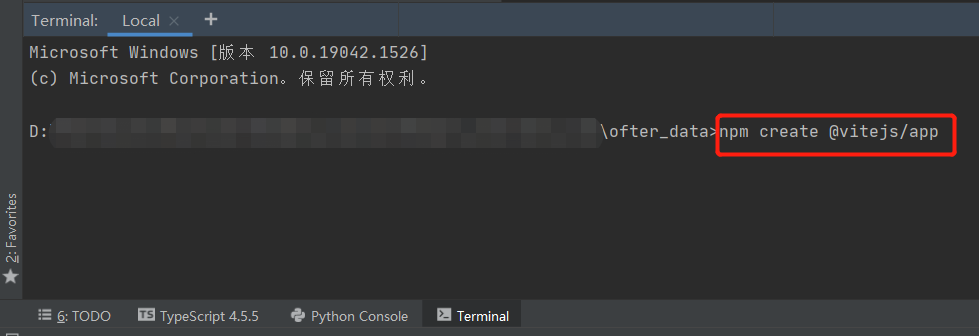
Note: Before Ofter shared with you the idea of creating a vue project with a webpack, webpack has a big drawback. As the project gets bigger and slower, using vite will be much faster and more development-friendly.
1.2 Select react/react-ts
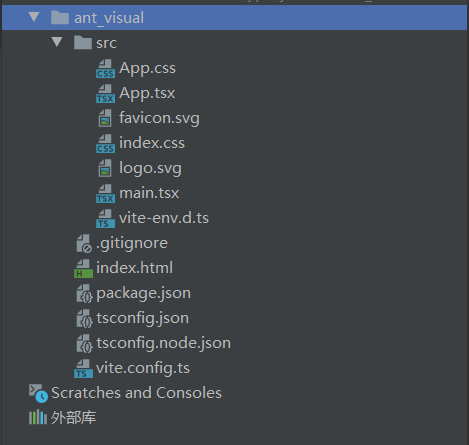
√ Project name: ant-visual
√ Select a framework: » react
√ Select a variant: » react-ts
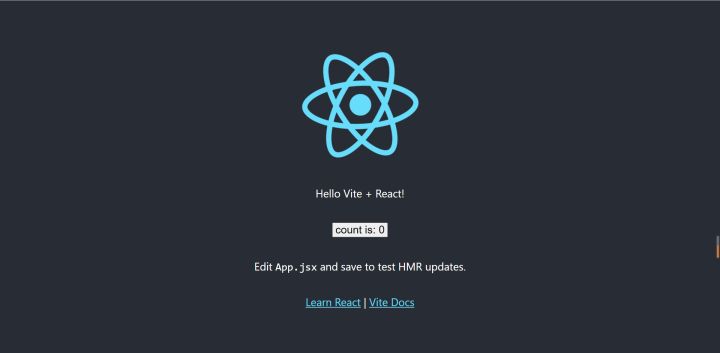
1.3 Start project testing
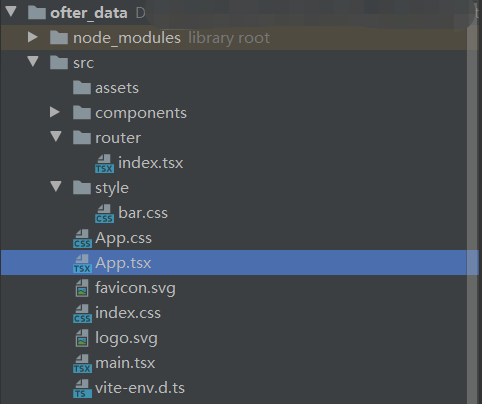
After creating the project structure, we can see that it is much simpler than the vue project structure.
cd ant_visual //Project Name
npm run dev
2. Installation Library
This time we take the anvt/g2 chart library as an example, install'@antv/g2', and if we need to use routing, install a'react-router-dom'
npm install @antv/g2
npm install react-router-dom
3. Create new directories and files
3.1 Create a new components directory and tsx file
(TypeScript JSX File)
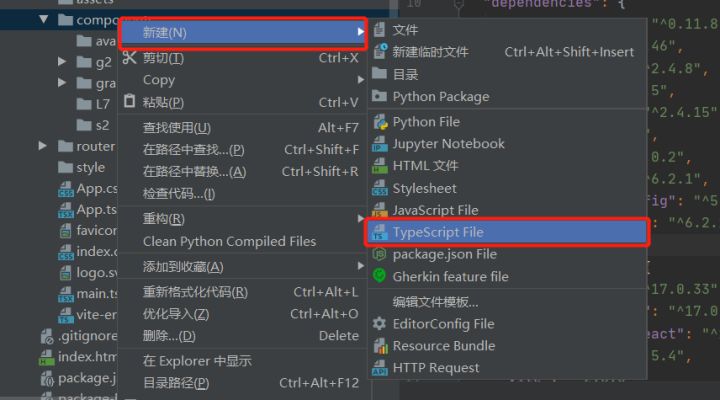
3.2 Create a new assets and style directory
3.3 Create a new router directory and index.tsx file
2. Chart implementation
1. Chart Cases
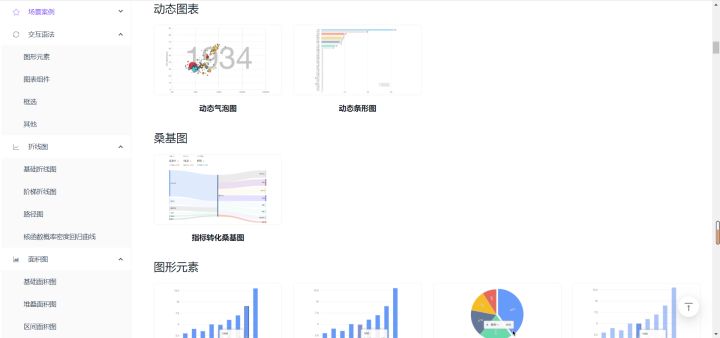
Let's start by looking at the antv/g2 charts, which have many interactive charts in addition to the commonly used column and line charts.
2. Chart Code
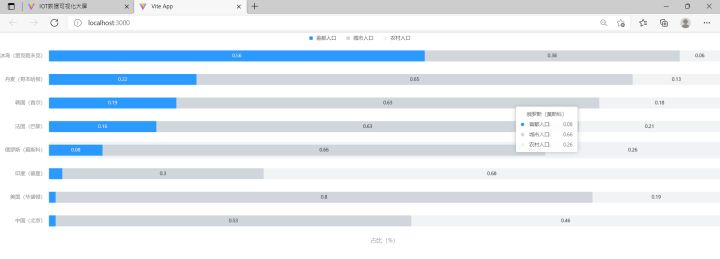
Ofter starts with a simple bar chart and gives a complete demonstration.
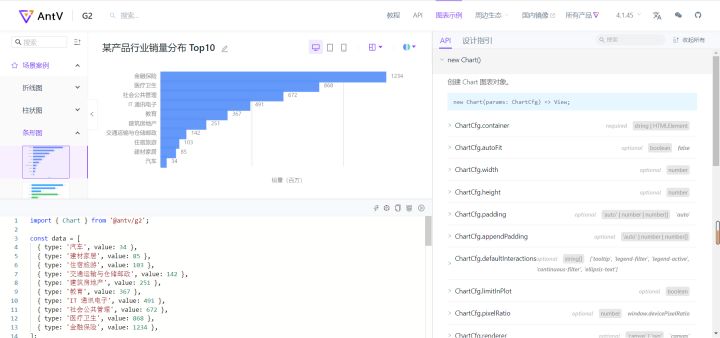
2.1 Create a new Bar under components. TSX
At the same time, we can copy the code on the official website to Bar. In tsx, like vue, this code is not directly usable and needs some adjustments.
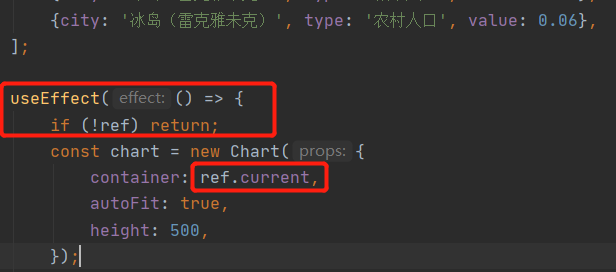
Knowledge Point 4: Chart Rendering
Both Vue and react need to render the Dom, typically through IDs and refs in <div id='a'ref='b'>, but the writing in react is a little different from that in vue.
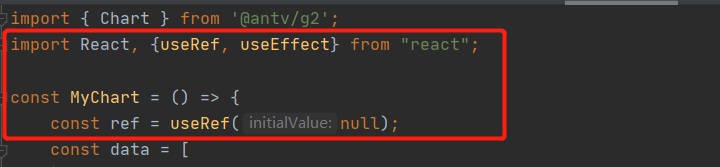
2.2 Introducing useRef, useEffect
On the basis of the official website code, we need to add the following code:
Change the container content in new Chart() to ref.current
The complete code is as follows:
import { Chart } from '@antv/g2';
import React, {useRef, useEffect} from "react";
const MyChart = () => {
const ref = useRef(null);
const data = [
{city: 'China (Beijing)', type: 'Capital Population', value: 0.01},
{city: 'China (Beijing)', type: 'Urban population', value: 0.53},
{city: 'China (Beijing)', type: 'rural population', value: 0.46},
{city: 'United States (Washington)', type: 'Capital Population', value: 0.01},
{city: 'United States (Washington)', type: 'Urban population', value: 0.8},
{city: 'United States (Washington)', type: 'rural population', value: 0.19},
{city: 'India (Delhi)', type: 'Capital Population', value: 0.02},
{city: 'India (Delhi)', type: 'Urban population', value: 0.3},
{city: 'India (Delhi)', type: 'rural population', value: 0.68},
{city: 'Russia (Moscow)', type: 'Capital Population', value: 0.08},
{city: 'Russia (Moscow)', type: 'Urban population', value: 0.66},
{city: 'Russia (Moscow)', type: 'rural population', value: 0.26},
{city: 'France (Paris)', type: 'Capital Population', value: 0.16},
{city: 'France (Paris)', type: 'Urban population', value: 0.63},
{city: 'France (Paris)', type: 'rural population', value: 0.21},
{city: 'Korea (Seoul)', type: 'Capital Population', value: 0.19},
{city: 'Korea (Seoul)', type: 'Urban population', value: 0.63},
{city: 'Korea (Seoul)', type: 'rural population', value: 0.18},
{city: 'Denmark (Copenhagen)', type: 'Capital Population', value: 0.22},
{city: 'Denmark (Copenhagen)', type: 'Urban population', value: 0.65},
{city: 'Denmark (Copenhagen)', type: 'rural population', value: 0.13},
{city: 'Iceland (Reykjavik)', type: 'Capital Population', value: 0.56},
{city: 'Iceland (Reykjavik)', type: 'Urban population', value: 0.38},
{city: 'Iceland (Reykjavik)', type: 'rural population', value: 0.06},
];
useEffect(() => {
if (!ref) return;
const chart = new Chart({
container: ref.current,
autoFit: true,
height: 500,
});
chart.data(data);
chart.scale('value', {
alias: 'Percentage (%)',
});
chart.axis('city', {
tickLine: null,
line: null,
});
chart.axis('value', {
label: null,
title: {
style: {
fontSize: 14,
fontWeight: 300,
},
},
grid: null,
});
chart.legend({
position: 'top',
});
chart.coordinate('rect').transpose();
chart.tooltip({
shared: true,
showMarkers: false,
});
chart.interaction('active-region');
chart
.interval()
.adjust('stack')
.position('city*value')
.color('type*city', (type, city) => {
if (type === 'Capital Population') {
return '#1890ff';
}
if (type === 'Urban population') {
return '#ced4d9';
}
if (type === 'rural population') {
return '#f0f2f3';
}
if (type === 'Capital Population' && city === 'China (Beijing)') {
return '#f5222d';
}
})
.size(26)
.label('value*type', (val, t) => {
const color = t === 'Capital Population' ? 'white' : '#47494b';
if (val < 0.05) {
return null;
}
return {
position: 'middle',
offset: 0,
style: {
fontSize: 12,
fill: color,
lineWidth: 0,
stroke: null,
shadowBlur: 2,
shadowColor: 'rgba(0, 0, 0, .45)',
},
};
});
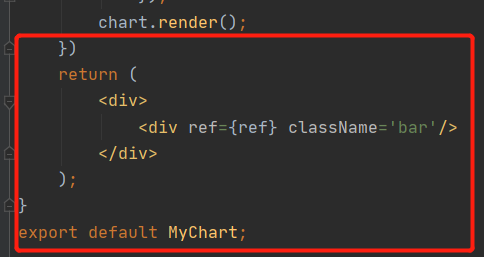
chart.render();
})
return (
<div>
<div ref={ref} className='bar'/>
</div>
);
}
export default MyChart;
2.3 App. Importing components into TSX
So we can go to App. Introducing the shape chart component in TSX
import './App.css';
import React from 'react';
import Bar1 from './components/Bar';
function App(){
return (
<div className='App'>
<Bar1 />
</div>
)
}
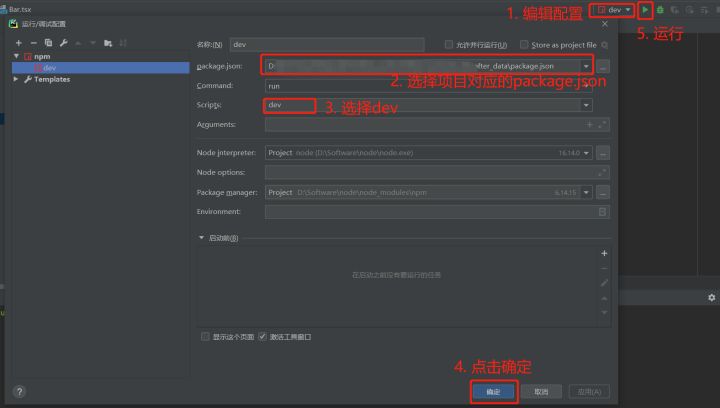
export default App;2.4 Running Project
3. CSS style code
If we need to do a visualization screen, we also need to write a css style (className we've defined as'bar'in Bar.tsx)
3.1 Create a bar in the style directory. CSS
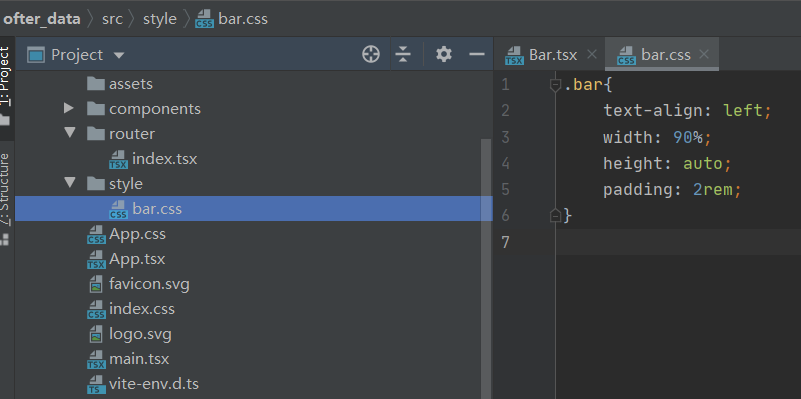
css code:
.bar{
    text-align: left;
    width: 50%;
    height: auto;
    padding: 2rem;
}
Of course, we can also use existing Apps. CSS writing style, so that I can easily distinguish it, I will write it alone.
3.2 in Bar. Introducing css styles into TSX
import '../style/bar.css'
3.3 Running Project
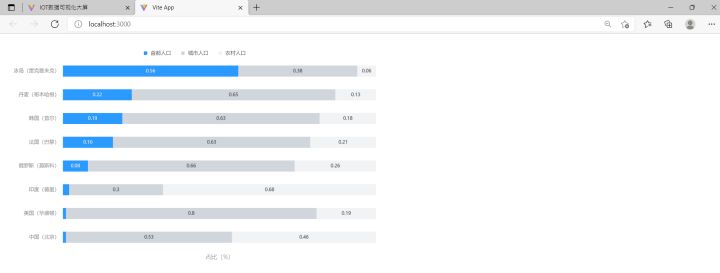
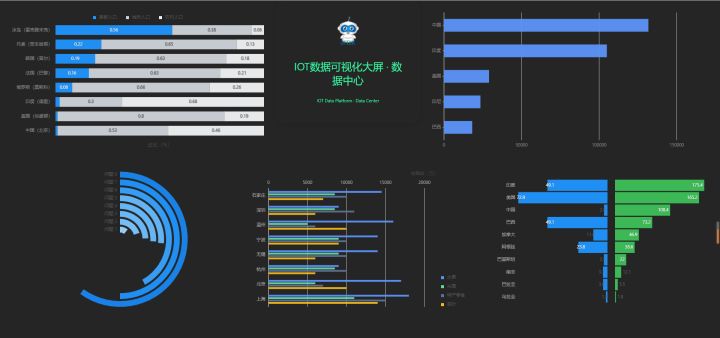
3. Large screen with bar chart combination
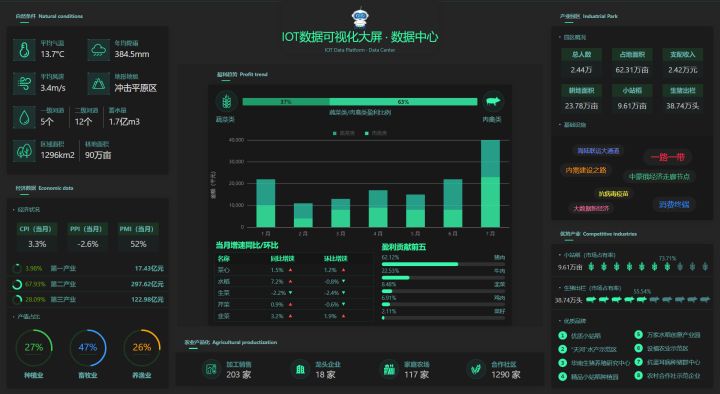
Ofter uses the flex layout, which is relatively simple. If you want to learn, you can enter the following links: Learn to use HTML-flex layout, make beautiful web pages, want to make a nice small system, we also need to learn some front-end knowledge, today OF will explain how to make a good page with pycharm (a good tool for full stack development), after which we can develop web pages/websites by ourselves and put them on the Internet. https://mp.weixin.qq.com/s/Q_IFlyUOKXiSXox6Aadnsg
4. Summary and next forecast
To summarize, this Ofter explains how to use vite, react, ts, antv/g2 to make a lightweight, static visualization chart, and some of the differences between vue and react. If we need to make a larger screen with more complete charts, better performance, and more dynamic data, Ofter will introduce you next time because of the limited space:
- Increase Router routing;
- Increase lazy loading;
- Get data dynamically.
If you need the source code, check out the following (or commentary) method for free (the benefit of downloading the code is that you don't need to go back to the environment yourself, as long as the npm install installs the library and runs)