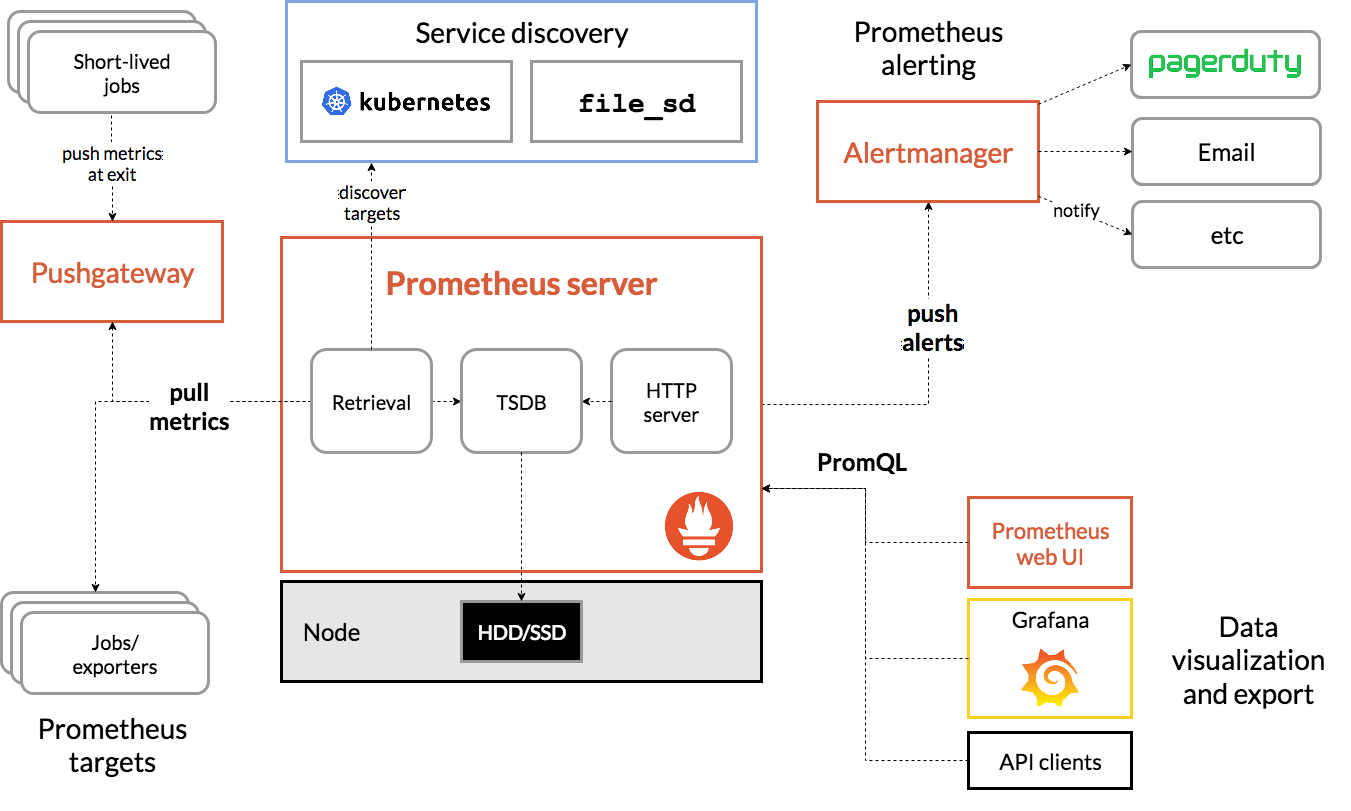
1, JVM monitoring
Installing node based on docker_ exporter+prometheus+grafana
Download Image package:
docker pull prom/node_exporter
docker pull prom/prometheus
docker pull grafana/grafana
docker pull timonwong/prometheus-webhook-dingtalk
1. Start node exporter
docker run -d --name node_exporter -p 9100:9100 \
  -v "/proc:/host/proc:ro" \
  -v "/sys:/host/sys:ro" \
  -v "/:/rootfs:ro" \
  --net="host" \
  prom/node-exporter
2. Start prometheus
Create a new directory Prometheus and edit the configuration file prometheus.yml
mkdir /opt/prometheus
cd /opt/prometheus/
vim prometheus.yml
The contents are as follows:
##Data collection Job configuration
scrape_configs:
  ###The following is the configuration of prometheus itself
  - job_name: 'prometheus'
    static_configs:
      - targets: [ '192.168.1.4:9090' ]
        labels:
          appname: 'prometheus'
  ###The following is the SpringBoot application configuration
  #- job_name: 'springboot_prometheus'
  #  scrape_interval: 5s
  #  metrics_path: '/actuator/prometheus'
  #  static_configs:
  #    - targets: [ '192.168.164.xx:9999' ]
  #      labels:
  #        appname: 'springboot_prometheus'
  ###The following is the JMX exporter application configuration
  - job_name: 'jmx-exporter'
    scrape_interval: 10s
    metrics_path: '/metrics'
    static_configs:
      - targets: [ '192.168.1.4:3010','192.168.1.4:3011','192.168.1.4:3012']
        labels:
          appname: 'jmx-exporter'
Note: modify the IP address. 192.168.1.4 here is the local address
Start prometheus
docker run  -d  --name prometheus \
  -p 9090:9090 \
  -v /Users/software/docker/prometheus/prometheus.yml:/etc/prometheus/prometheus.yml  \
  prom/prometheus

docker cp node_alived.yml prometheus:/etc/prometheus/
Wait a few seconds to view the port status
root@ubuntu:/opt/prometheus# netstat -anpt
Active Internet connections (servers and established)
Proto Recv-Q Send-Q Local Address           Foreign Address         State       PID/Program name
tcp        0      0 0.0.0.0:22              0.0.0.0:*               LISTEN      1147/sshd
tcp        0     36 192.168.91.132:22       192.168.91.1:63648      ESTABLISHED 2969/0
tcp        0      0 192.168.91.132:22       192.168.91.1:63340      ESTABLISHED 1321/1
tcp6       0      0 :::9100                 :::*                    LISTEN      3070/node_exporter
tcp6       0      0 :::22                   :::*                    LISTEN      1147/sshd
tcp6       0      0 :::9090                 :::*                    LISTEN      3336/docker-proxy
Access url:
http://192.168.1.4:9090/graph
The effects are as follows:
Access targets, and the url is as follows:
http://192.168.1.4:9090/targets
The effects are as follows:
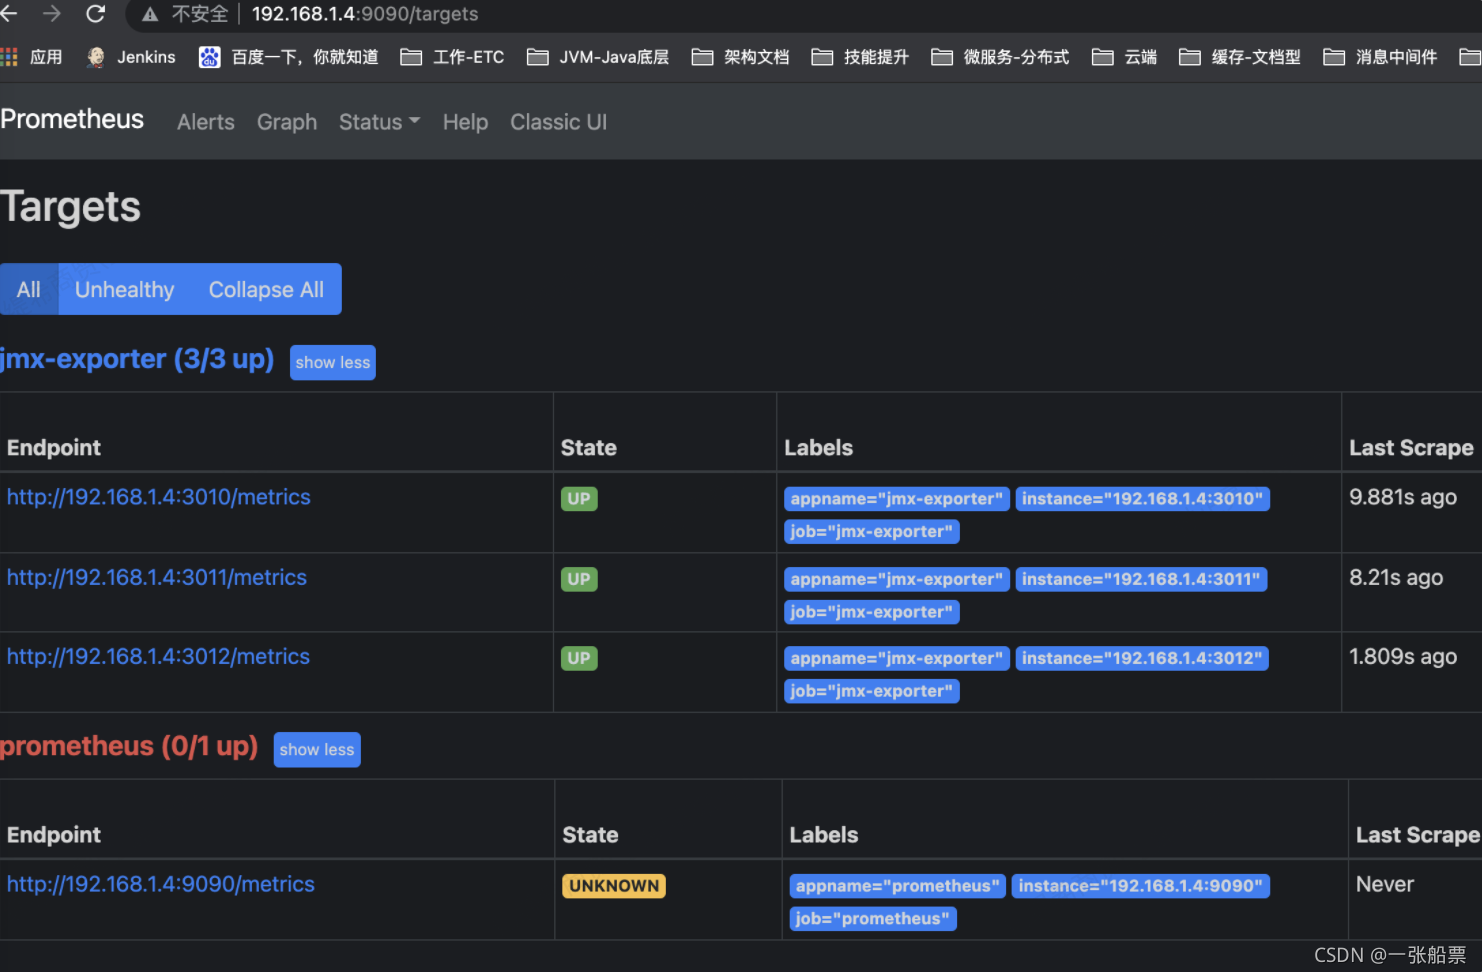
If the status is not UP, wait for a while and it will be UP
3. Start grafana
Create a new empty folder grafana storage to store data
mkdir /grafana-storage
Set permissions
chmod 777 -R /grafana-storage
Because grafana users will write files in this directory and directly set 777, which is relatively simple and rough!
Start grafana
docker run -d --name grafana \
  -p 3000:3000 \
  --name=grafana \
  -v /Users/software/docker/grafana-storage:/var/lib/grafana \
  grafana/grafana
Wait a few seconds to view the port status:
root@ubuntu:/opt/prometheus# netstat -anpt
Active Internet connections (servers and established)
Proto Recv-Q Send-Q Local Address           Foreign Address         State       PID/Program name
tcp        0      0 0.0.0.0:22              0.0.0.0:*               LISTEN      1147/sshd
tcp        0     36 192.168.91.132:22       192.168.91.1:63648      ESTABLISHED 2969/0
tcp        0      0 192.168.91.132:22       192.168.91.1:63340      ESTABLISHED 1321/1
tcp6       0      0 :::9100                 :::*                    LISTEN      3070/node_exporter
tcp6       0      0 :::22                   :::*                    LISTEN      1147/sshd
tcp6       0      0 :::3000                 :::*                    LISTEN      3494/docker-proxy
tcp6       0      0 :::9090                 :::*                    LISTEN      3336/docker-proxy
tcp6       0      0 192.168.91.132:9100     172.17.0.2:55108        ESTABLISHED 3070/node_exporter
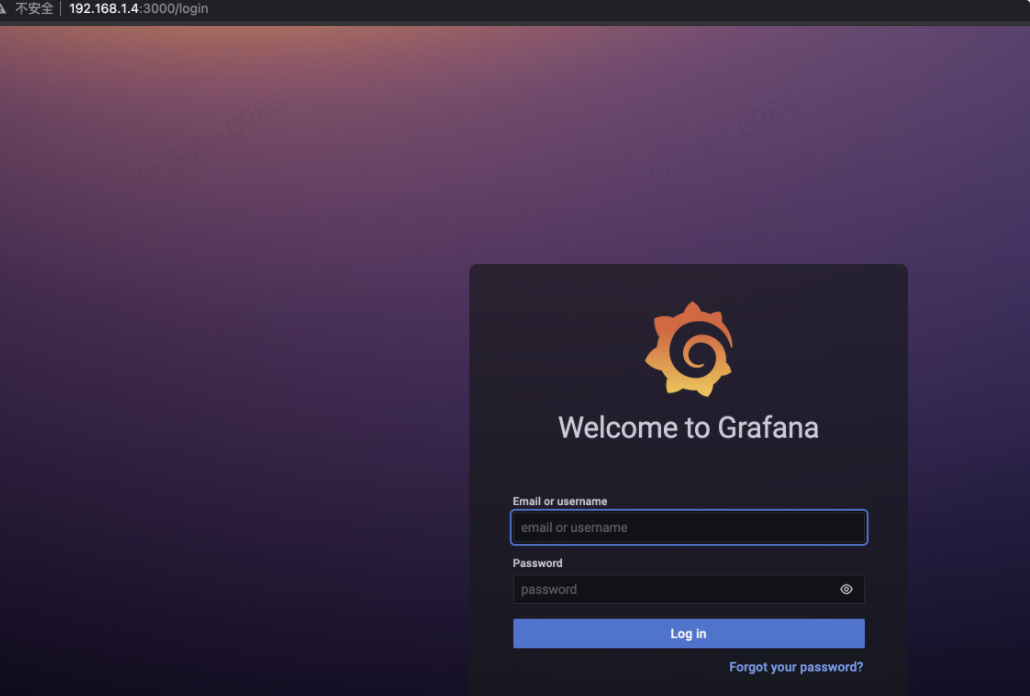
Access url:
http://192.168.1.4:3000/
By default, you will jump to the login page first. The default user name and password are admin
After logging in, it will ask you to reset your password. You can also enter the admin password again!
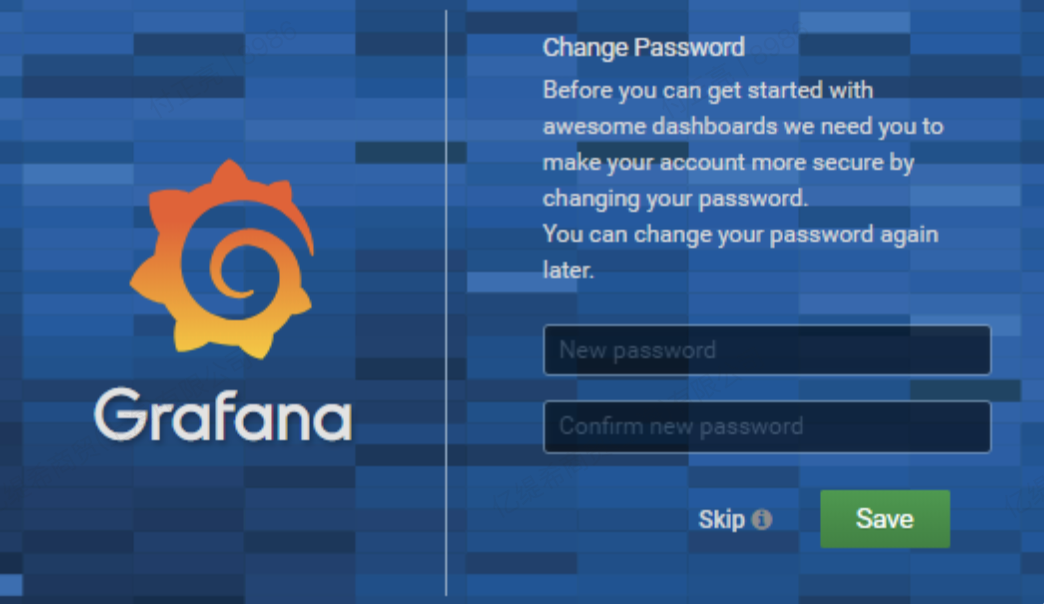
After setting the password, you will jump to the home page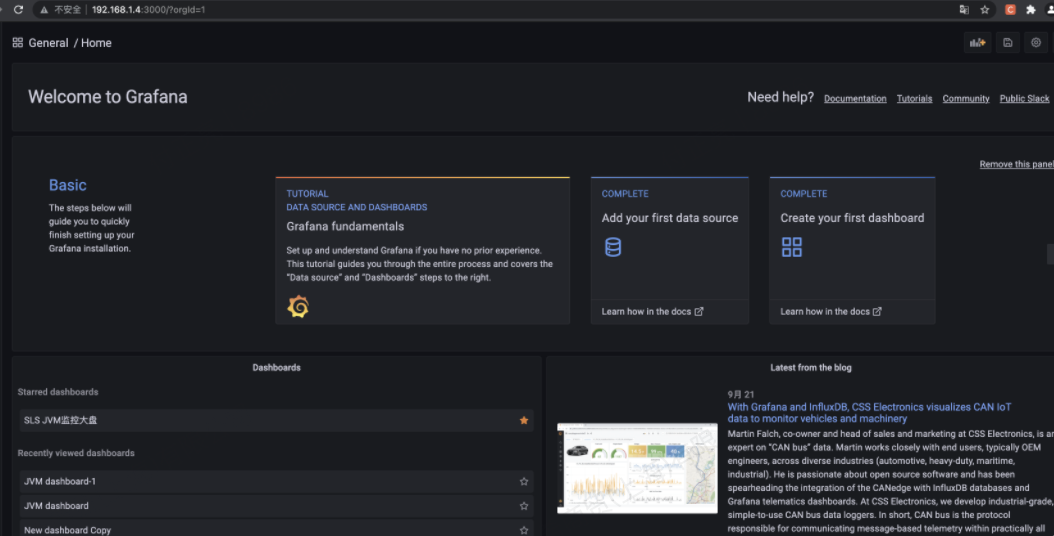
Click Add data source. Because the image mode is used, the version is relatively new. It is different from the pictures displayed in the articles on the Internet!
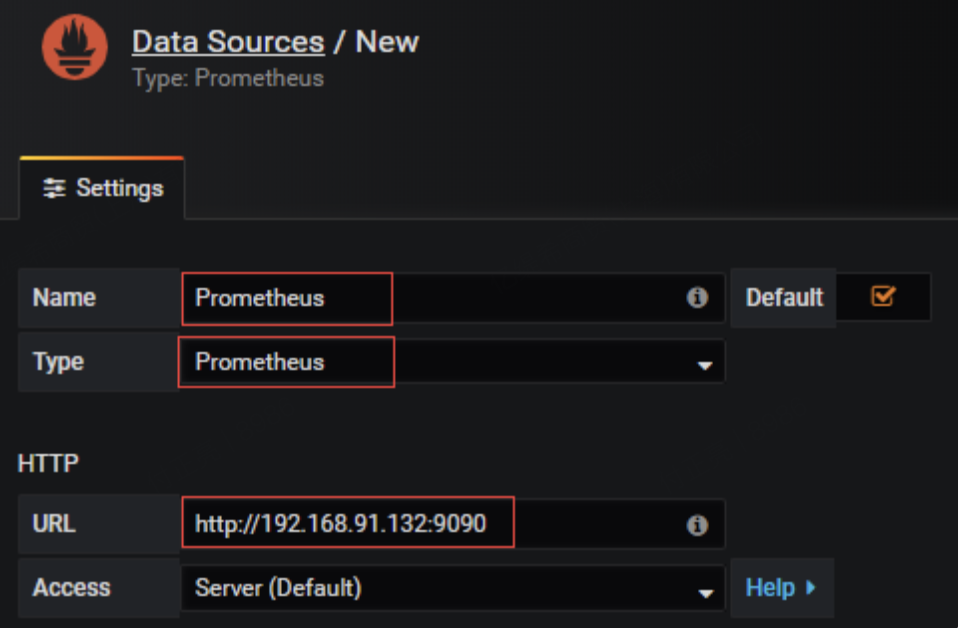 name write Prometheus
type selects Prometheus because the data is obtained from it
url enter the ip + port of Prometheus
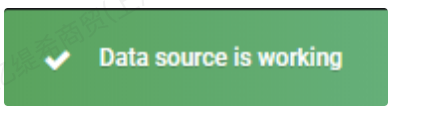
Click Save & test below. If green appears, it means ok
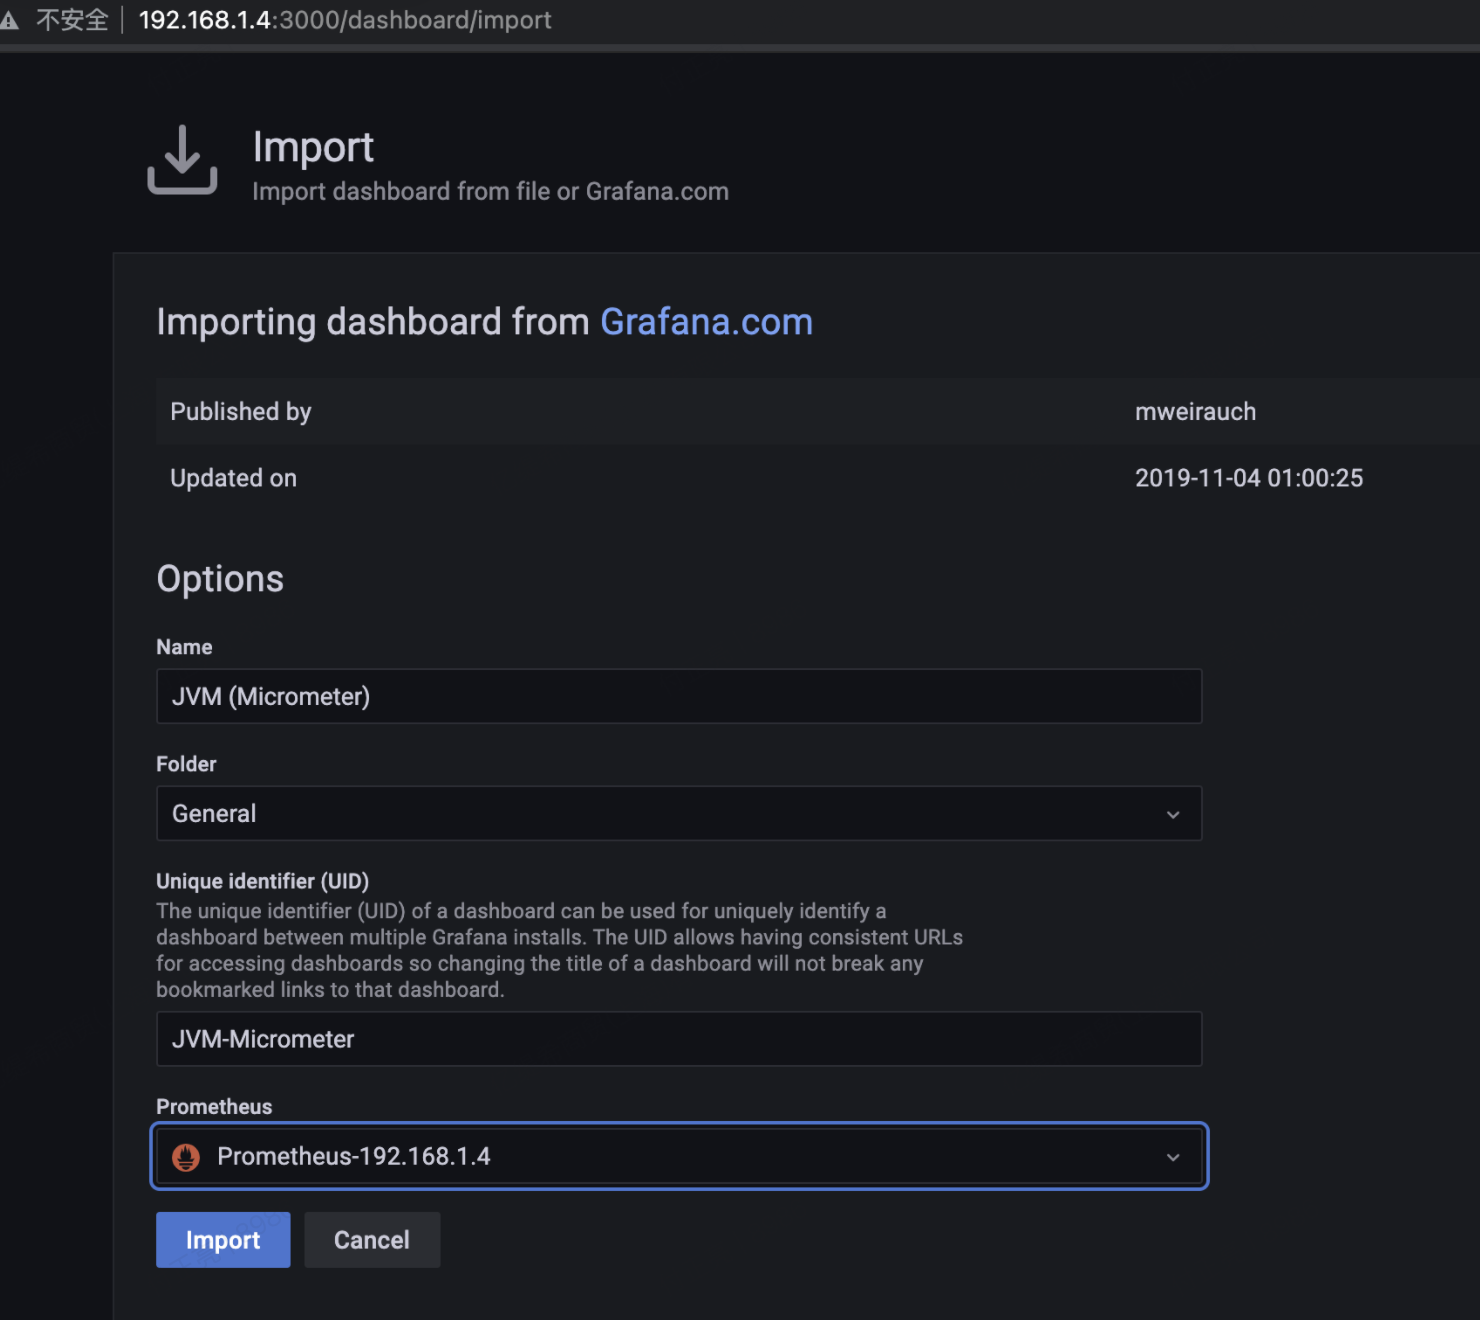
Import select template for import:
4. Configure and start alertmanager
docker run -d --name alertmanager -p 9093:9093 -v /Users/software/docker/alertmanager.yml:/etc/alertmanager/alertmanager.yml prom/alertmanager

docker run -d --name alertmanager -p 9093:9093 -v /Users/software/docker/alertmanager.yml:/etc/alertmanager/alertmanager.yml prom/alertmanager
5. Configure startup dingtalk
docker run --name webhook -p 8060:8060 -v /Users/software/docker/dingtalk/config.yml:/etc/prometheus-webhook-dingtalk/config.xml timonwong/prometheus-webhook-dingtalk
--ding.profile="webhook=https://oapi.dingtalk.com/robot/send?access_token=token"
1,Jmx_exporter + Prometheus +Grafana
1.1 download Jmx_exporter rack bag
https://github.com/prometheus/jmx_exporter
1.2 configuring JMX_ config.yaml of exporter:
---
lowercaseOutputLabelNames: true
lowercaseOutputName: true
whitelistObjectNames: ["java.lang:type=OperatingSystem"]
blacklistObjectNames: []
rules:
  - pattern: 'java.lang<type=OperatingSystem><>(committed_virtual_memory|free_physical_memory|free_swap_space|total_physical_memory|total_swap_space)_size:'
    name: os_$1_bytes
    type: GAUGE
    attrNameSnakeCase: true
  - pattern: 'java.lang<type=OperatingSystem><>((?!process_cpu_time)\w+):'
    name: os_$1
    type: GAUGE
    attrNameSnakeCase: true
1.3 start application configuration agent
java -javaagent:./jmx_prometheus_javaagent-0.12.0.jar=8698:config.yaml -jar yourJar.jar
1.4 configure Promethus config:
scrape_configs:
  # The job name is added as a label `job=<job_name>` to any timeseries scraped from this config.
  - job_name: 'prometheus'

    # metrics_path defaults to '/metrics'
    # scheme defaults to 'http'.

    static_configs:
    - targets: ['localhost:9090']
  - job_name: 'monitor-demo'

    # metrics_path defaults to '/metrics'
    # scheme defaults to 'http'.

    static_configs:
    - targets: ['localhost:8698']
1.5 create Promethus data source in Grafana before importing
1.6 the template used by grafana is 8563, which can be imported directly
https://grafana.com/grafana/dashboards/8563
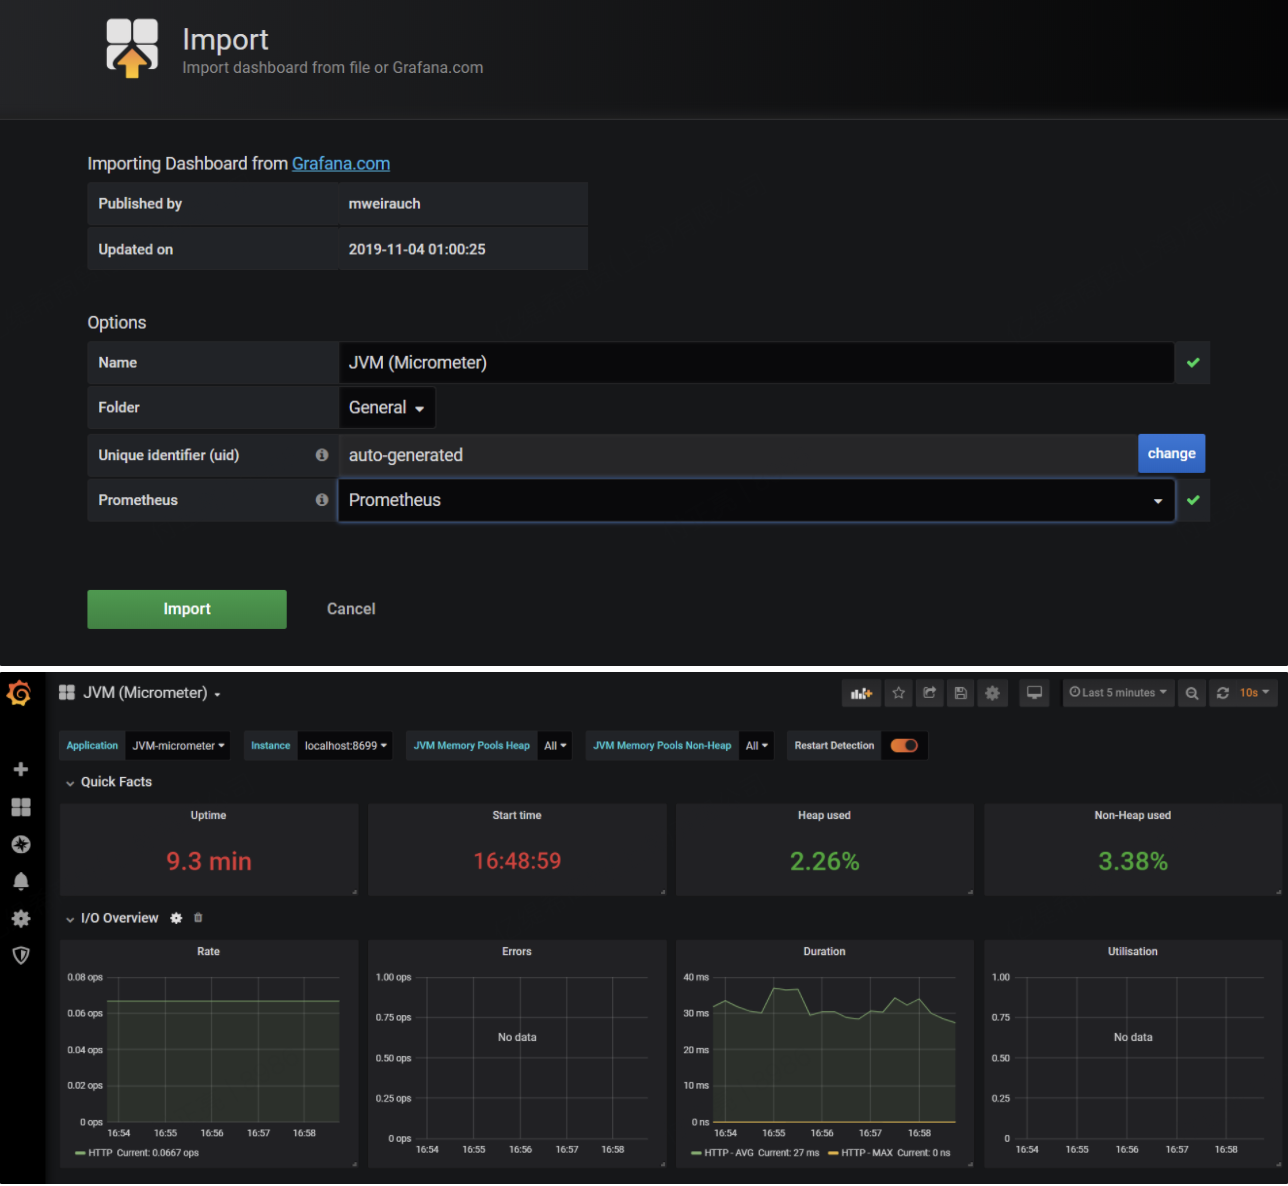
2,Micrometer + Prometheus +Grafana
Using the Grafana template is 4701
https://grafana.com/grafana/dashboards/4701
2.1 dependencies required by maven
<dependency>
  <groupId>org.springframework.boot</groupId>
  <artifactId>spring-boot-starter-actuator</artifactId>
</dependency>

<dependency>
  <groupId>io.micrometer</groupId>
  <artifactId>micrometer-registry-prometheus</artifactId>
  <version>1.2.2</version>
</dependency>

<dependency>
  <groupId>io.github.mweirauch</groupId>
  <artifactId>micrometer-jvm-extras</artifactId>
  <version>0.2.0</version>
</dependency>
2.2 application.properties configuration
(note that management.endpoints.web.base-path is not configured here, so the default request path is / actor, and the path of Promethus is / Actor / Prometheus)
server.port=8699
#spring.application.name=JVM-micrometer
management.metrics.tags.application=JVM-micrometer
#prometheus configuration
management.metrics.export.prometheus.enabled=true
management.metrics.export.prometheus.step=1ms
management.metrics.export.prometheus.descriptions=true

management.endpoint.prometheus.enabled=true
management.endpoints.web.exposure.include=health,info,env,prometheus,metrics,httptrace,threaddump,heapdump,springmetrics
2.3 configure Prometheus config:
- job_name: 'actuator-demo'
    # metrics_path defaults to '/metrics'
    # scheme defaults to 'http'.
    metrics_path: '/actuator/prometheus'
    static_configs:
    - targets: ['localhost:8699']
2.4 just import 4701 on Grafana
3. Interface call monitoring
Service link tracking:
Zipkin or SkyWalking
4,Apache SkyWalking
Official website documents: https://skywalking.apache.org/docs/main/latest/readme/
Portal: Build skywalking 8.6.0-es7 link tracking and JVM monitoring platform based on docker to nail alarm
reference resources:
prometheus official website
SkyWalking official website
Reference 1
Reference 2
Reference 3
-------------You are welcome to leave a message. If there is anything wrong, please correct it. [Q:981233589]