1. Requirement description:
cadvisor+influxdb+grafana is used for container monitoring and data display, and tcpstats related data are collected.
Turn off the default disable-metric at startup. The startup parameters are as follows:
[program:cadvisor]
command=/root/go/src/cadvisor/cadvisor -port=18080 -logtostderr=true -v=5 -enable_load_reader=true -storage_duration=15s -disable_metrics="" -docker_only=true -storage_driver=influxdb -storage_driver_db=influxdb -storage_driver_user=influxdb -storage_driver_password=influxdb -storage_driver_host="127.0.0.1:18086"
numprocs=1
autostart=true
autorestart=true
startsecs=3
startretries=5
stopasgroup=true
killasgroup=true
stdout_logfile=/var/log/supervisor/cadvisor_out.log
stderr_logfile=/var/log/supervisor/cadvisor_err.log
2. Problem Location
523823198@qq.com
After startup, it is found that there is no tcpstat related value in the data written to influxdb. so view the source code as follows:
cat storage/influxdb/influxdb.go
...
 50 // Series names
 51 const (
 52     // Cumulative CPU usage
 53     serCpuUsageTotal  string = "cpu_usage_total"
 54     serCpuUsageSystem string = "cpu_usage_system"
 55     serCpuUsageUser   string = "cpu_usage_user"
 56     serCpuUsagePerCpu string = "cpu_usage_per_cpu"
 57     // Smoothed average of number of runnable threads x 1000.
 58     serLoadAverage string = "load_average"
 59     // Memory Usage
 60     serMemoryUsage string = "memory_usage"
 61     // Working set size
 62     serMemoryWorkingSet string = "memory_working_set"
 63     // Cumulative count of bytes received.
 64     serRxBytes string = "rx_bytes"
 65     // Cumulative count of receive errors encountered.
 66     serRxErrors string = "rx_errors"
 67     // Cumulative count of bytes transmitted.
 68     serTxBytes string = "tx_bytes"
 69     // Cumulative count of transmit errors encountered.
 70     serTxErrors string = "tx_errors"
 71     // Filesystem device.
 72     serFsDevice string = "fs_device"
 73     // Filesystem limit.
 74     serFsLimit string = "fs_limit"
 75     // Filesystem usage.
 76     serFsUsage string = "fs_usage"
 77 )
...
...
180 func (self *influxdbStorage) containerStatsToPoints(
181     cInfo *info.ContainerInfo,
182     stats *info.ContainerStats,
183 ) (points []*influxdb.Point) {
184     // CPU usage: Total usage in nanoseconds
185     points = append(points, makePoint(serCpuUsageTotal, stats.Cpu.Usage.Total))
186
187     // CPU usage: Time spend in system space (in nanoseconds)
188     points = append(points, makePoint(serCpuUsageSystem, stats.Cpu.Usage.System))
189
190     // CPU usage: Time spent in user space (in nanoseconds)
191     points = append(points, makePoint(serCpuUsageUser, stats.Cpu.Usage.User))
192
193     // CPU usage per CPU
194     for i := 0; i < len(stats.Cpu.Usage.PerCpu); i++ {
195         point := makePoint(serCpuUsagePerCpu, stats.Cpu.Usage.PerCpu[i])
196         tags := map[string]string{"instance": fmt.Sprintf("%v", i)}
197         addTagsToPoint(point, tags)
198
199         points = append(points, point)
200     }
201
202     // Load Average
203     points = append(points, makePoint(serLoadAverage, stats.Cpu.LoadAverage))
204
205     // Memory Usage
206     points = append(points, makePoint(serMemoryUsage, stats.Memory.Usage))
207
208     // Working Set Size
209     points = append(points, makePoint(serMemoryWorkingSet, stats.Memory.WorkingSet))
210
211     // Network Stats
212     points = append(points, makePoint(serRxBytes, stats.Network.RxBytes))
213     points = append(points, makePoint(serRxErrors, stats.Network.RxErrors))
214     points = append(points, makePoint(serTxBytes, stats.Network.TxBytes))
215     points = append(points, makePoint(serTxErrors, stats.Network.TxErrors))
216     self.tagPoints(cInfo, stats, points)
217
218     return points
219 }
...
The metric s of tcpstats are not collected in the source code into influxdb, so they need to be added manually.
3. Problem solving
Modify the original code and add the data you need to points.
vim storage/influxdb/influxdb.go
...
 50 // Series names
 51 const (
 52     // Cumulative CPU usage
 53     serCpuUsageTotal  string = "cpu_usage_total"
 54     serCpuUsageSystem string = "cpu_usage_system"
 55     serCpuUsageUser   string = "cpu_usage_user"
 56     serCpuUsagePerCpu string = "cpu_usage_per_cpu"
 57     // Smoothed average of number of runnable threads x 1000.
 58     serLoadAverage string = "load_average"
 59     // Memory Usage
 60     serMemoryUsage string = "memory_usage"
 61     // Working set size
 62     serMemoryWorkingSet string = "memory_working_set"
 63     // Cumulative count of bytes received.
 64     serRxBytes string = "rx_bytes"
 65     // Cumulative count of receive errors encountered.
 66     serRxErrors string = "rx_errors"
 67     // Cumulative count of bytes transmitted.
 68     serTxBytes string = "tx_bytes"
 69     // Cumulative count of transmit errors encountered.
 70     serTxErrors string = "tx_errors"
 71     // Filesystem device.
 72     serFsDevice string = "fs_device"
 73     // Filesystem limit.
 74     serFsLimit string = "fs_limit"
 75     // Filesystem usage.
 76     serFsUsage string = "fs_usage"
 77     // Tcp Establisd count.
 78     serEsTabs string = "tcp_estab"
 79     // Tcp TimeWait count.
 80     serTimeWait string = "tcp_timewait"
 81     // Tcp CloseWait count.
 82     serCloseWait string = "tcp_closewait"
 83 )
...
...
180 func (self *influxdbStorage) containerStatsToPoints(
181     cInfo *info.ContainerInfo,
182     stats *info.ContainerStats,
183 ) (points []*influxdb.Point) {
184     // CPU usage: Total usage in nanoseconds
185     points = append(points, makePoint(serCpuUsageTotal, stats.Cpu.Usage.Total))
186
187     // CPU usage: Time spend in system space (in nanoseconds)
188     points = append(points, makePoint(serCpuUsageSystem, stats.Cpu.Usage.System))
189
190     // CPU usage: Time spent in user space (in nanoseconds)
191     points = append(points, makePoint(serCpuUsageUser, stats.Cpu.Usage.User))
192
193     // CPU usage per CPU
194     for i := 0; i < len(stats.Cpu.Usage.PerCpu); i++ {
195         point := makePoint(serCpuUsagePerCpu, stats.Cpu.Usage.PerCpu[i])
196         tags := map[string]string{"instance": fmt.Sprintf("%v", i)}
197         addTagsToPoint(point, tags)
198
199         points = append(points, point)
200     }
201
202     // Load Average
203     points = append(points, makePoint(serLoadAverage, stats.Cpu.LoadAverage))
204
205     // Memory Usage
206     points = append(points, makePoint(serMemoryUsage, stats.Memory.Usage))
207
208     // Working Set Size
209     points = append(points, makePoint(serMemoryWorkingSet, stats.Memory.WorkingSet))
210
211     // Network Stats
212     points = append(points, makePoint(serRxBytes, stats.Network.RxBytes))
213     points = append(points, makePoint(serRxErrors, stats.Network.RxErrors))
214     points = append(points, makePoint(serTxBytes, stats.Network.TxBytes))
215     points = append(points, makePoint(serTxErrors, stats.Network.TxErrors))
216     points = append(points, makePoint(serEsTabs, stats.Network.Tcp.Established))
217     points = append(points, makePoint(serTimeWait, stats.Network.Tcp.TimeWait))
218     points = append(points, makePoint(serCloseWait, stats.Network.Tcp.CloseWait))
219
220     self.tagPoints(cInfo, stats, points)
221
222     return points
223 }
...
4. Data validation:
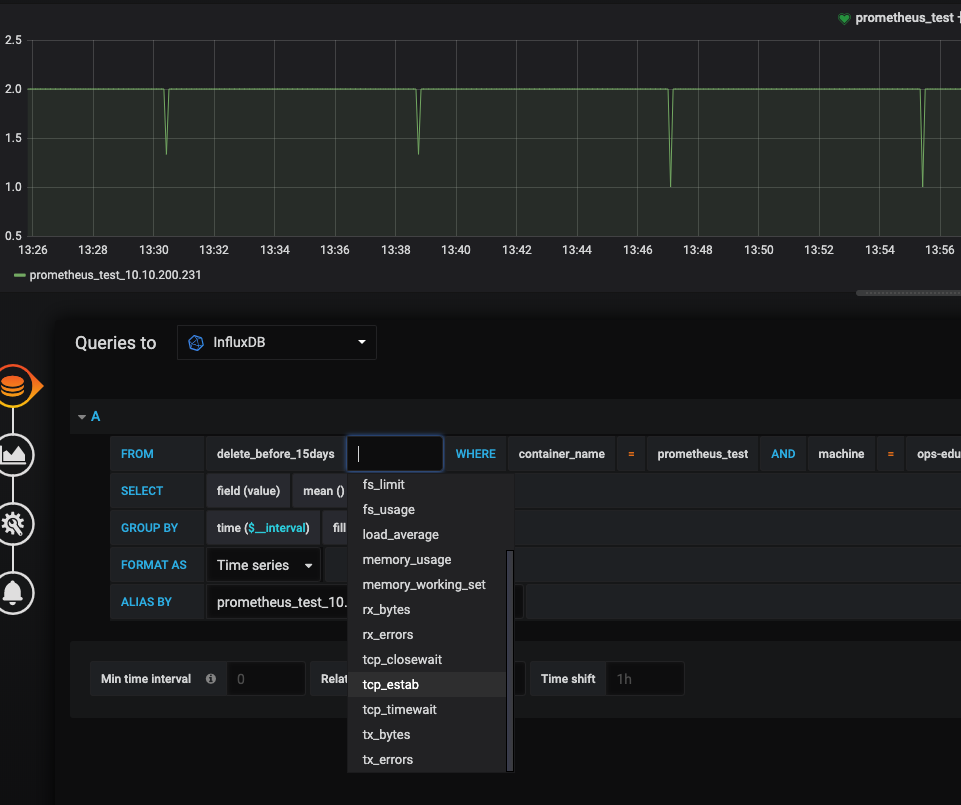
The relevant code has been modified and submitted to my personal warehouse. It can be pulled directly to make build or downloaded directly to execute the binary file cadvisor_with_tcp.
Code Warehouse: https://github.com/mmjl/cadvisor.git
So far, the problem that cadvisor+influxdb cannot collect tcpEstab quantities has been solved.