Background description:
Because Cao Cao has recently been leading the development of a new project, codenamed Cao Cao, many related development technology blogs may be updated in the future, witnessing the Cao Cao project from 0 to online to the final product, and also witnessing his development dog from java background to front stack to the final full war.
Cao Cao Project:
Front end: angular JS
Background: java
1. Demand Description
Recently, there is a feature that draws the interaction between a component's server and the upstream and downstream servers, draws a sequence diagram of the interaction, and notes the interaction information, time, and so on, similar to the Graph Analysis function of wireshark: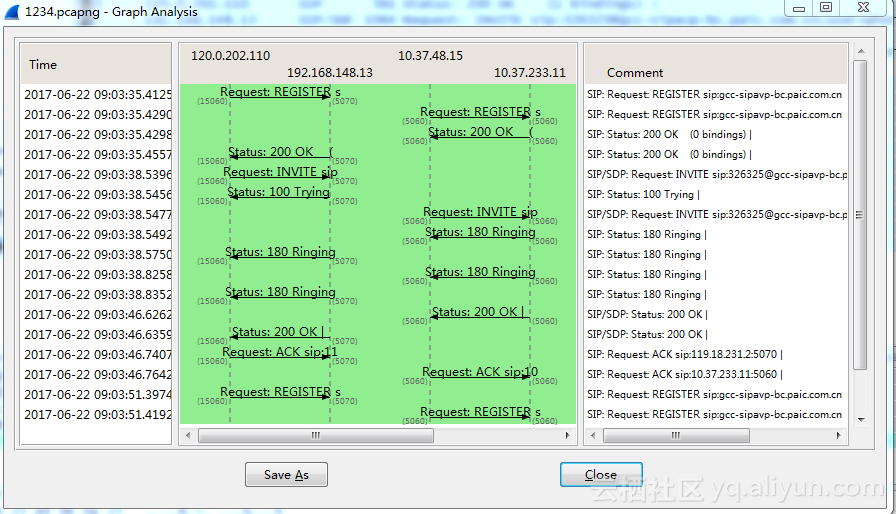
2. Demand Resolution
After searching for JS that have not been drawn for a long time on the internet, echart of Baidu and G2 of ants have been turned over. They are really powerful, but there is no way to achieve time series diagram. Even in the meantime, echart's diagram has been changed to try to make a two-dimensional time series diagram. Unfortunately, the effect is poor.Until you meet js-sequence-diagrams, isn't that the perfect solution?My God, make a pair!
Here's an official example:
Official address: https://bramp.github.io/js-sequence-diagrams/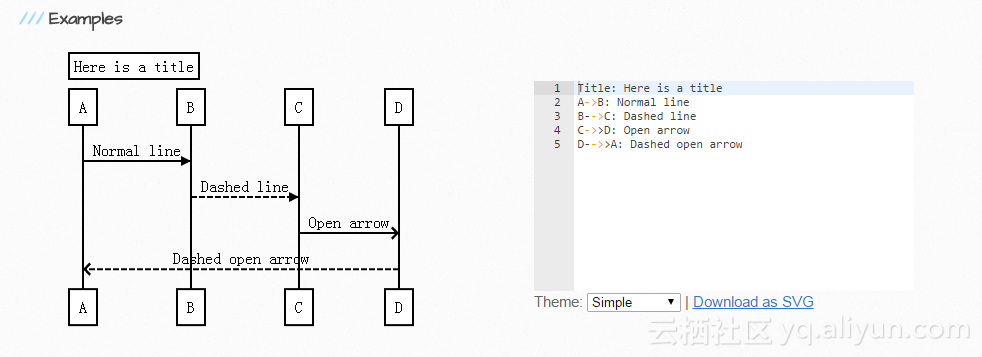
The left side is the effect map and the right side is the text control.
3. Implementation Method
3.1. The following js reference methods are given in the official document:
First refer to the relevant js in the page:
<script src="webfont.js"></script>
<script src="snap.svg-min.js"></script>
<script src="underscore-min.js"></script>
<script src="sequence-diagram-min.js"></script>
Manually add parsed text in the html document:
<div id="diagram"></div>
<script>
  var diagram = Diagram.parse("A->B: Message");
  diagram.drawSVG("diagram", {theme: 'hand'});
</script>
Or use a jQuery reference:
<div class="diagram">A->B: Message</div>
<script>
$(".diagram").sequenceDiagram({theme: 'hand'});
</script>
3.2. Combining Needs
This requirement is to find a lot of interactive information from the database, each line drawing requires a list of data, the background will return all data in json format after querying the database, the result of the json data is a large array, and there are many maps in array, where each map has the same key, different value s, and all maps are sorted by time.
When the front end gets the data, each map data is sequentially stitched into js-sequence-diagrams text in angular controller js to draw a corresponding line, resulting in a complete time series diagram.The code is as follows:
js reference method:
sipTraceService.getSipTraceList($scope.sipTrace.connid).then(function(data){
       if( null != data && data != undefined && data.result.length != 0){

           var result = data.result;
           var htmlTexts = '';
           //Iterate over data
           result.forEach(function(ele,index){
               //Formatting time
               formatTime = $filter('date')( ele.time,'yyyy-MM-dd HH:mm:ss:sss');
               var htmlText = '';
               var inbound = ele.inbound;
               var ip = ele.ip;
               newIp = ip.split(':')[0];
               //Judge arrow direction based on inbound value
               if(inbound == 0){
                  htmlText   = newIp+'->'+ele.hostip+':'+'\\n'+'cseq: '+ele.cseq+'\\n'+'Request: '+ele.name+'\\n'+'Time:'+formatTime;
               }else if(inbound == 1){
                   htmlText   = ele.hostip+'->'+newIp+':'+'\\n'+'cseq: '+ele.cseq+'\\n'+'Status: '+ele.name+'\\n'+'Time:'+formatTime;
               }
               htmlTexts+=htmlText+'\n';
           })
       //Drawing
           var diagram = Diagram.parse(htmlTexts);
           diagram.drawSVG("diagram", {theme: 'simple'});
       }else {
           alert('connid Non-existent!');
       }

       });
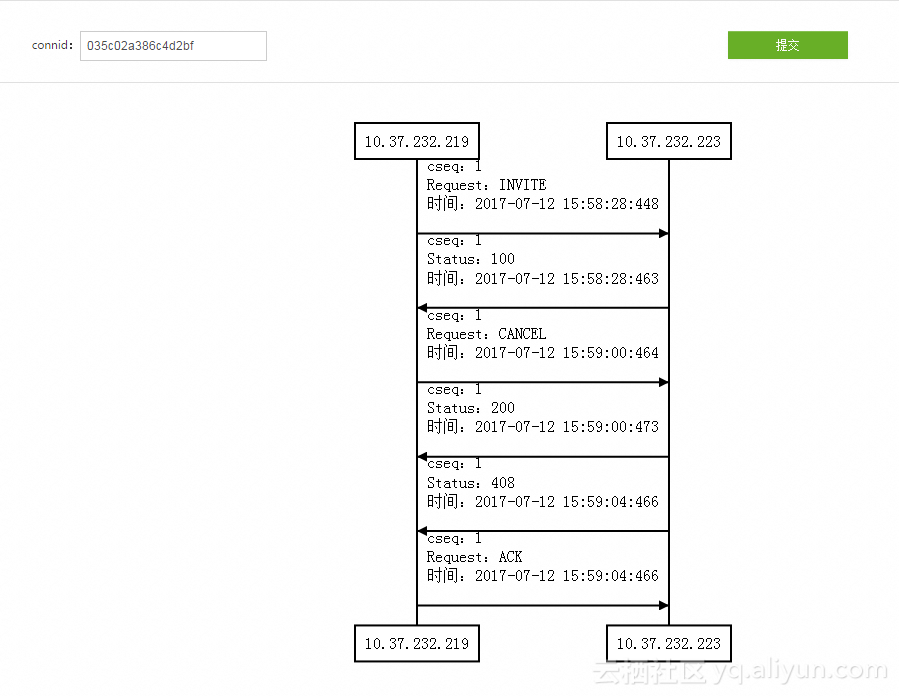
Reference the JS file on html, then process the background data by using the JS method in the controller, output the text in the js-sequence-diagrams format, and finish the drawing with its method.
4. Effect display