After the data warehouse is built, users can write Hive SQL statements to access them and analyze the data.
In actual production, which statistical indicators are needed are usually proposed by the relevant departments of data demand, and new statistical requirements will continue to emerge. The following are some typical indicators in website traffic analysis.
Note: Each statistical index can be drilled with the dimension table.
1. Traffic analysis 1.1. Multidimensional statistics PV total amount by time dimension
- Compute hourly pvs, pay attention to gruop by grammar
select count(*) as pvs,month,day,hour from ods_weblog_detail group by month,day,hour;
Way 1: Query directly on the ods_weblog_detail form
--Calculate the hours in the batch (day) pvs

drop table dw_pvs_everyhour_oneday;

create table dw_pvs_everyhour_oneday(month string,day string,hour string,pvs bigint) partitioned by(datestr string);

insert into table dw_pvs_everyhour_oneday partition(datestr='20130918')

select a.month as month,a.day as day,a.hour as hour,count(*) as pvs from ods_weblog_detail a

where  a.datestr='20130918' group by a.month,a.day,a.hour;

--Calculate daily pvs

drop table dw_pvs_everyday;

create table dw_pvs_everyday(pvs bigint,month string,day string);

insert into table dw_pvs_everyday

select count(*) as pvs,a.month as month,a.day as day from ods_weblog_detail a

group by a.month,a.day;
Mode 2: Association query with time dimension table
--Dimension: Day

drop table dw_pvs_everyday;

create table dw_pvs_everyday(pvs bigint,month string,day string);

insert into table dw_pvs_everyday

select count(*) as pvs,a.month as month,a.day as day from (select distinct month, day from t_dim_time) a

join ods_weblog_detail b

on a.month=b.month and a.day=b.day

group by a.month,a.day;

--Dimension: Month

drop table dw_pvs_everymonth;

create table dw_pvs_everymonth (pvs bigint,month string);

insert into table dw_pvs_everymonth

select count(*) as pvs,a.month from (select distinct month from t_dim_time)  a

join ods_weblog_detail b on a.month=b.month group by a.month;

--In addition, the previous calculation results can also be used directly. For example, count every day from the previous hourly results

Insert into table dw_pvs_everyday

Select sum(pvs) as pvs,month,day from dw_pvs_everyhour_oneday group by month,day having day='18';
 —
By terminal dimension
The field in the data that can reflect user terminal information is http_user_agent.
User Agent is also referred to as UA. It is a special string header. It is an identification that provides information about the type and version of browser, operating system and version, browser kernel, etc. used to visit a website. For example:
User-Agent,Mozilla/5.0 (Windows NT 6.3; WOW64) AppleWebKit/537.36 (KHTML, like Gecko) Chrome/58.0.3029.276 Safari/537.36
The above UA information can extract the following information:
chrome 58.0, browser chrome, browser version 58.0, system platform windows
Browser Kernel webkit
Instead of expanding your knowledge here, you can see how UA is parsed in Resources.
The following statements can be used for tentative statistics, of course, such accuracy is not very high.
select distinct(http_user_agent) from ods_weblog_detail where http_user_agent like '%Chrome%' limit 200;
By Column Dimension
Website columns can be understood as a collection of topics related to the content of the website. In terms of domain names, different columns will have different secondary directories. For example, a website's website is www.xxxx.cn, and its columns can be accessed as follows:
Column dimension:. / job
Column dimension:. / news
Column dimension:. / sports
Column dimension:. / technology
Then the access column can be parsed according to the user request url, and then statistical analysis can be carried out according to the column.
By referer dimension
--------
--Hourly visits url Produced pv amount

drop table dw_pvs_referer_everyhour;

create table dw_pvs_referer_everyhour(referer_url string,referer_host string,month string,day string,hour string,pv_referer_cnt bigint) partitioned by(datestr string);

insert into table dw_pvs_referer_everyhour partition(datestr='20130918')

select http_referer,ref_host,month,day,hour,count(1) as pv_referer_cnt

from ods_weblog_detail

group by http_referer,ref_host,month,day,hour

having ref_host is not null

order by hour asc,day asc,month asc,pv_referer_cnt desc;
 --------
--Hourly visits host Generative pv Number and Sort

drop table dw_pvs_refererhost_everyhour;

create table dw_pvs_refererhost_everyhour(ref_host string,month string,day string,hour string,ref_host_cnts bigint) partitioned by(datestr string);

insert into table dw_pvs_refererhost_everyhour partition(datestr='20130918')

select ref_host,month,day,hour,count(1) as ref_host_cnts

from ods_weblog_detail

group by ref_host,month,day,hour

having ref_host is not null

order by hour asc,day asc,month asc,ref_host_cnts desc;
 --------
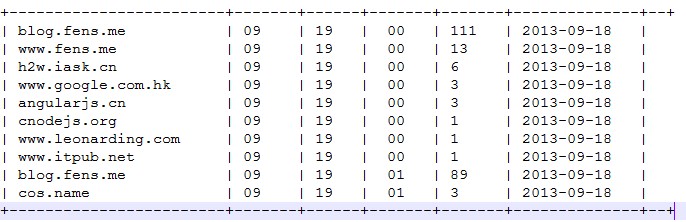
Note: It can also be calculated according to the source area dimension and the visitor terminal dimension.
1.2. Per capita browsing
Requirement Description: Statistics the average number of pages requested by all visitors today.
Per capita browsing volume is also called per capita page number, which can explain the stickiness of the website to users.
Per capita page views indicate the average number of times a user visits a page at a given time.
Calculating method: total page requests / total number of duplicated pages
Remote_addr represents different users. We can first count the pv of different remote_addr, then sum all pv as the total number of page requests, and count all remote_addr as the total number of weightless.
--Total number of page requests/Total weight loss

drop table dw_avgpv_user_everyday;

create table dw_avgpv_user_everyday(

day string,

avgpv string);

insert into table dw_avgpv_user_everyday

select '20130918',sum(b.pvs)/count(b.remote_addr) from

(select remote_addr,count(1) as pvs from ods_weblog_detail where datestr='20130918' group by remote_addr) b;
1.3. TOPN (grouped TOP) is the largest source of total pv.
Requirement Description: The top N (topN) with the largest number of pvs generated by visiting host s per hour is counted.
row_number() function
Ba grammar: row_number() over (partition by XXX order by xxxx) rank, rank is the alias of the group, equivalent to adding a field named rank.
partition by is used for grouping, for example, according to the sex field
order by is used for sorting within groups, for example, by sex and by age within groups.
After sorting, a number is returned for each grouping record in each grouping from the beginning.
If you click a data in a group, you can use a grammar like where table name. rank > x to fetch it.
The following statement ranks the number of visits per hour in reverse order:
select ref_host,ref_host_cnts,concat(month,day,hour),
row_number() over (partition by concat(month,day,hour) order by ref_host_cnts desc) as od from dw_pvs_refererhost_everyhour;
The results are as follows: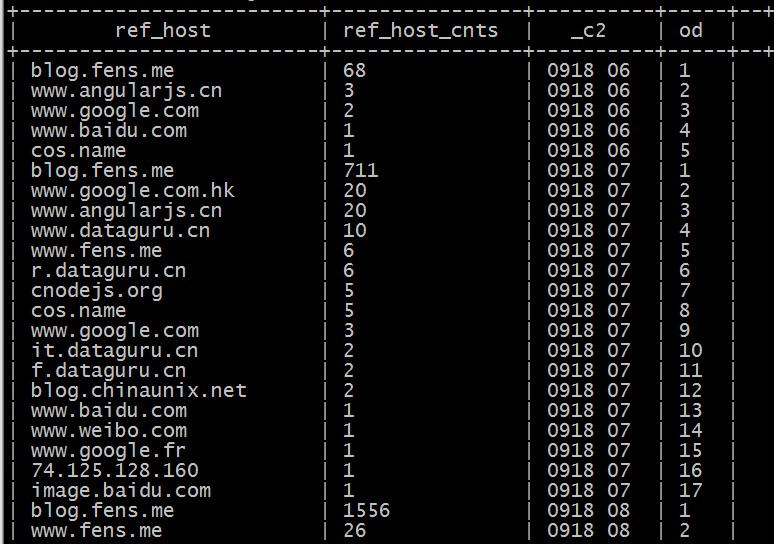
According to the function of row_number mentioned above, we can write hql to get the number of ref_host visits per hour topn.
drop table dw_pvs_refhost_topn_everyhour;

create table dw_pvs_refhost_topn_everyhour(

hour string,

toporder string,

ref_host string,

ref_host_cnts string

)partitioned by(datestr string);

insert into table dw_pvs_refhost_topn_everyhour partition(datestr='20130918')

select t.hour,t.od,t.ref_host,t.ref_host_cnts from

(select ref_host,ref_host_cnts,concat(month,day,hour) as hour,

row_number() over (partition by concat(month,day,hour) order by ref_host_cnts desc) as od

from dw_pvs_refererhost_everyhour) t where od<=3;
The results are as follows: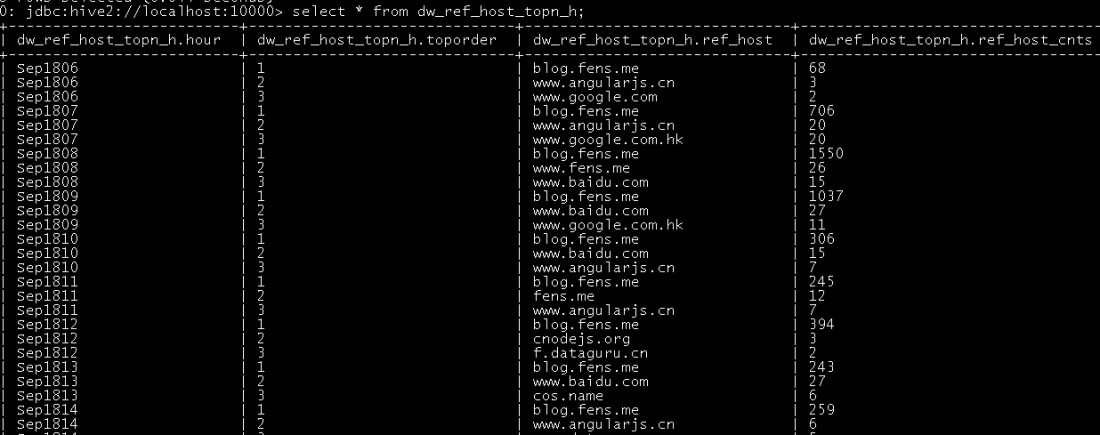
2. Interview analysis (from page perspective) 2.1. Visit statistics of each page
Mainly for data request s for statistical analysis, such as each page PV, each page UV and so on.
All of the above indicators are based on the field group by the page. For example:
--Statistical pages pv

select request as request,count(request) as request_counts from

ods_weblog_detail group by request having request is not null order by request_counts desc limit 20;
 --------
2.2. Hot Page Statistics
--Statistics of the hottest pages of the day top10

drop table dw_hotpages_everyday;

create table dw_hotpages_everyday(day string,url string,pvs string);

insert into table dw_hotpages_everyday

select '20130918',a.request,a.request_counts from

(select request as request,count(request) as request_counts from ods_weblog_detail where datestr='20130918' group by request having request is not null) a

order by a.request_counts desc limit 10;
 --------
3. Visitor Analysis 3.1. Independent Visitors
Requirement Description: Independent visitors and their generated pv are counted in terms of time dimension, such as hours.
For the identification of independent visitors, if there is a user ID in the original log, it is very good to implement according to the user ID; here, because there is no user ID in the original log, the simulation with the visitor IP is the same technically, but the accuracy is relatively low.
--Time Dimension: Time

drop table dw_user_dstc_ip_h;

create table dw_user_dstc_ip_h(

remote_addr string,

pvs      bigint,

hour     string);

insert into table dw_user_dstc_ip_h

select remote_addr,count(1) as pvs,concat(month,day,hour) as hour

from ods_weblog_detail

Where datestr='20130918'

group by concat(month,day,hour),remote_addr;

//Based on the results table, further statistics can be made, such as the total number of independent visitors per hour:

select count(1) as dstc_ip_cnts,hour from dw_user_dstc_ip_h group by hour;
--Time Dimension: Day

select remote_addr,count(1) as counts,concat(month,day) as day

from ods_weblog_detail

Where datestr='20130918'

group by concat(month,day),remote_addr;
--Time Dimension: Month

select remote_addr,count(1) as counts,month

from ods_weblog_detail

group by month,remote_addr;
3.2. Daily New Visitors
Demand: Statistics new visitors every day.
Realization idea: Create a cumulative table to re-visit visitors, and then compare the cumulative table with the daily visitors.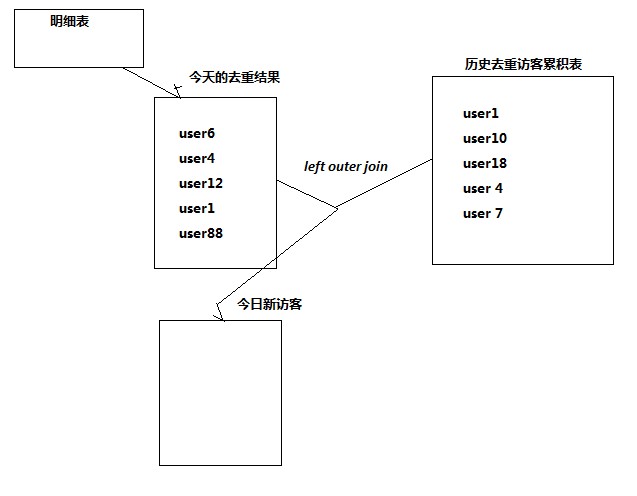
--Calendar Visitor Accumulation Form

drop table dw_user_dsct_history;

create table dw_user_dsct_history(

day string,

ip string

)

partitioned by(datestr string);

--Daily New Visitor List

drop table dw_user_new_d;

create table dw_user_new_d (

day string,

ip string

)

partitioned by(datestr string);

--Daily New Users Insert New Visitor List

insert into table dw_user_new_d partition(datestr='20130918')

select tmp.day as day,tmp.today_addr as new_ip from

(

select today.day as day,today.remote_addr as today_addr,old.ip as old_addr

from

(select distinct remote_addr as remote_addr,"20130918" as day from ods_weblog_detail where datestr="20130918") today

left outer join

dw_user_dsct_history old

on today.remote_addr=old.ip

) tmp

where tmp.old_addr is null;

--Daily New Users Added to Cumulative Table

insert into table dw_user_dsct_history partition(datestr='20130918')

select day,ip from dw_user_new_d where datestr='20130918';
Verify View:
select count(distinct remote_addr) from ods_weblog_detail;

select count(1) from dw_user_dsct_history where datestr='20130918';

select count(1) from dw_user_new_d where datestr='20130918';
Note: It can also be calculated according to the source area dimension and the visitor terminal dimension.
Visit Visit Analysis (Click Stream Model) 4.1. Back-to-Back/Single Visitor Statistics
Requirement: Query all returning visitors and their visits today.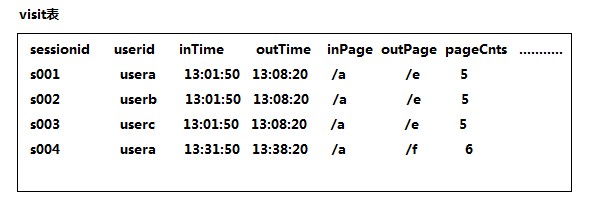
Ideas for realization: Visitors who appear more than 1 times in the table above are returning visitors; on the contrary, they are single visitors.
drop table dw_user_returning;

create table dw_user_returning(

day string,

remote_addr string,

acc_cnt string)

partitioned by (datestr string);

insert overwrite table dw_user_returning partition(datestr='20130918')

select tmp.day,tmp.remote_addr,tmp.acc_cnt

from

(select '20130918' as day,remote_addr,count(session) as acc_cnt from ods_click_stream_visit group by remote_addr) tmp

where tmp.acc_cnt>1;
4.2. Per capita visits
Requirements: Calculate the average number of visit s per day for all users.
Total number of visit s / total number of users to de-duplicate
select sum(pagevisits)/count(distinct remote_addr) from ods_click_stream_visit where datestr='20130918';
5. Critical Path Conversion Rate Analysis (Funnel Model) 5.1. Demand Analysis
Conversion: In a specified business process, the number of completed steps and the percentage relative to the previous step.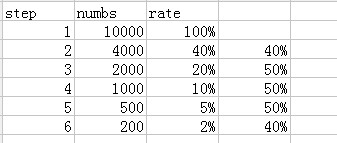
5.2. Model design
Define the page identifier in the business process. The steps in the following example are as follows:
Step1, /item
Step2, /category
Step3, /index
Step4, /order
5.3. Development and Implementation
Query the tota l number of visitors per step
--Query the number of people in each step dw_oute_numbs

create table dw_oute_numbs as

select 'step1' as step,count(distinct remote_addr)  as numbs from ods_click_pageviews where datestr='20130920' and request like '/item%'

union

select 'step2' as step,count(distinct remote_addr)  as numbs from ods_click_pageviews where datestr='20130920' and request like '/category%'

union

select 'step3' as step,count(distinct remote_addr)  as numbs from ods_click_pageviews where datestr='20130920' and request like '/order%'

union

select 'step4' as step,count(distinct remote_addr)  as numbs from ods_click_pageviews where datestr='20130920' and request like '/index%';
Note: UNION sets the results of multiple SELECT statements into a separate result set.
l Query the proportion of the number of people at each step relative to the starting point of the path
Idea: Cascading queries, using self-join
-dw_oute_numbs Follow Yourself join

select rn.step as rnstep,rn.numbs as rnnumbs,rr.step as rrstep,rr.numbs as rrnumbs  from dw_oute_numbs rn

inner join

dw_oute_numbs rr;
--Number of people per step/Number of first steps==Proportion of the number of people at each step relative to the starting point

select tmp.rnstep,tmp.rnnumbs/tmp.rrnumbs as ratio

from

(

select rn.step as rnstep,rn.numbs as rnnumbs,rr.step as rrstep,rr.numbs as rrnumbs  from dw_oute_numbs rn

inner join

dw_oute_numbs rr) tmp

where tmp.rrstep='step1';
l Query the leak rate of each step relative to the previous step
--since join The table filters out the records that follow each step.

select rn.step as rnstep,rn.numbs as rnnumbs,rr.step as rrstep,rr.numbs as rrnumbs  from dw_oute_numbs rn

inner join

dw_oute_numbs rr

where cast(substr(rn.step,5,1) as int)=cast(substr(rr.step,5,1) as int)-1;
 --------
select tmp.rrstep as step,tmp.rrnumbs/tmp.rnnumbs as leakage_rate

from

(

select rn.step as rnstep,rn.numbs as rnnumbs,rr.step as rrstep,rr.numbs as rrnumbs  from dw_oute_numbs rn

inner join

dw_oute_numbs rr) tmp

where cast(substr(tmp.rnstep,5,1) as int)=cast(substr(tmp.rrstep,5,1) as int)-1;
 --------
l Summarize the above two indicators
select abs.step,abs.numbs,abs.rate as abs_ratio,rel.rate as leakage_rate

from

(

select tmp.rnstep as step,tmp.rnnumbs as numbs,tmp.rnnumbs/tmp.rrnumbs as rate

from

(

select rn.step as rnstep,rn.numbs as rnnumbs,rr.step as rrstep,rr.numbs as rrnumbs  from dw_oute_numbs rn

inner join

dw_oute_numbs rr) tmp

where tmp.rrstep='step1'

) abs

left outer join

(

select tmp.rrstep as step,tmp.rrnumbs/tmp.rnnumbs as rate

from

(

select rn.step as rnstep,rn.numbs as rnnumbs,rr.step as rrstep,rr.numbs as rrnumbs  from dw_oute_numbs rn

inner join

dw_oute_numbs rr) tmp

where cast(substr(tmp.rnstep,5,1) as int)=cast(substr(tmp.rrstep,5,1) as int)-1

) rel

on abs.step=rel.step;