thinking
The drawing functions of grid all contain just, but how to adjust the position of the figure with the just parameter is always very puzzling, so I wrote a code to explore it.
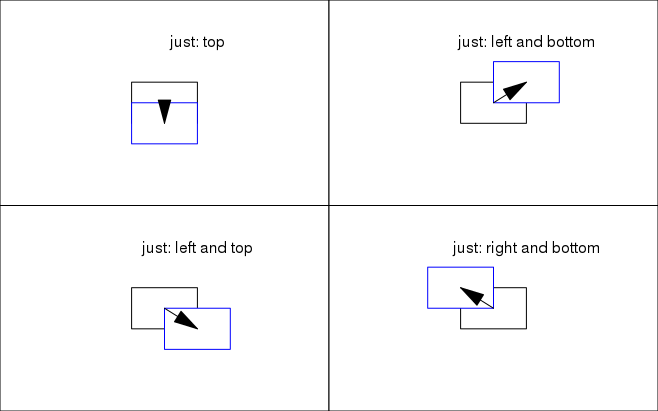
The idea is very simple: put a 2 * 2 layout viewport in each layout, and each viewport uses different just parameters. The rectangle after just is displayed in blue, and the movement of the center point is indicated by an arrow, so that it can be seen at a glance how the corresponding figure of each parameter moves. From the following code, you can also learn how to arrange the layout, how to use grobX and grobY to get the coordinates of grob objects, and how to perform basic viewport switching.
Code
library(grid)

grid.newpage()  # new page
pushViewport(viewport(layout = grid.layout(2,2))) # 2 *2 layout
# just top
pushViewport(viewport(layout.pos.col = 1, layout.pos.row = 1))
grid.rect()
r1 <- rectGrob(0.5, 0.5, width = 0.2, height = 0.2, name = "r1")
r2 <- rectGrob(0.5, 0.5, width = 0.2, height = 0.2, just = c("top"),gp=gpar(col="blue"), name = "r2")
grid.draw(r1)
grid.draw(r2)
grid.segments(0.5,0.5,grobX(r2, 90), grobY(r2, 0), arrow=arrow(angle=15, type="closed"), gp=gpar(fill="black"))
grid.text("just: top" ,0.6, 0.8)
upViewport()
# just left and top
pushViewport(viewport(layout.pos.col = 1, layout.pos.row = 2))
grid.rect()
r1 <- rectGrob(0.5, 0.5, width = 0.2, height = 0.2, name="r1")
r2 <- rectGrob(0.5, 0.5, width = 0.2, height = 0.2, just = c("left", "top"), gp=gpar(col="blue"), name="r2")
grid.draw(r1)
grid.draw(r2)
grid.segments(0.5, 0.5, grobX(r2, 90), grobY(r2, 0), arrow=arrow(angle=15, type="closed",), gp=gpar(fill="black"))
grid.text("just: left and top", 0.6, 0.8)
upViewport()
# just left and bottom
pushViewport(viewport(layout.pos.col = 2, layout.pos.row = 1))
grid.rect()
r1 <- rectGrob(0.5, 0.5, width = 0.2, height = 0.2, name="r1")
r2 <- rectGrob(0.5, 0.5, width = 0.2, height = 0.2, just = c("left", "bottom"), gp=gpar(col="blue"), name="r2")
grid.draw(r1)
grid.draw(r2)
grid.segments(0.5, 0.5,grobX(r2, 90), grobY(r2, 0), arrow=arrow(angle=15, type="closed",), gp=gpar(fill="black"))
grid.text("just: left and bottom", 0.6, 0.8)
upViewport()
# just right bottom
pushViewport(viewport(layout.pos.col = 2, layout.pos.row = 2))
grid.rect()
r1 <- rectGrob(0.5, 0.5, width = 0.2, height = 0.2, name="r1")
r2 <- rectGrob(0.5, 0.5, width = 0.2, height = 0.2, just = c("right", "bottom"), gp=gpar(col="blue"), name = "r2")
grid.draw(r1)
grid.draw(r2)
grid.segments(0.5,0.5,grobX(r2, 90), grobY(r2, 0), arrow=arrow(angle=15, type="closed",), gp=gpar(fill="black"))
grid.text("just: right and bottom", 0.6, 0.8)
upViewport()
Result
conclusion
- The just parameter is used to adjust the graph in the opposite way. For example, if you want to adjust the graph upward, you have to adjust the just="bottom". It can also be understood that the real position is relative to the drawing position. For example, if the real position is lower than the drawing position, you can use the just="bottom"“
- When the angle of grobX is 90 and the angle of grobY is 0, the center position of the graph can be obtained. When the angle of grobX is 0, the position of X is the rightmost position of the graph, and when the angle of grobY is 0, the position of Y is the middle of the graph