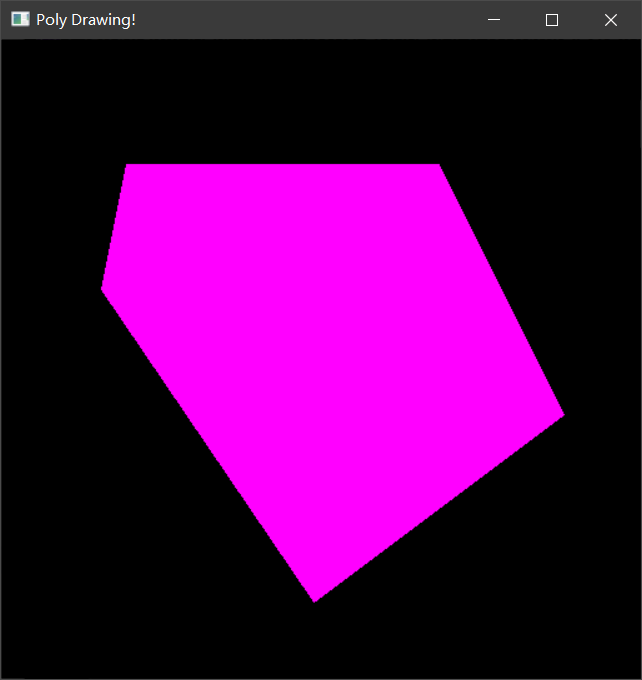
before starting the text, first know that the (0, 0) coordinate point in the screen is in the upper left corner and the maximum coordinate is in the lower right corner.
1, Drawing of basic graphics
1. Rectangle
the function of drawing rectangle in OpenCV is rectangle().
void rectangle(InputOutputArray img, Rect rec, const Scalar& color, int thickness = 1, int lineType = LINE_8, int shift = 0);
| parameter | effect |
|---|---|
| InputOutputArray img | Target image to draw |
| Rect rec | rect class object |
| const Scalar& color | Line color |
| int thickness = 1 | A positive number indicates the line width, - 1 indicates the filled rectangle |
| int lineType = LINE_8 | Type of line |
| int shift = 0 | Decimal places of coordinate points |
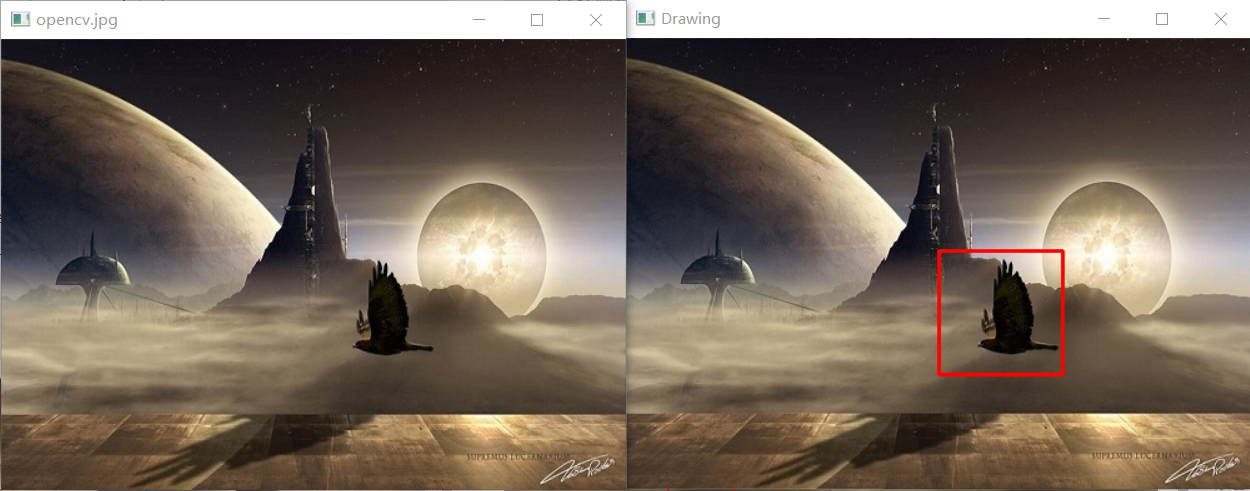
An example procedure for drawing a rectangle is as follows:
void MyDemo::drawing_Demo(Mat& image) {
	//draw rectangle
	Rect rect;
	rect.x = 250;	//Top left endpoint x coordinate
	rect.y = 170;	//Top left endpoint x coordinate
	rect.width = 100;	//width
	rect.height = 100;	//height
	rectangle(image, rect, Scalar(0, 0, 255), 2, 8, 0);
	imshow("Drawing", image);
}
2. Round
the function of drawing a circle in OpenCV is rectangle().
void cv::circle (InputOutputArray img, Point center, int radius, const Scalar &color, int thickness=1, int lineType=LINE_8, int shift=0);
| parameter | effect |
|---|---|
| InputOutputArray img | Target image to draw |
| Point center | Center coordinates |
| int radius | Radius of circle |
| const Scalar &color | Color of circle |
| int thickness=1 | A positive number indicates the line width, - 1 indicates the filled circle |
| int lineType = LINE_8 | Type of line |
| int shift = 0 | Decimal places of coordinate points |
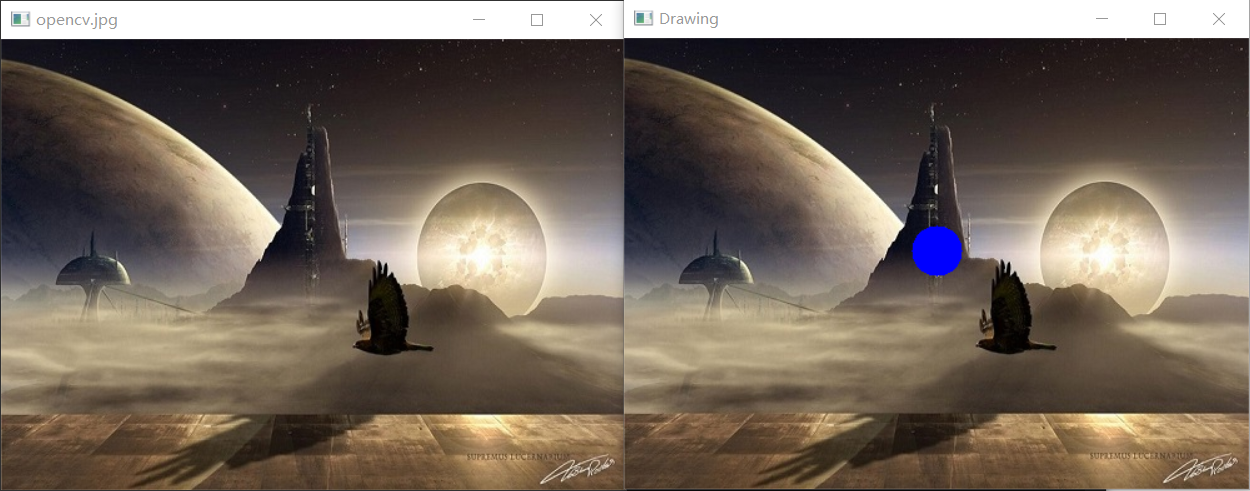
An example program for drawing a circle is as follows:
void MyDemo::drawing_Demo(Mat& image) {
	//Draw circle
	circle(image, Point(250, 170), 20, Scalar(255, 0, 0), -1, 8, 0);
	imshow("Drawing", image);
}
3. Straight line
the function of drawing a line in OpenCV is rectangle().
void cv::line(InputOutputArray img, Point pt1, Point pt2, const Scalar &color, int thickness=1, int lineType=LINE_8, int shift=0);
| parameter | effect |
|---|---|
| InputOutputArray img | Target image to draw |
| Point pt1r | Coordinates of endpoint 1 |
| Point pt2 | Coordinates of endpoint 2 |
| const Scalar &color | Line color |
| int thickness=1 | Line width |
| int lineType = LINE_8 | Type of line |
| int shift = 0 | Decimal places of coordinate points |
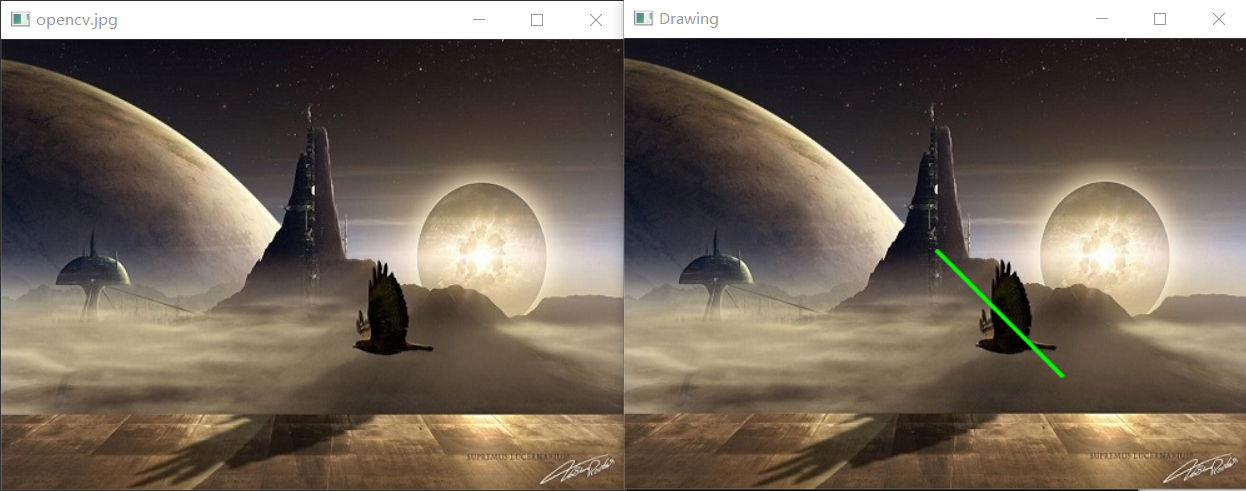
An example program for drawing a circle is as follows:
void MyDemo::drawing_Demo(Mat& image) {
	//draw a straight line
	line(image, Point(250, 170), Point(350, 270), Scalar(0, 255, 0), 2, LINE_AA, 0);
	imshow("Drawing", image);
}
4. Ellipse
the function for drawing ellipses in OpenCV is ellipse().
void ellipse(Mat&img, const RotatedRect&box, const Scalar& color, int thickness=1, int lineType=8);
| parameter | effect |
|---|---|
| Mat&img | Target image to draw |
| const RotatedRect&box | Elliptic class |
| const Scalar &color | Color of ellipse |
| int thickness=1 | A positive number indicates the line width, - 1 indicates the filled circle |
| int lineType = LINE_8 | Type of line |
The properties of the ellipse class RotatedRect are as follows (example):
RotatedRect rrt;	//create object
rrt.center = Point(100, 200);	//Center point of ellipse
rrt.size = Size(100, 200);		//Ellipse size (horizontal axis, vertical axis length)
rrt.angle = 0;		//Rotation angle
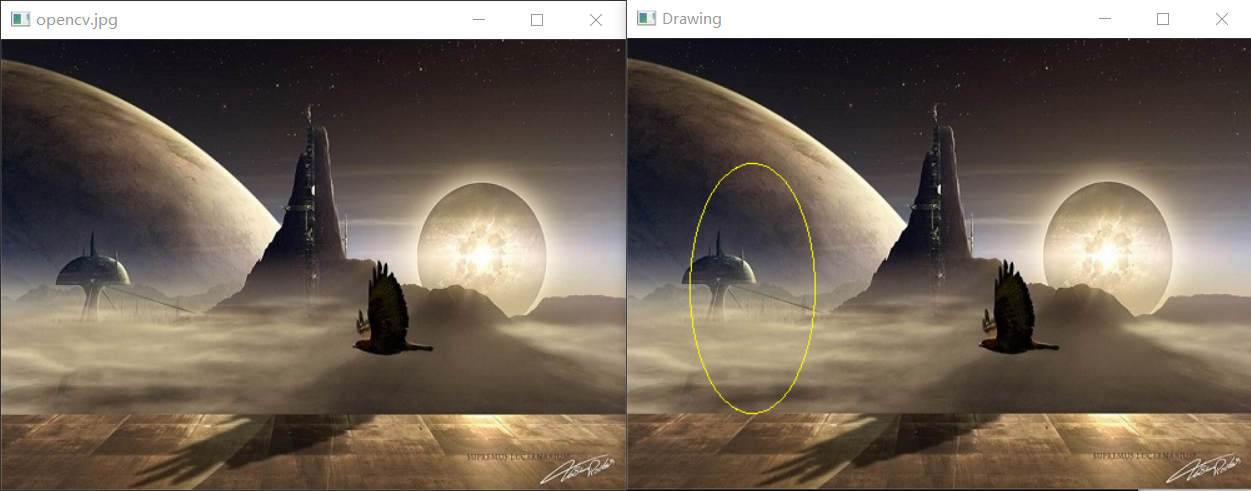
An example program for drawing a circle is as follows:
void MyDemo::drawing_Demo(Mat& image) {
	//Draw ellipse
	RotatedRect rrt;
	rrt.center = Point(100, 200);
	rrt.size = Size(100, 200);
	rrt.angle = 0;
	ellipse(image, rrt, Scalar(0, 255, 255), 1, 8);
	imshow("Drawing", image);
}
2, Polygon drawing method
the essence of polygon drawing is to define a point set composed of multiple points, so as to connect the points in the point set to form a polygon.
2.1 polygon border
the function used to draw the border of the polygon is ploylines().
void cv::polylines(
		InputOutputArray	img,
		InputArrayOfArrays	pts,
		bool	isClosed,
		const Scalar & color,
		int		thickness = 1,
		int		lineType = LINE_8,
		int		shift = 0
)
| parameter | effect |
|---|---|
| img | Target image to draw |
| pts | Pre constructed point set |
| isClosed | Is the polygon a closed shape |
| color | The color of the polygon border |
| thickness | Line width (can only be positive) |
| lineType | Type of line |
| shift | Decimal places of coordinate points |
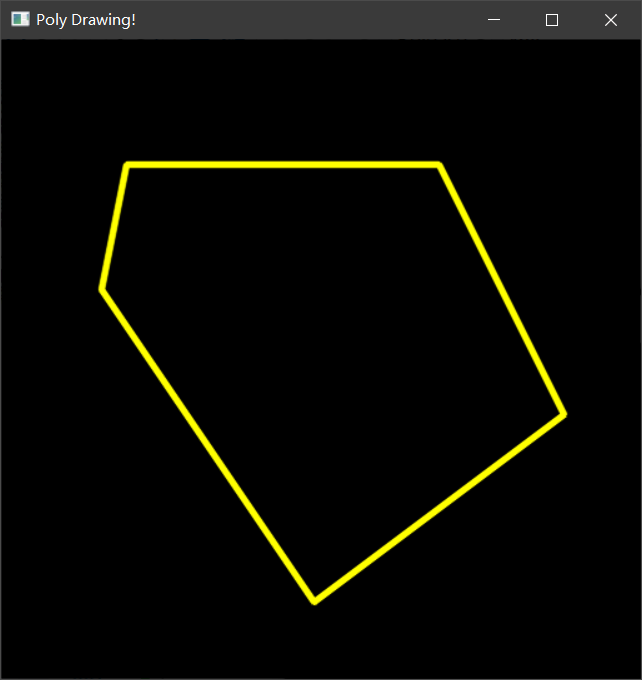
Example program: drawing a Pentagon
void MyDemo::polyDrawing_Demo() {
	//Create canvas
	Mat bg = Mat::zeros(Size(512, 512), CV_8UC3);

	//Create five points as the five vertices of the polygon
	Point p1(100, 100);
	Point p2(350, 100);
	Point p3(450, 300);
	Point p4(250, 450);
	Point p5(80, 200);

	//Add five points to the point set in turn
	std::vector<Point> pts;
	pts.push_back(p1);
	pts.push_back(p2);
	pts.push_back(p3);
	pts.push_back(p4);
	pts.push_back(p5);

	//Draw polygon border
	polylines(bg, pts, true, Scalar(0, 255, 255), 3, LINE_AA, 0);
	imshow("Poly Drawing!", bg);
}
Where PTS push_ Back is used to add points to the point set array. It is used when the number of point sets is unknown. This program knows a total of five points, so you can also use the following code to create a point set:
	std::vector<Point> pts(5);
	pts[0] = p1;
	pts[1] = p2;
	pts[2] = p3;
	pts[3] = p4;
	pts[4] = p5;
2.2 polygon filling
the function used to draw the filled polygon is fillPoly().
void cv::fillPoly(
		InputOutputArray	img,
		InputArrayOfArrays	pts,
		const Scalar & color,
		int		lineType = LINE_8,
		int		shift = 0
)
| parameter | effect |
|---|---|
| img | Target image to draw |
| pts | Pre constructed point set |
| color | The color of the polygon border |
| lineType | Type of line |
| shift | Decimal places of coordinate points |
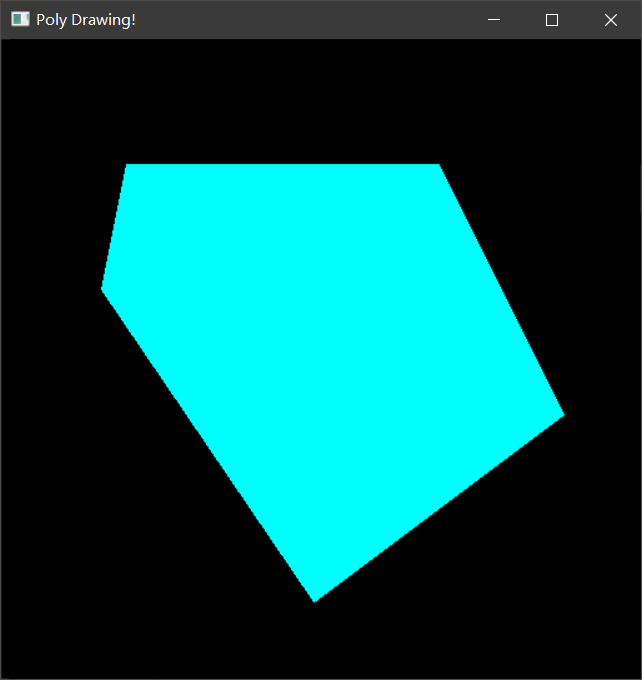
Example program: drawing a filled Pentagon
void MyDemo::polyDrawing_Demo() {
	//Create canvas
	Mat bg = Mat::zeros(Size(512, 512), CV_8UC3);

	//Create five points as the five vertices of the polygon
	Point p1(100, 100);
	Point p2(350, 100);
	Point p3(450, 300);
	Point p4(250, 450);
	Point p5(80, 200);

	//Add five points to the point set in turn
	std::vector<Point> pts;
	pts.push_back(p1);
	pts.push_back(p2);
	pts.push_back(p3);
	pts.push_back(p4);
	pts.push_back(p5);

	//Draws a closed Pentagon
	fillPoly(bg, pts, Scalar(255, 255, 0), 8, 0);
	imshow("Poly Drawing!", bg);
}
2.3 drawing multiple polygons
the function used to draw multiple polygons is drawContours().
void drawContours(
	InputOutputArray 	image,
	InputArrayOfArrays 	contours,
	int 	contourIdx,
	const Scalar& color,
	int 	thickness=1,
	int 	lineType=8,
	InputArray 	hierarchy=noArray(),
	int 		maxLevel=INT_MAX,
	Point 		offset=Point() )
| parameter | effect |
|---|---|
| img | Target image to draw |
| contours | Input contour groups, each composed of point vector s |
| contourIdx | Draw several contours. If the parameter is negative, draw all contours |
| color | Line color |
| thickness | Line width, negative value or CV_FILLED indicates the interior of the fill profile |
| lineType | Type of line |
Sample program: draw a Pentagon
void MyDemo::polyDrawing_Demo() {
	//Create canvas
	Mat bg = Mat::zeros(Size(512, 512), CV_8UC3);

	//Create five points as the five vertices of the polygon
	Point p1(100, 100);
	Point p2(350, 100);
	Point p3(450, 300);
	Point p4(250, 450);
	Point p5(80, 200);

	//Add five points to the point set in turn
	std::vector<Point> pts;
	pts.push_back(p1);
	pts.push_back(p2);
	pts.push_back(p3);
	pts.push_back(p4);
	pts.push_back(p5);

	//Add point set to contours
	//(equivalent to that contours is a collection of point sets)
	std::vector<std::vector<Point>> contours;
	contours.push_back(pts);

	//draw a polygon
	drawContours(bg, contours, -1, Scalar(255, 0, 255), -1);
	imshow("Poly Drawing!", bg);
}
