catalogue
Otsu threshold
Otsu threshold, also known as the maximum variance threshold, was proposed by Otsu zhanzhi of Japan in 1979. It is derived based on the principle of discrimination and least square method. Its basic idea is to maximize the variance between classes, so as to obtain the optimal threshold.
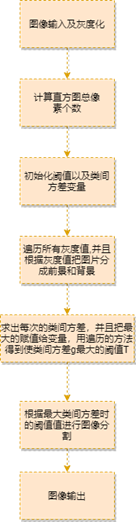
Algorithm flow
Make {0,1,2... L-1} Represents a picture with the size of M × N
 L in pixel digital image
 Different gray levels, ni
 Indicates that the gray level is i
 The total number of pixels in the image is MN=n0+n1 + × nL-1
 . The normalized histogram has a component pi=ni/MN
 , thus
i=0L-1 pi=1,pi≥0
Now, suppose you choose a threshold T (k) = k, 0 < K < L-1 And use it to thresholde the input image into two types C1
 And C2
 Where C1
 From the gray value in the image in the interval [0, k]
 All pixels in the, C2
 From the gray value in the interval [k+1, L-1]
 Consists of all pixels in the. With this threshold, pixels are classified into Class C1
 Probability P1(k) in
 Given by the cumulative sum of:
P1k=i=0k pi
To put it another way, this is Class C1 Probability of occurrence. Similarly, class C2
 The probability of occurrence is:
P2k=j=k+1L-1 pi=1-P1k
Assign to Class C1 The average gray value of is:
m1k=i=0k iPiC1=1P1ki=0k ipi
Similarly, assign to class C2 The average gray value of is:
m2k=i=k+1L-1 iPiC2=1P2ki=k+1L-1 ipi
The cumulative mean (average gray level) to the k-th level is given by the following formula:
mk=i=0k ipi
The average gray level of the whole image is given by the following formula:
mG=i=0L-1 ipi
In order to evaluate the segmentation quality of the selected threshold, the inter class variance is defined σ two For:
For:
σ2=P1m1-mG2+P2m2-mG2
The above formula can be simplified as:
σ2=P1P2m1-m22=mGP1-m2P11-P1
It can be seen from the above formula that the inter class variance of different threshold k is calculated σ two , just calculate m and P1
 Two parameters. In order to obtain the optimal threshold k*
 , from {0,1,2... L-1}
 Select different k to calculate the variance between classes σ two
 , when σ two
 The k obtained at the maximum is the maximum variance threshold.
Flow chart representation
result
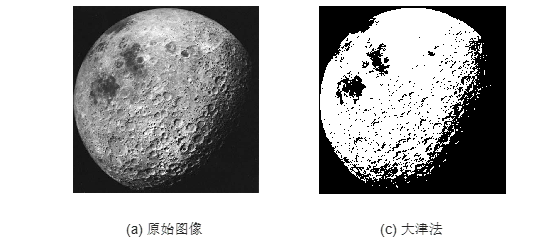
It can be seen from the figure that after Otsu threshold segmentation, basically two parts can be obtained, and the part of the moon can be extracted from the picture. It can quickly and effectively find the segmentation threshold between classes, but its disadvantage is also obvious, that is, it can only be segmented for a single target, or the interested targets belong to the same gray range.
code
clear; clc;
I=rgb2gray(imread('moon.jpg'));
subplot(1, 2, 1)
imshow(I);
xlabel('(a) original image ');
% level = graythresh(I);      %use MATLAB Function calculation threshold
% BW = im2bw(I, level);
% subplot(1, 3, 2)
% imshow(BW);
% xlabel('(b) graythresh');
% disp(['graythresh Calculate gray threshold:', num2str(level*255)]);
T = Otsu(double(I));     %The threshold was calculated using the Otsu method
disp(['Calculation of gray threshold by Otsu method:', num2str(T)])
BW = im2bw(I, T/255);
%Threshold segmentation
subplot(1, 2, 2)
imshow(BW);
xlabel('(c) Otsu ');

function ThreshValue = Otsu(Imag)
% Otsu method calculation threshold
% Input:
%    Imag: Two dimensional array, numerical value represents gray level;
% Output:
%    ThreshValue: threshold
iMax = max(Imag(:));              % Maximum
iMin = min(Imag(:));               % minimum value
T = iMin:iMax;                        % Gray value range
Tval = zeros(size(T));               % variance
[iRow, iCol] = size(Imag);        % Data dimension size
imagSize = iRow*iCol;            % Number of pixels
% Traverse the gray value and calculate the variance
for i = 1 : length(T)
    TK = T(i);
    iFg = 0;          % prospect
    iBg = 0;          % background
    FgSum = 0;    % Total prospects
    BgSum = 0;    % Total background
    for j = 1 : iRow
        for k = 1 : iCol
            temp = Imag(j, k);
            if temp > TK
                iFg = iFg + 1;      % Foreground pixel statistics
                FgSum = FgSum + temp;
            else
                iBg = iBg + 1;      % Background pixel statistics
                BgSum = BgSum + temp;
            end
        end
    end
    w0 = iFg/imagSize;      % Foreground proportion
    w1 = iBg/imagSize;     % Background proportion
    u0 = FgSum/iFg;         % Foreground gray average
    u1 = BgSum/iBg;        % Background gray average
    Tval(i) = w0*w1*(u0 - u1)*(u0 - u1);     % Calculate variance
end
[~, flag] = max(Tval);             % Maximum subscript
ThreshValue = T(flag);
end