preface
Recently, when learning autopilot system, I met the concept of co operation. The process and thread have been lost, and there is another collaborative process. I believe many friends have the same idea as the author. After reading a lot of materials, they decided to write a summary to summarize the connections and differences between the three, and finally come down to the application of collaborative process in automatic driving. The goal of junior programmers is to clarify the concepts of the three and apply them to practice, while senior engineers consider the performance and cost of realizing the three at the system level. Until now, the implementation of the three is still one of the modules that are continuously updated and improved by the Linux kernel and various programming languages. Therefore, it is a compulsory course for advanced programmers to clarify the relationship and application of the three. If you are also vague about this knowledge, this article will be helpful to you. The purpose of this paper is to make a comprehensive summary of a series of complex concepts and knowledge points of process / thread / collaborative process. At the same time, try to make the knowledge points precise, detailed and comprehensive, distinguish fuzzy concepts, give consideration to the source code and programming implementation, and finally come down to the collaborative process implementation of Apollo.
The text of this plan is as concise as possible, but it can not achieve the purpose of refinement. Therefore, the positioning of this series of articles is a detailed summary of complex knowledge points, and on this basis, it should be as concise as possible. Because I have consulted a lot of materials and spent a lot of energy, although it is not perfect, I hope your little hand can support the author and make a one click triple, because the author's subsequent articles can help you keep exploring.
This series of articles is divided into seven parts: the first part: the evolution from process to collaborative process, involving the progress of program history and the knowledge of computer system structure. Chapter 2: summarize the system commands related to process / thread, so that you can have a perceptual understanding of them at the beginning, not just raw words. Chapter 3: how to view the source code of linux system? First-hand knowledge is the foundation. Only when you have access to first-hand information can you become a big fan in the industry. The source code is undoubtedly the most important first-hand information. Don't worry. I'll teach you here. Part IV: process knowledge crosstalk. Because processes, threads and collaborative processes come down in one continuous line, most of the process knowledge is also applicable to threads and collaborative processes. If you have a thorough understanding of the process, the difficulties of threads and collaborative processes will be solved. The fifth part: the nature discrimination and realization difference of the three. At present, most articles start with the concept, especially the nature comparison of the three, and the concept is easy to be confused. Therefore, the author adopts the mode of telling things in detail, with the foreshadowing in front, I believe you will feel inspired when you see the comparison of nature again. After analyzing the nature, we will also make a simple comparison on the implementation code of the three. Chapter 6: the scheduling of the three in memory. Memory scheduling can better reflect the process of program execution. Here, we go deep into the replacement of process memory scheduling to take readers to appreciate the charm of memory scheduling. Chapter 7: comparison and summary of various current collaborative processes, from the boost library to various collaborative libraries libgo/ntyco/libco based on the boost library, as well as the current implementation of Python/Java/Go; The author thinks that there are few examples of libgo's application and implementation in the current article. However, the author thinks that there are few examples of libgo's application and implementation in the current article; Chapter 9: the application of cooperative process in Apollo, analyzes the source code, advantages and disadvantages of Apollo cooperative process.
Summary:
This chapter is divided into two sections: the first section explains the process related system commands and field parsing, and the second section is thread related. Since the cooperative process is generally a call library, there are no relevant system commands. Later, we will choose a specific mature library libgo for comparison and explanation, which will not be mentioned here for the time being.1. Process related commands
1.1 graphic view command
- gnome graphics viewing:
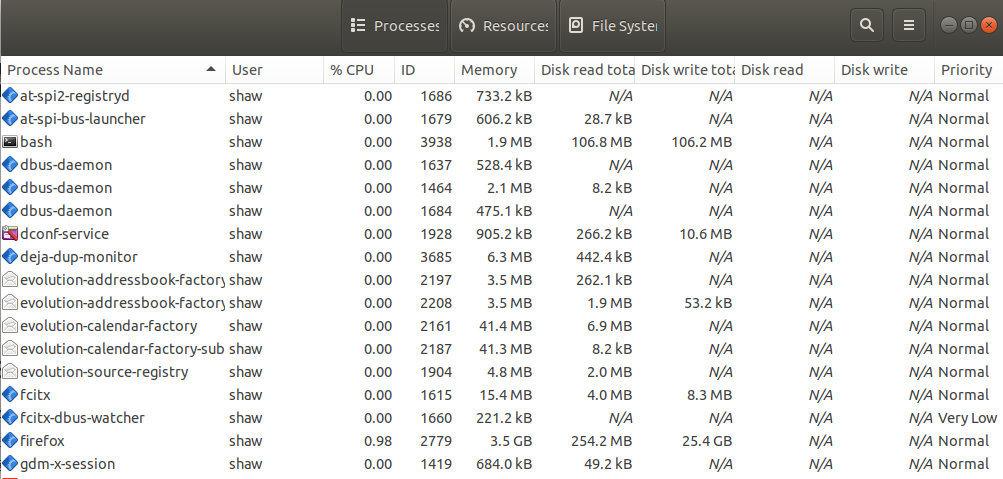
gnome-system-monitor
The display interface is as follows, including process information, system resources and file system. The PID of process information is the process ID, which is unique. Can you understand other fields:
2. pstree
The pstree (display a tree of processes) command displays all processes in a tree view. The tree view will take pid (if specified) or init as the root. If a user id is specified, the tree view will only display the processes owned by the user. The command parameters are as follows:
-p develop process ID
-t displays the full name of the thread
-n sort according to PID
-h highlight the current process and its parent process
-A displays the complete instructions and parameters of the process. If it is a process replaced by memory, parentheses will be added
-c if there are repeated process names, they will be listed separately (the default value is to add *)
It can display the relationship between processes, and can also display the sub processes and threads with specified ID (such as browser). You can also see the web page thread you open:
//Show inter process relationships
$ pstree -apnh
systemd,1 splash
  ├─systemd-journal,387
  ├─systemd-udevd,422
  ├─systemd-timesyn,922
  │   └─{systemd-timesyn},925
//pgrep can find the currently running process and list the qualified process ID s
pgrep firefox
2779
//Displays the child processes and threads with the specified ID
$ pstree -p 2779 -t
firefox(2779)─┬─Privileged Cont(3078)─┬─{HTML5 Parser}(3119)
              │                       ├─{IPC I/O Child}(3084)
              │                       ├─{ImageBridgeChld}(3101)
              │                       ├─{ImageIO}(3090)
              │                       ├─{JS Watchdog}(3086)
1.2 static view command ps
ps is process status. Its command parameters are listed as follows:
- -A ## view all processes
- a ## view all foreground processes
- x ## view all background processes
- l ## view details, where
- f ## displays the parent-child relationship of the process
- e ## display process details (call of system resources)
- – sort ## process sorting
- -o [parameter] ## displays the process designation information, and the optional parameters are as follows:
comm ## process name
user ## process owner
Group ## process group
%cpu ## process cpu utilization
%mem ## process memory usage
pid ## process pid
nice ## process priority, range - 20 ~ 19.
nice can be used as a command to set priorities, such as:
//View priority
$ ps ax -o pid,nice,comm,user | head -5
  PID  NI COMMAND         USER
    1   0 systemd         root
    2   0 kthreadd        root
    3 -20 rcu_gp          root
    4 -20 rcu_par_gp      root

//Set priority: nice -n priority number 	 Process name
nice -n -4 vim &	##Start vim and specify the process priority as - 4, & indicating background operation
ps common combinations:
- ps aux ## displays all processes in the system and the process users
- ps ef ## displays process details and parent-child relationships
- PS aux -- sort% CPU /% MEM ## displays all processes in the system and the process users, and sorts them according to cpu/mem utilization
For example, the most commonly used combination of aux and axl is shown as follows:
$ ps aux | head -10
USER       PID %CPU %MEM    VSZ   RSS TTY      STAT START   TIME COMMAND
root         1  0.0  0.0 226088  9676 ?        Ss    2021   8:23 /sbin/init splash
root         2  0.0  0.0      0     0 ?        S     2021   0:01 [kthreadd]
root         3  0.0  0.0      0     0 ?        I<    2021   0:00 [rcu_gp]
root         4  0.0  0.0      0     0 ?        I<    2021   0:00 [rcu_par_gp]
root         9  0.0  0.0      0     0 ?        I<    2021   0:00 [mm_percpu_wq]
ps axl | head -5
F   UID   PID  PPID PRI  NI    VSZ   RSS WCHAN  STAT TTY        TIME COMMAND
4     0     1     0  20   0 226088  9676 -      Ss   ?          8:46 /sbin/init splash
1     0     2     0  20   0      0     0 -      S    ?          0:01 [kthreadd]
1     0     3     2   0 -20      0     0 -      I<   ?          0:00 [rcu_gp]
1     0     4     2   0 -20      0     0 -      I<   ?          0:00 [rcu_par_gp]
Description of fields in ps aux/axl: USER - USER, PID/PPID/SPID - process ID / parent process ID / system process ID,% CPU - CPU utilization,% MEM - memory utilization, VSZ - virtual memory utilization, RSS - actual memory utilization, TTY - terminal, STAT - status, START - START TIME of process, TIME - total TIME of process occupying CPU, COMMAND - directory or file name, F - process flag or permission (process flags, 4 for root, 1 for fork only), PRI - priority (- 100... 39), WCHAN: whether the process is running (- represents running, others represent the name of the kernel function that the process is sleeping; the name of the function is obtained from the / root/system.map file).
Where the value in STAT (process status) indicates:
- S ## can interrupt sleep (sleep, blocked, waiting for a condition to form or receiving a signal)
- l ## there is locking space in memory
- N ## priority low
- < ## priority high
- +## foreground operation
- s ## top level process
- D ## non interruptible sleep (usually during IO operation) does not wake up and cannot run after receiving the signal. The process must wait until an interrupt occurs
- R ## is running or runnable (in the run queue)
- T ## stopped processes stop after receiving SIGSTOP, SIGSTP, SIGTIN and SIGTOU signals
- W ## no resident pages, changing pages (valid before 2.6. Kernel)
- X ## dead process (not started)
- P ## waiting for swap page
- Zombie (a defunct process), the process has been terminated, but the process descriptor exists until it is released after the parent process calls wait4() system call
- l multithreading (using CLONE_THREAD, similar to pthreads of NPTL)
1.3 dynamic view command top
View the top dynamically, like the task manager of windows, as follows:
$ top
top - 14:34:05 up 28 days, 18:03,  1 user,  load average: 0.41, 0.29, 0.20
Tasks: 380 total,   5 running, 271 sleeping,   0 stopped,   0 zombie
%Cpu(s):  1.5 us,  0.7 sy,  0.0 ni, 97.6 id,  0.0 wa,  0.0 hi,  0.1 si,  0.0 st
KiB Mem : 32485348 total, 14727192 free, 10751656 used,  7006500 buff/cache
KiB Swap: 15999996 total, 15999996 free,        0 used. 19731244 avail Mem

  PID USER      PR  NI    VIRT    RES    SHR S  %CPU %MEM     TIME+ COMMAND
 1708 shaw      20   0 5212864 533048 156940 R   7.3  1.6 111:16.31 gnome-shell
 1421 shaw      20   0 25.122g 200084 154944 R   5.0  0.6 388:14.29 Xorg
 2779 shaw      20   0 61.363g 0.013t 0.010t S   4.7 43.9   1741:16 firefox
30446 shaw      20   0 4025532 693656 233384 S   4.3  2.1 520:34.93 Web Content
 1777 shaw      20   0 3171592  21096  16636 S   2.0  0.1 605:03.78 pulseaudio
Where: VIRT: virtual memory usage virtual memory (Applied memory), RES: resident memory usage resident memory (occupied memory), SHR: shared memory shared memory (shared library size).
During top operation, the display mode of the process can be controlled through the internal command of top. Internal commands are as follows:
- h – display help
- s – change the screen update frequency
- l – turn off or turn on the top information in the first line of the first part
- t – close or open the representation of Tasks in the second line and Cpus in the third line of the first part
- m – turn off or on the representation of Mem in the fourth line and Swap in the fifth line of the first part
- N – indicates the process list in the order of PID size
- P – arrange the process list in the order of CPU utilization
- M – sort the process list in order of memory usage
- n – sets the number of processes displayed in the process list
- < forward
- >Backward
- z color
- Z set color (use digital adjustment)
- q exit top
1.4 send signal to process
Use kill to send signals to the process, and use kill -l to view the signals supported by kill:
$ kill -l
 1) SIGHUP	 2) SIGINT	 3) SIGQUIT	 4) SIGILL	 5) SIGTRAP
 6) SIGABRT	 7) SIGBUS	 8) SIGFPE	 9) SIGKILL	10) SIGUSR1
11) SIGSEGV	12) SIGUSR2	13) SIGPIPE	14) SIGALRM	15) SIGTERM
16) SIGSTKFLT	17) SIGCHLD	18) SIGCONT	19) SIGSTOP	20) SIGTSTP
21) SIGTTIN	22) SIGTTOU	23) SIGURG	24) SIGXCPU	25) SIGXFSZ
26) SIGVTALRM	27) SIGPROF	28) SIGWINCH	29) SIGIO	30) SIGPWR
31) SIGSYS	34) SIGRTMIN	35) SIGRTMIN+1	36) SIGRTMIN+2	37) SIGRTMIN+3
38) SIGRTMIN+4	39) SIGRTMIN+5	40) SIGRTMIN+6	41) SIGRTMIN+7	42) SIGRTMIN+8
43) SIGRTMIN+9	44) SIGRTMIN+10	45) SIGRTMIN+11	46) SIGRTMIN+12	47) SIGRTMIN+13
48) SIGRTMIN+14	49) SIGRTMIN+15	50) SIGRTMAX-14	51) SIGRTMAX-13	52) SIGRTMAX-12
53) SIGRTMAX-11	54) SIGRTMAX-10	55) SIGRTMAX-9	56) SIGRTMAX-8	57) SIGRTMAX-7
58) SIGRTMAX-6	59) SIGRTMAX-5	60) SIGRTMAX-4	61) SIGRTMAX-3	62) SIGRTMAX-2
//Kill a process
kill -9 PID
Because there are so many signals, it's enough to remember some commonly used ones (kill - number / signal):
- 1) SIGHUP reload configuration
- 2) SIGINT keyboard interrupt ctrl+c
- 3) SIGQUIT keyboard exits ctrl +, similar to SIGIN
- 9) SIGKILL forced termination, unconditional
- 15) SIGTERM termination (normal end), default signal
- 18) SIGCOUNT continue
- 19) SIGSTOP keyboard pause ctrl+z
1.5 pseudo file system / proc
Proc file system is a pseudo file system, which only exists in memory and does not occupy external memory space. It provides an interface for accessing system kernel data in the way of file system. Users and applications can get relevant information through proc and change some parameters of the kernel. Because the information of the system changes dynamically, when the user or application reads the proc file, the proc file system dynamically reads the required information from the system kernel and submits it. According to the usage of / proc, this section is divided into three parts: system state, process state and how to evaluate process memory
1.5.1 system status information
/The system information provided by various files under the proc file system is not specific to a specific process, but can be used in the context of the whole system. Not all of the files or subfolders listed below exist in your system, depending on your kernel configuration and loaded modules. In addition, there are three important directories under proc: net, scsi and sys. Sys directory is writable and can be used to access or modify kernel parameters, while net and scsi depend on kernel configuration. For example, if the system does not support scsi, the scsi directory does not exist. Here are some examples.
- /proc/cmdline: system startup information, including kernel image, the location of the first block of the root directory file of the system, startup parameter information, etc. As shown below, where BOOT_IMAGE: the system starts the image; Root: the address of the root directory file, which can be replaced by / dev / sda1 (if the root file system is in the first partition), but cannot be replaced by root=(hd0,msdos1), because it is not a legal parameter type; ro: mount the root file system in read-only mode at startup; quiet: do not display the progress of instruction execution; Splash: display startup animation; vt.handoff=7: tty7 will be used in the graphical interface. This item is used to prohibit splash from occupying tty7. Therefore, if the splash parameter is removed, this item will become invalid. The above configuration is in / boot / grub / grub In CFG.
$ cat /proc/cmdline
BOOT_IMAGE=/boot/vmlinuz-4.4.0-89-generic root=UUID=bef418fa-4202-4513-b39b-cde6a5d9753f ro quiet splash vt.handoff=7
- /proc/cpuinfo: this file provides a variety of information about the system CPU. This information is obtained from the CPU test code in the kernel. The document lists the general model of CPU (386486586686, etc.) and more specific information available (manufacturer, model and version). The file also contains the processor speed expressed in bogomips, and if multiple features or bug s of the CPU are detected, the file will also contain corresponding flags. The format of this file is: the file is composed of multiple lines, and each line includes a field name, a colon and a value.
- /proc/meminfo: displays the information of memory status, such as the total amount of free memory, used physical memory and swap memory in the system. It also shows the total amount of shared memory and buffers used by the kernel. The format of this information is similar to the result displayed by the free command.
- /proc/stat: this file contains information about CPU utilization, disks, memory pages, memory swapping, all interrupts, contact switches, and reward bootstrap time (seconds since January 1, 1970).
- /proc/devices: the main device number of character and block devices and the device name assigned to these device numbers.
- /proc/mounts: this file gives the file system information installed on the current system in the format of / etc/mtab file. This file can also reflect any file system that was manually installed so that it was not included in the / etc/mtab file.
- /proc/sys: there are many subdirectories under this directory. Many items in this directory can be used to adjust the performance of the system. This directory contains too much information to cover all of it. Only some files in the directory are shown in the example.
- /proc/net: the files in this directory describe or modify the behavior of networking code. Many of these special files can be set up or queried by using the arp, netstat, route, and ipfwadm commands.
- proc/scsi: this directory contains a file that lists all detected SCSI devices, and provides a directory for each controller driver, and a subdirectory for each instance of the installed controller.
$ ls /proc/sys
debug  dev  fs  kernel  net  proc  sunrpc  vm
--------------------------------------------------------------------------------
ls /proc/sys/fs
aio-max-nr   dentry-state       file-nr      lease-break-time  overflowgid
aio-nr       dir-notify-enable  inode-nr     leases-enable     overflowuid
binfmt_misc  file-max           inode-state  mqueue            quota
--------------------------------------------------------------------------------
ls /proc/sys/net
core  ethernet  ipv4  ipv6  unix
1.5.2. Process status information
In addition to the above, there are some directories named by numbers, which are process directories. Each process currently running in the system has a corresponding directory. Under proc, the PID of the process is the directory name. They are the interfaces to read process information. The self directory is the information interface for reading the process itself, which is a link. Other directories are as follows:
- /proc/[pid]/cmdline: the complete command line information of the process runtime, including some parameters specified at runtime. For example, if it is mysqld, it includes basedir = =, datadir = =, port =, socket =, etc.
- /proc/[pid]/cwd: current working directory is the working directory of the current process, including all sub directories.
- /proc/[pid]/environ: this file saves the environment variables of the process. Each item is separated by a null character, and the end may also be a null character.
- /exe: a symbolic connection of the actual executing program, pointing to the binary code to be executed.
- /fd: each file opened by the process has a symbolic connection in the subdirectory, which is named after the file descriptor (number in parentheses). This name is actually a symbolic connection to the real file (the same as the exe record). For example, 0 is standard input, 1 is standard output, 2 is standard error, and so on. As follows:
- /proc/[pid]/stack shows the kernel call stack information of the current process. Only config is opened during kernel compilation_ The stacktrace compilation option will generate this file.
- /proc/[pid]/syscall displays the system call being executed by the current process. Config was turned on when the kernel was compiled_ HAVE_ ARCH_ The tracehook compilation option will generate this file.
- /proc/[pid]/wchan displays the functions currently running in the kernel when the process sleep s.
- /proc/[pid]/stat|status: the information to be represented by the two is the same. All CPU active information of the process, and all values in this file are accumulated from the start of system startup to the current time. But the latter is given in a format that is easy to read.
cat status
Name:	ibus-engine-lib
Umask:	0002
State:	S (sleeping)
Tgid:	3402
Ngid:	0
Pid:	3402
PPid:	1867
TracerPid:	0
Uid:	1000	1000	1000	1000
Gid:	1000	1000	1000	1000
FDSize:	64
Groups:	4 24 27 30 46 116 126 127 1000
NStgid:	3402
NSpid:	3402
NSpgid:	1867
NSsid:	1419
VmPeak:	  295844 kB
VmSize:	  295844 kB
VmLck:	       0 kB
VmPin:	       0 kB
VmHWM:	    9984 kB
VmRSS:	    9984 kB
RssAnon:	    1100 kB
RssFile:	    8884 kB
RssShmem:	       0 kB
VmData:	   25960 kB
VmStk:	     132 kB
VmExe:	     780 kB
VmLib:	   14280 kB
VmPTE:	     200 kB
VmSwap:	       0 kB
HugetlbPages:	       0 kB
CoreDumping:	0
THP_enabled:	1
Threads:	4
SigQ:	0/126699
SigPnd:	0000000000000000
ShdPnd:	0000000000000000
SigBlk:	0000000000000000
SigIgn:	0000000001001000
SigCgt:	0000000180004002
CapInh:	0000000000000000
CapPrm:	0000000000000000
CapEff:	0000000000000000
CapBnd:	0000003fffffffff
CapAmb:	0000000000000000
NoNewPrivs:	0
Seccomp:	0
Speculation_Store_Bypass:	thread vulnerable
Cpus_allowed:	ffff
Cpus_allowed_list:	0-15
Mems_allowed:	00000000,00000000,00000000,00000000,00000000,00000000,00000000,00000000,00000000,00000000,00000000,00000000,00000000,00000000,00000000,00000000,00000000,00000000,00000000,00000000,00000000,00000000,00000000,00000000,00000000,00000000,00000000,00000000,00000000,00000000,00000000,00000001
Mems_allowed_list:	0
voluntary_ctxt_switches:	36
nonvoluntary_ctxt_switches:	0
- /proc/[pid]/maps|smaps: all reflect the complete distribution of processes in memory at runtime. This is a complete list. The latter is given in a more detailed format, through which you can see all the memory information associated with the corresponding process (including shared and private), as follows:
$ sudo cat /proc/3402/smaps
55eed4630000-55eed46f3000 r-xp 00000000 103:0b 2366159                   /usr/lib/ibus/ibus-engine-libpinyin
Size:                780 kB
KernelPageSize:        4 kB
MMUPageSize:           4 kB
Rss:                 704 kB
Pss:                 704 kB
Shared_Clean:          0 kB
Shared_Dirty:          0 kB
Private_Clean:       704 kB
Private_Dirty:         0 kB
Referenced:          704 kB
Anonymous:             0 kB
LazyFree:              0 kB
AnonHugePages:         0 kB
ShmemPmdMapped:        0 kB
FilePmdMapped:        0 kB
Shared_Hugetlb:        0 kB
Private_Hugetlb:       0 kB
Swap:                  0 kB
SwapPss:               0 kB
Locked:                0 kB
THPeligible:		0
VmFlags: rd ex mr mw me dw sd
For the memory actually occupied by the process, / proc/[pid]/status, VmSize (the total memory currently occupied by the process, including applied unused and shared library memory) is exaggerated because it contains repeated statistics and unused memory, VmHWM / VmRss (maximum time / size of physical memory currently used by the application) is a relatively ideal basis for memory evaluation. To get a certain amount of memory usage, use all private in / proc/[pid]/smap_ Clean (non rewritten private page) and Private_Dirty (non rewritten private pages) adds up to a good solution.
In order to control the length, other fields will not be explained here. Interested partners can refer to appendix 11.
2. Thread related commands
There are few thread related system commands. Here are three for your reference.
2.1 ps related thread commands
- ps -T: in the ps command, the "- T" option enables thread viewing. The following command lists all threads created by the process with process number:
$ ps -T -p 2779 | head -5
  PID  SPID TTY          TIME CMD
 2779  2779 tty1     03:12:51 firefox
 2779  2785 tty1     00:00:00 gmain
 2779  2786 tty1     00:00:43 gdbus
 2779  2791 tty1     06:57:27 IPC I/O Parent
The "SPID" column indicates the thread ID, while the "CMD" column shows the thread name.
- ps -Lf pid: view the lwp number of the specified process (light weight process).
$ ps -Lf 2779 | head -5
UID        PID  PPID   LWP  C NLWP STIME TTY      STAT   TIME CMD
shaw      2779     1  2779  0  239  2021 tty1     Sl+  263:29 /usr/lib/firefox/firefox -ne
shaw      2779     1  2785  0  239  2021 tty1     Sl+    0:00 /usr/lib/firefox/firefox -ne
shaw      2779     1  2786  0  239  2021 tty1     Sl+    1:11 /usr/lib/firefox/firefox -ne
shaw      2779     1  2791  1  239  2021 tty1     Sl+  561:43 /usr/lib/firefox/firefox -ne
shaw      2779     1  2900  0  239  2021 tty1     Sl+   11:56 /usr/lib/firefox/firefox -ne
- ps xH: you can view all existing threads, and each line represents a thread.
- ps -mp: This allows you to view the number of threads in a process.
2.2 top -H display thread
Add the - H option when starting top, and a thread is displayed in the top line. Otherwise, it shows a process on one line. Of course, you can also specify the pid display thread:
top - 21:48:03 up 31 days,  1:17,  1 user,  load average: 0.45, 0.56, 0.54
Threads: 253 total,   0 running, 253 sleeping,   0 stopped,   0 zombie
%Cpu(s):  2.4 us,  0.6 sy,  0.0 ni, 96.9 id,  0.0 wa,  0.0 hi,  0.2 si,  0.0 st
KiB Mem : 32485348 total, 13764432 free, 11553884 used,  7167032 buff/cache
KiB Swap: 15999996 total, 15999996 free,        0 used. 18968152 avail Mem

  PID USER      PR  NI    VIRT    RES    SHR S %CPU %MEM     TIME+ COMMAND
 2791 shaw      20   0 59.682g 0.013t 0.010t S  1.7 43.3 417:41.50 IPC I/O Parent
 2953 shaw      20   0 59.682g 0.013t 0.010t S  1.3 43.3 359:26.11 IPDL Background
 2929 shaw      20   0 59.682g 0.013t 0.010t S  0.7 43.3 357:18.29 GLXVsyncThread
 2779 shaw      20   0 59.682g 0.013t 0.010t S  0.3 43.3 193:28.88 firefox
19477 shaw      20   0 59.682g 0.013t 0.010t S  0.3 43.3   1:37.65 Indexed~ #14341
Note the Threads in the second line, indicating that Threads are displayed at this time. When this is Tasks, it indicates the process interface.
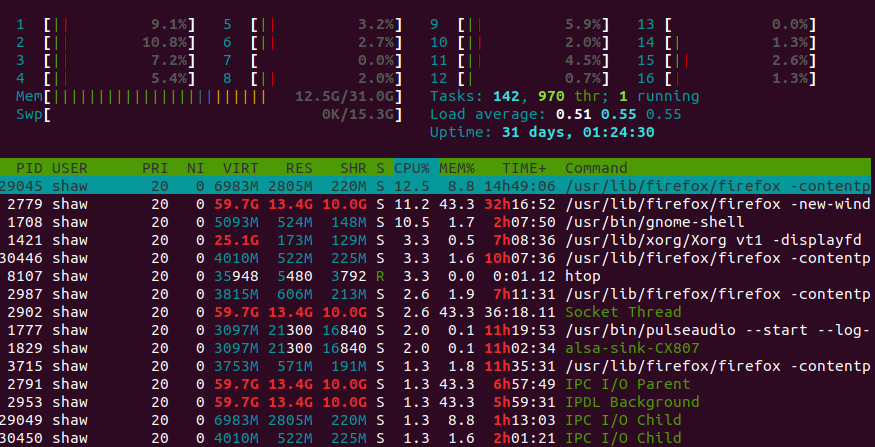
2.3 top's upgraded version of htop
To be honest, I don't see how helpful the upgraded version is to the viewing thread. The use methods listed here are for reference only. Display after installing htop. The command is as follows:
$ apt install htop
$ htop
 For detailed usage of htop, please refer to appendix 12.
Summary: this chapter summarizes the process and thread related system commands. The next chapter goes further and explains the method of viewing the source code of process and thread system, and gives the source code of libgo, the selected collaborative library.