Analysis of KITTI data set
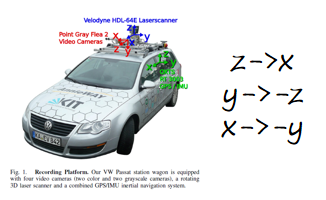
The data acquisition platform of KITTI dataset is equipped with two gray cameras, two color cameras, a Velodyne 64 line 3D lidar, four optical lenses and a GPS navigation system.
This session focuses on the lidar data part
Introduction to KITTI dataset
1.KITTI is the largest computer vision algorithm evaluation data set under automatic driving scene in the world
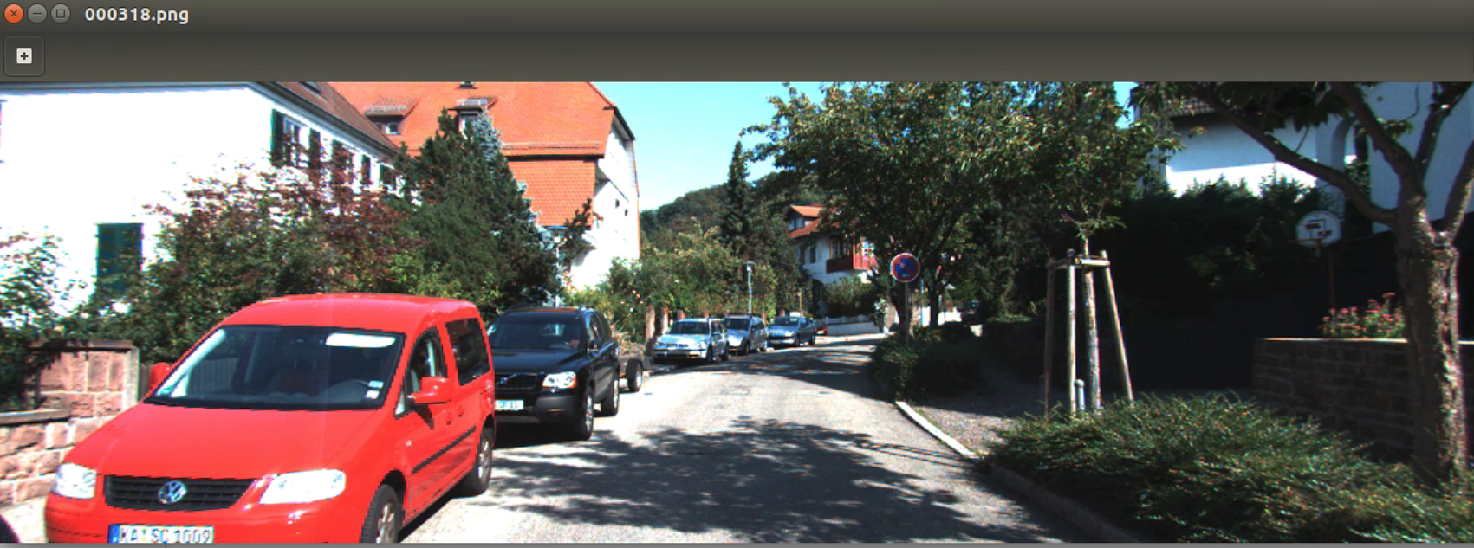
2.KITTI contains the real image data collected from urban, rural and expressway scenes. There are up to 15 vehicles and 30 pedestrians in each image, as well as various degrees of occlusion and truncation.
3. For 3D object detection, label is subdivided into car, van, truck, pedestrian, pedestrian(sitting), cyclist, tram and misc.
4. The lidar is a Velodyne HDL-64E laser with a scanning frequency of 10Hz, 64 lines, 0.09 ° angular resolution, 2cm detection accuracy, 1.3 million points per second and a detection distance of 120m
KITTI basic structure

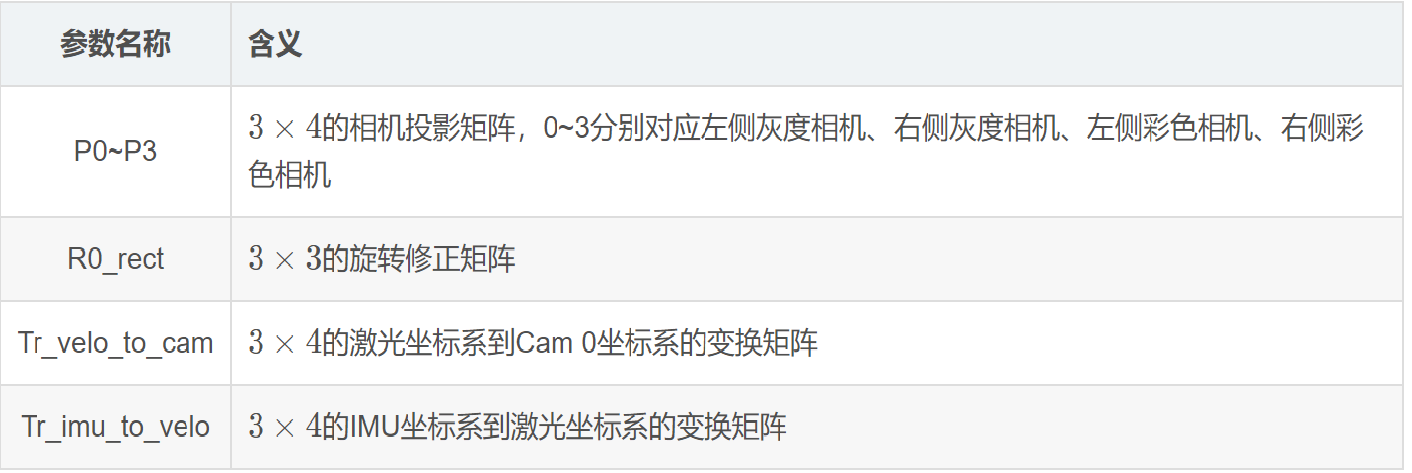
Calib: 000000~007480.txt sensor calibration data
Image_2: 000000~007480.png color camera image
Label_2: 000000~007480.txt label data set
Velodyne: 000000~007480.bin laser point cloud data
Velodyne_reduced: empty
Calib

Velodyne
LIDAR point cloud data is saved in floating-point binary files. Save the * * (x, y, z) * * coordinates and reflectivity r information of laser points in the lidar coordinate system, with an average of 120000 laser points per frame.
Read velodyne in KITTI dataset bin file
pcl::PointCloud<PointXYZI>::Ptr points (new pcl::PointCloud<PointXYZI>);
for (int i=0; input.good() && !input.eof(); i++)
{
	PointXYZI point;
	input.read((char *) &point.x, 3*sizeof(float));
	input.read((char *) &point.intensity, sizeof(float));
	points->push_back(point);
}
input.close();
write in. pcd file
pcl::PCDWriter writer;
writer.write<PointXYZI> (outfile, *points, false);
PointCloud<PointXYZ>::Ptr cloud(new PointCloud<PointXYZ>);
Open with vscode pcd file, you can intuitively see that each line is composed of x, y, z, r (reflection intensity, generally useless)

Label data analysis
First open a label and have a look
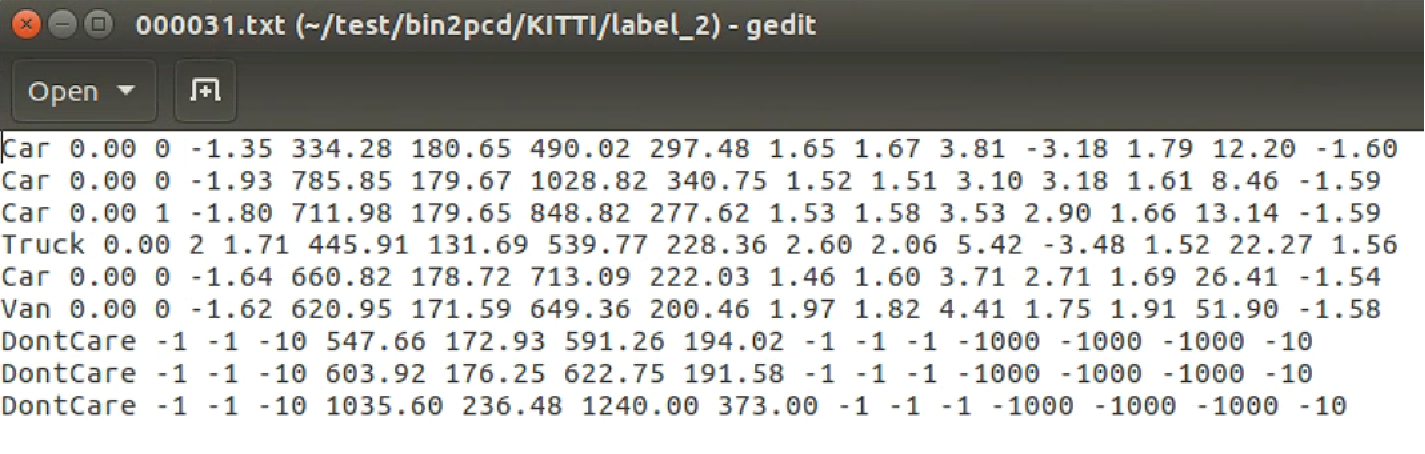
There are 15 fields in total

It is worth mentioning alpha and rotation_ Difference and connection of Y, rotation_ Both y and alpha are negative counterclockwise. They can be converted to each other.

From the schematic diagram, we can get: alpha = rotation_y - theta
**Note: * * direct conversion of data sets will cause slight loss of accuracy
Point cloud data visualization
This paper mainly uses PCLVisualizer class in PCL library to visualize point cloud data
Create a point cloud object
Read the pcd file and load the point cloud data
PointCloud<PointXYZ>::Ptr cloud(new PointCloud<PointXYZ>);
if (io::loadPCDFile("test.pcd", *cloud) == -1)
	return -1;
Create a window object
Define the name "3D viewer" for the title block. The type of viewer is boost::shared_ptr, can only share the pointer to ensure that the pointer is used globally in the whole program without causing memory errors
boost::shared_ptr<visualization::PCLVisualizer> viewer(new visualization::PCLVisualizer("3D viewer"));
Set the background of the window viewer to full black
viewer->setBackgroundColor(0, 0, 0);
If you don't want a monochrome point cloud, you can render the color of the point cloud according to the depth of the z axis
pcl::visualization::PointCloudColorHandlerGenericField<pcl::PointXYZ> fildColor(cloud, "z");
Add point cloud to window
viewer->addPointCloud<PointXYZ>(cloud, fildColor, "sample cloud");
viewer->setPointCloudRenderingProperties(visualization::PCL_VISUALIZER_POINT_SIZE, 2, "sample cloud");
/*Sets the size and length of the three XYZ axes, which can also be defaulted
 Viewing complex point cloud images will make users have no sense of direction. In order to maintain correct direction judgment, coordinate axes need to be displayed. The three coordinate axes X (R, red) Y(G, green) Z (B, blue) are replaced by cylinders of three different colors
*/
Add the point cloud data to the window and define a unique string as the ID number. Use this ID number to ensure that other member methods can also represent the point cloud.
*Multiple calls to addPointCloud() can realize the superposition of multiple point clouds
*There is also the updatePointCloud() method to update the point cloud
Setting of camera parameters

This picture clearly shows the relationship between camera coordinate system and radar coordinate system
• Camera: x = right, y = down, z = forward
• Velodyne: x = forward, y = left, z = up
• GPS/IMU: x = forward, y = left, z = up

The physical distance can be obtained from the above figure
Thus, the viewing angle and direction of the camera in the point cloud can be determined
viewer->addCoordinateSystem(1.0);
/* By setting camera parameters, the user views the point from the default angle and direction */
viewer->initCameraParameters();
viewer->setCameraPosition(0.27, 0, -0.08, 1, 0, 0, 0, 0, 1);
Explain several variables in setCameraPostion
posX,posY,posZ: observation point coordinates
viewX,viewY,viewZ: viewing angle orientation
upX,upY,upZ: upward
Look at the effect

The visual label is not involved yet. It is just for comparison
It can be seen that there is no need to drag manually. After setting, the running window defaults to the same viewing angle as the camera
Keep window open
Keep the window open through the while loop, and refresh the window according to the specified time
while (!viewer->wasStopped())
{
	viewer->spinOnce(100);
	boost::this_thread::sleep(boost::posix_time::microseconds(1000));
}
3D tag data visualization
In the label of KITTI dataset, we use the 6 data of x, y, z, length, height and width in the label data to solve the 6 corner coordinates required by pcl to draw a rectangle
Define a label structure first
struct Kitti_Label
{
	//category
	std::string cls;// 9 classes
	//Truncation degree from 0 (truncation) - 1 (non truncation)
	float truncated;
	//Occlusion degree 0: completely visible 1: partially occluded 2: mostly occluded 3: completely occluded
	short occlusion;
	//Viewing angle range of object [- pi,pi]
	float alpha;
	//2D bounding box of the object, pixel coordinates of the upper left corner and lower right corner
	float pt1[2];
	float pt2[2];
	//Dimension of three-dimensional object, in m
	float height;
	float width;
	float length;
	//Position of 3D object (unit: m in camera coordinate system)
	float x;
	float y;
	float z;
	//The spatial direction of the three-dimensional object, the rotation angle relative to the y-axis in the camera coordinate system, range [- pi,pi]
	float rotation_y;
}
Read label and write member variable
ifstream txtfile("test.txt");
Kitti_Label test[100];
string s;

int num_tar = 0;
while (getline( txtfile, s))
{
	string sTmp[15];
	istringstream istr(s);
	int i = 0;
	while(!istr.eof())
	{
		istr >> sTmp[i];
		i++;
	}
	test[num_tar].cls = sTmp[0]
	test[num_tar].x = atof(sTmp[11].c_str());
	test[num_tar].y = atof(sTmp[12].c_str());
	test[num_tar].z = atof(sTmp[13].c_str());
	test[num_tar].height = atof(sTmp[8].c_str());
	test[num_tar].width = atof(sTmp[9].c_str());
	test[num_tar].length = atof(sTmp[10].c_str());

}
coordinate transformation
float x_min = test[num_tar].z - test[num_tar].length/2;
float y_min = -test[num_tar].x - test[num_tar].length/2;
float z_min = -test[num_tar].y;
float x_max = test[num_tar].z + test[num_tar].length/2;
float y_max = -test[num_tar].x + test[num_tar].length/2;
float z_max = -test[num_tar].y + test[num_tar].length;
It should also be noted that the coordinate definition of the point cloud label is based on the bottom center
Rectangular box drawing
viewer->addCube (x_min, x_max, y_min, y_max, z_min, z_max, 255, 0, 0, name, 0);
viewer->setShapeRenderingProperties(pcl::visualization::PCL_VISUALIZER_REPRESENTATION,pcl::visualization::PCL_VISUALIZER_REPRESENTATION_WIREFRAME, name);
Some blogs for reference:
https://blog.csdn.net/zjguilai/article/details/90168564
https://blog.csdn.net/qq_37534947/article/details/106628308
There are too many references. If this article uses your information but omits the lead link, please contact the blogger. Thank you!